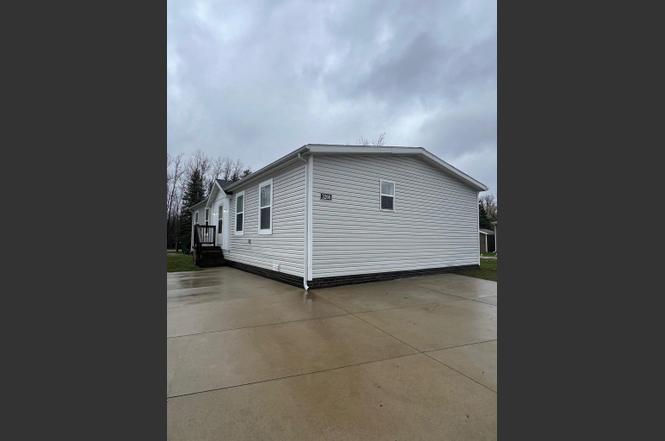
Beautiful Home 3268 Abbington · Jackson, MI
Flood risk No data
- FEMA flood zone
- —
- Chance of flooding over 30 yrs
- —
- Est. flood insurance / yr
- —
Fire risk No data
- Est. fire insurance / yr
- —
Heat risk No data
- Hot days now (above threshold)
- —
- Hot days in 30 yrs
- —
Wind risk No data
- Chance of severe wind over 30 yrs
- —
Air-quality risk No data
- Unhealthy air days now
- —
- Unhealthy air days in 30 yrs
- —
Risk factors via First Street. Map © Google.
Why this score? — see what drove the B grade
The composite is a weighted blend of 9 inputs, each scored 0–100. Each bar is that input's sub-score; the figure is the points it added to the 100-point composite (weight × sub-score).
- Cash flow +30.0/30.0
- 1% rule +10.0/10.0
- DSCR +10.0/10.0
- ARV discount +7.5/15.0
- Rent growth +5.0/5.0
- Livability +3.7/5.0
- Schools +2.6/10.0
- Condition / age +2.5/5.0
- Appreciation +0.0/10.0
$92,900
🖨 Deal sheet 📄 Offer letter ✓ Due diligence
Key facts
- Built 2024
- Listed 797 days
Property features AI
Finance
- Financial info: Listed for $92,900
Exterior
- Home design: Spec home from the "The Reserves" plan; Single-family property (details on stories and entry level not provided)
- Construction: Built/listed in 2024 (new construction inventory: Spec)
- Exterior features: Exterior details not provided
Interior
- Bedrooms: 3 bedrooms
- Bathrooms: 2 full bathrooms
- Interior features: Standard interior (no additional interior feature details provided)
Neighborhood map
What this means for you Summary
Snapshot
- This is a 3-bed/2.0-bath manufactured listed at $93k.
Deal economics
- At list price, monthly cash flow is $475 ($6k/yr) — positive.
- The deal already cash-flows at list — no discount required.
- Meets the 1% rule at list price ($1k rent vs $93k).
- Recommended offer: $82k (12.0% below list) — sets the bar for market timing.
- Cap rate 12.4% vs local median 5.4% in Jackson — top-decile yield for the area; either an underpriced asset or a hidden risk that comps aren't pricing in. Stress-test before assuming the spread holds.
Location & tenants
- Location reads 74/100 on livability (#197 in MI, #4,970 nationally) — a middle-class / working-renter tenant base. Strengths: cost of living A+, housing A+, health & safety A+; Watch: schools D, crime F, employment F.
- Northwest Community Schools (suburban): math 19% / reading 41% proficiency, ranked #360 of 540 in MI (top 67%) — families likely to look elsewhere, expect single-tenant / working-renter base with shorter leases.
- Market conditions: Rents rising fast (+10.3%/yr); 362 active listings in the ZIP; 1 comparable units currently listed for rent nearby; 317 units permitted in Jackson County in 2024 (103 in 5+ unit buildings).
Forward outlook
- Local home prices are declining (-3.0%/yr); year-one equity from $642 of loan paydown is wiped out by about $3k of value loss. Plan a longer hold.
- Jackson County population projected at -13% by 2050 — secular population decline; favor cash flow + early exit over multi-decade hold.
- At projected returns (-3.0% appreciation + 8.0% rent growth), your $26k cash investment doubles in ~5 years — after that, you're playing with house money.
Negotiation context
- It's been on market 798 days — a 12% lower offer ($82k) is reasonable based on typical stale-listing flexibility.
Questions for the listing agent
- It's been on market 798 days. Have you received any prior offers? Is the seller open to a 12% concession, seller financing, or rate buy-down credit?
- Why hasn't it sold? Are there any deal-killer items the seller is aware of (foundation, flood, title, zoning, code violations)?
- Is there a deadline driving the sale (1031 exchange, divorce, estate, relocation)? That informs how much negotiation room exists.
- Schools are D-rated, which usually means shorter tenancies and higher turnover. Who's the typical renter profile here, and what's been the actual vacancy rate?
- Crime grade is F in this area — have there been break-ins, vandalism, or insurance claims at this property in the last 3 years? What carrier currently insures it and at what premium?
- What's the average days-on-market for RENTAL listings here right now (not sales)? A rising rental-DOM trend means longer vacancies and softer asking-rent achievability than the comps imply.
- What's the recent tenant-quality profile in this submarket — average credit score on applications, eviction rate, late-payment / NSF rate, and stable-employment percentage? A property-management company in the area should have these aggregated.
- How much new for-sale + rental construction is in the pipeline within 1–3 miles? Heavy new supply typically softens prices + rents 12–24 months out; constrained supply supports both.
Investment metrics
- 1% rule
- 1.52% ✓
- Cap rate
- 12.43%
- Cash-on-cash
- 21.91%
- DSCR
- 1.98
- GRM
- 5.5
CMA / ARV
- ARV (on-the-fly)
- $45,472
- Comps found
- 5
Show comp detail 5 sales within ~0.75 mi
| Address | Dist | Beds/Ba | Sqft | Sold | Price | $/sf | Match |
|---|---|---|---|---|---|---|---|
| 3286 Braeburn St | 0.06mi | 2/2.0 (-1) | 1,540 (-2%) | 5mo | $20,000 | $13 | 85 |
| 3717 Cypress | 0.34mi | 3/2.0 | 1,516 (-3%) | 11mo | $40,000 | $26 | 70 |
| 3806 Catalpa | 0.28mi | 3/2.0 | 1,456 (-7%) | 14mo | $42,500 | $29 | 63 |
| 3844 Havenwood Blvd | 0.35mi | 3/2.0 | 1,456 (-7%) | 14mo | $53,000 | $36 | 60 |
| 3842 Jarrow Ln | 0.38mi | 3/2.0 | 1,404 (-10%) | 8mo | $64,000 | $46 | 58 |
Match score weights: distance 35% · size 25% · config 20% · recency 20%. Top-matched comps best support the ARV.
Projected returns pro-forma
-3.0% appreciation · 8.0% rent growth · sell at horizon
- IRR
- 20.1%
- Equity multiple
- 1.87×
- Total profit
- $22,695
- Equity at exit
- $13,852
- IRR
- 31.6%
- Equity multiple
- 4.57×
- Total profit
- $92,817
- Equity at exit
- $8,032
Cash invested: $26,012 (down + closing). Projections, not guarantees.
Landlord ↔ Tenant lean methodology
- Overall (STATE)
- 62 Landlord-Friendly
- State Michigan
- 62 Landlord-Friendly · EVEN
- County
- — inherits STATE
- City
- — inherits STATE
ZIP-level market 49201
- Rents YoY
- 10.3%
- Active inventory
- 362
- Price-to-rent
- 5.5×
Monthly cashflow live
- Estimated rent
- $1,414 medium interval (Pro) →
- Mortgage (P&I)
- −$487
- Tax est. 1.5%
- −$116 /mo · $1,394/yr
- Insurance
- −$39
- HOA
- −$0
- Vacancy / Maint / Mgmt
- −$297
- Net cashflow
- $475
Break-even live
UW: 25.0% down · 7.5% · 30yr · 1.5% tax · 5.0% vac · 8.0% maint · 8.0% mgmt
Financing live
Cash to close
- Down payment
- $23,225
- Closing costs
- $2,787
- Reserves months
- —
- Total cash needed
- —
Loan-product check · same deal, 3 products live
Conventional
25% down · 7.5% · 30yr
- Down + closing
- —
- Monthly P&I
- —
- Monthly cashflow
- —
- DSCR
- —
- Eligible?
- —
Personal DTI + credit; lowest rate.
DSCR
20% down · 8.5% · 30yr
- Down + closing
- —
- Monthly P&I
- —
- Monthly cashflow
- —
- DSCR
- —
- Eligible?
- —
No personal income docs; deal must DSCR.
Hard money
10% down · 12.0% · 12mo
- Down + closing
- —
- Monthly P&I
- —
- Monthly cashflow
- —
- DSCR
- —
- Eligible?
- —
Short-term bridge; refi at stabilization.
Rent comps 1 comps
| Address | Beds | Baths | Sqft | Rent | $/sqft | DOM | Units | Dist |
|---|---|---|---|---|---|---|---|---|
| 3999 Sherwood Lakes Blvd Jackson, MI | 3.0 | 2.0 | 1056 | $1,339 | $1.27 | 44d | 1 | 0.11mi |
Listing history 17 events
-
2026-06-19days on market $92,900 Active 798 DOM
-
2026-06-18days on market $92,900 Active 797 DOM
-
2026-06-17days on market $92,900 Active 796 DOM
-
2026-06-16days on market $92,900 Active 795 DOM
-
2026-06-15days on market $92,900 Active 794 DOM
-
2026-06-14days on market $92,900 Active 792 DOM
-
2026-06-13days on market $92,900 Active 791 DOM
-
2026-06-10days on market $92,900 Active 789 DOM
-
2026-06-09days on market $92,900 Active 788 DOM
-
2026-06-08days on market $92,900 Active 787 DOM
-
2026-06-07days on market $92,900 Active 786 DOM
-
2026-06-05days on market $92,900 Active 783 DOM
-
2026-06-03days on market $92,900 Active 782 DOM
-
2026-06-02days on market $92,900 Active 781 DOM
-
2026-06-01days on market $92,900 Active 780 DOM
-
2026-05-31days on market $92,900 Active 779 DOM
-
2026-05-30days on market $92,900 Active 778 DOM
ⓘ Source: listings_history table (triggers on properties + properties_extension) + one-shot
backfill from property_details.listing_events for pre-trigger history.
Nearby sold comps map
Loading sold comps map…
Walkable amenities ~0.75 mi
Loading nearby amenities…
Taxation est. · year 1
- Rental income
- $16,968
- − Mortgage interest
- −$5,204
- − Property taxes
- −$1,394
- − Insurance
- −$464
- − Repairs & maintenance
- −$1,357
- − Management
- −$1,357
- − Depreciation
- −$2,703
- Taxable income
- $4,488
- Est. tax owed @ 24.0%
- −$1,077
- After-tax cash flow
- $4,623/yr
For passive investors: Depreciation is non-cash, so a rental often shows a tax loss while cash-flowing — sheltering income. Rental losses are passive: they offset passive income freely, and up to $25,000/yr can offset ordinary (W-2) income if you actively participate and your MAGI is under $100k (phasing out to $0 by $150k); unused losses carry forward. On sale, claimed depreciation is recaptured at up to 25%, and gains may owe capital-gains tax (a 1031 exchange can defer both). Figures are a year-1 estimate at your 24.0% rate — not tax advice; consult a CPA.
Schools (NCES district)
- District
- Northwest Community Schools
- NCES district ID
- 2626010
- Math proficiency
- 19% ▼ -8.00%
- Reading proficiency
- 41% ▼ -1.00%
- Median HH income
- $47,509
- Composite
- 25.88/100
- National rank
- #7342
- State rank
- #360 of 540 in MI
Livability — Jackson
- Score
- 74/100
- State rank
- #197
- US rank
- #4970
Category grades
Schools grade is shown separately in the Schools card above.
Census & demographics
- County
- Jackson County · 85,581 people
- City population
- 85,581
- Metro
- Jackson, MI
- Population (ZIP)
- 49,107
- Household income
- $74,484
- Rent vs Own
- Severe rent burden
- 840.0
Population outlook (Jackson County) Hauer SSP2
- Today (2025)
- 156,365 people
- By 2030
- 153,123 · -2.1%
- By 2040
- 144,981 · -7.3%
- By 2050
- 135,671 · -13.2%
- By 2075
- 113,833 · -27.2%
- By 2100
- 86,592 · -44.6%
Race, ethnicity, and origin ACS 2023
- Neighborhood character
- Predominantly White (80%)
- Race & ethnicity
- White 80% Black 9% Two or more races 6% Hispanic / Latino 5%
- Hispanic origin (detail)
- Mexican 4%
- Common ancestry
- Romanian 7% Lithuanian 3% Slovak 2%
- Foreign-born
- 3% · Canada
- Languages at home
- 96% English-only · Spanish 2% Other Indo-European 1% Russian/Polish/Slavic 1%
Political lean MEDSL · Jackson
- 2024 margin
- Strong R (+21.3) · D 38.6% · R 59.9% · Other 1.5%
- 2008→2024 swing
- -23.7pp toward R · 2008: 2.4pp · 2024: -21.3pp
- All cycles
- 2024: R+21.3 2020: R+19.0 2016: R+20.1 2012: R+5.8 2008: D+2.4
Not yet ingested
- Civics
- —
Market trends
- HPI YoY
- ▼ -198.89%
- Current HPI
- 185.3773
- Rent YoY
- ▲ 10.32%
- Metro
- Jackson, MI
- State GDP YoY
- ▲ 1.37%
- F500 in state
- 28
Industry mix (Fortune 500 HQ in MI)
| Industry | F500 HQs | Revenue |
|---|---|---|
| Automotive Parts | 3 | $48B |
|
||
| Automotive | 2 | $372B |
|
||
| Chemicals | 1 | $45B |
|
||
| Automotive Retail | 1 | $29B |
|
||
| Healthcare / Medical Devices | 1 | $23B |
|
||
| Automotive Technology | 1 | $20B |
|
||
Cash-flow waterfall
monthlySold comps — $/sqft
last 12 mo · ≤1 miLoading sold comps…