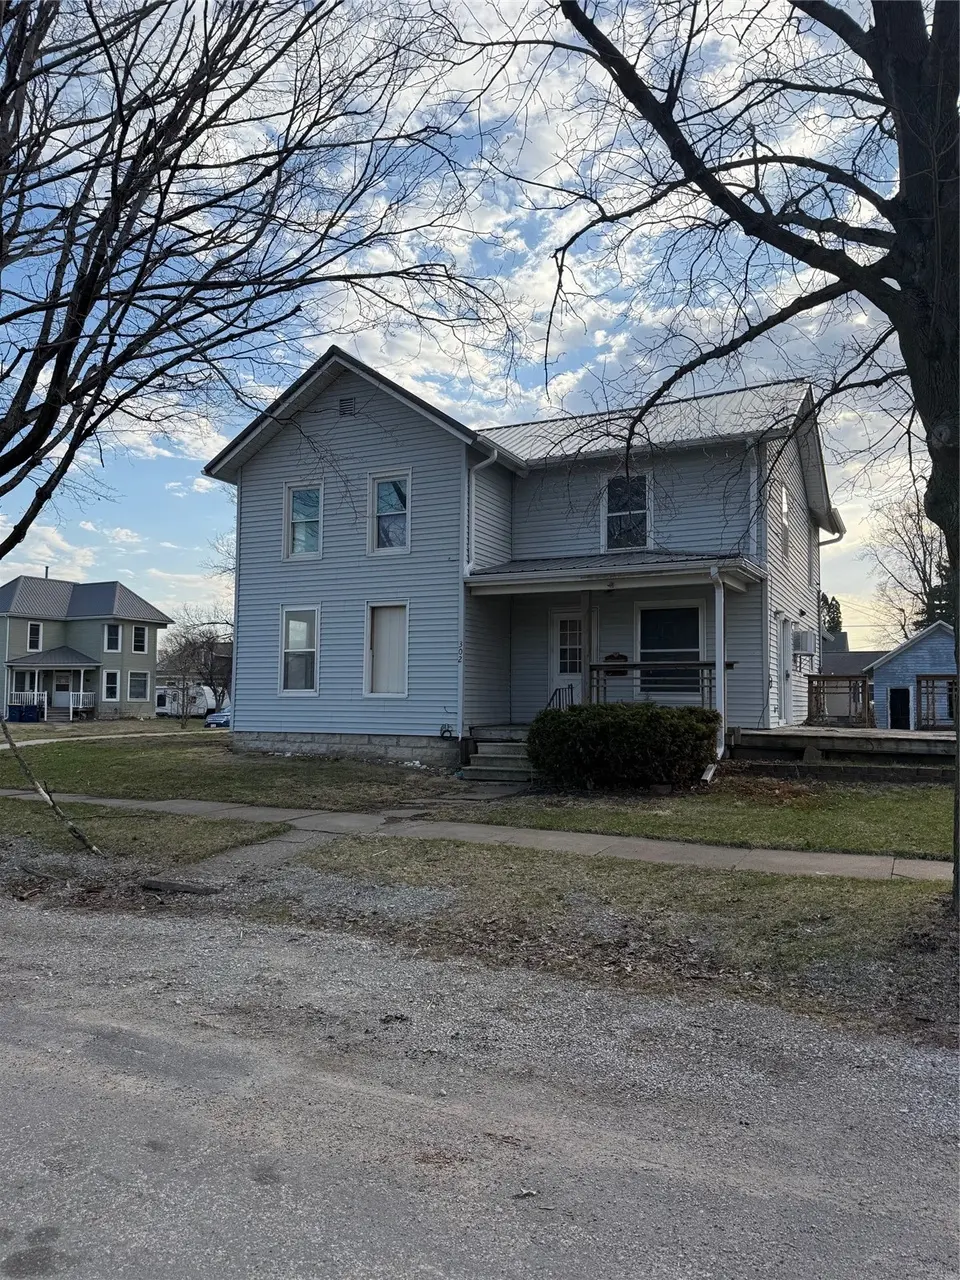
302 9th St E · Vinton, IA
Flood risk 1/10 · Minimal
- FEMA flood zone
- X (unshaded)
- Chance of flooding over 30 yrs
- 0.0%
- Est. flood insurance / yr
- $473 – $860
Fire risk 4/10 · Minor
- Est. fire insurance / yr
- $902 – $1,676
Heat risk 3/10 · Minor
- Hot days now (above 103°F)
- 7 days/yr
- Hot days in 30 yrs
- 15 days/yr
Wind risk 2/10 · Minimal
- Chance of severe wind over 30 yrs
- —
Air-quality risk 2/10 · Minimal
- Unhealthy air days now
- 0 days/yr
- Unhealthy air days in 30 yrs
- 1 days/yr
Risk factors via First Street. Map © Google.
Why this score? — see what drove the C- grade
The composite is a weighted blend of 9 inputs, each scored 0–100. Each bar is that input's sub-score; the figure is the points it added to the 100-point composite (weight × sub-score).
- Cash flow +16.5/30.0
- ARV discount +7.5/15.0
- Schools +6.6/10.0
- 1% rule +5.8/10.0
- DSCR +5.1/10.0
- Livability +4.0/5.0
- Rent growth +2.5/5.0
- Condition / age +2.5/5.0
- Appreciation +0.0/10.0
$89,000
🖨 Deal sheet 📄 Offer letter ✓ Due diligence
Listing remarks MLS
Incredible opportunity on a large corner lot with two garages! This fully gutted home is the perfect blank slate for your next project, with several major updates already completed. Recent improvements include a brand-new metal roof and gutters on the home, a new asphalt roof on the main garage, and a new dedicated water line connected to the city’s updated main. Electrical service has been newly trenched to the house and both garages, setting the stage for future development. A large half-dead tree has been removed and the stump professionally ground, opening up the spacious yard even more. With a huge lot, two sizable garages, and big-ticket items already done, this property offers endless potential for renovation, investment, or a custom rebuild.
Key facts
- Spacious yard
- New metal roof
- New asphalt roof
Tags
Neighborhood map
What this means for you Summary
Snapshot
- This is a 3-bed/1.5-bath single-family listed at $89k.
Deal economics
- At list price, monthly cash flow is $53 ($630/yr) — positive.
- The deal already cash-flows at list — no discount required.
- Meets the 1% rule at list price ($960 rent vs $89k).
- Recommended offer: $86k (3.0% below list) — sets the bar for market timing.
- Cap rate 7.0% vs local median 1.9% in Vinton — top-decile yield for the area; either an underpriced asset or a hidden risk that comps aren't pricing in. Stress-test before assuming the spread holds.
Location & tenants
- Location reads 80/100 on livability (#88 in IA, #1,848 nationally) — a professional / high-income tenant draw. Strengths: schools A+, crime A+, cost of living A+; Watch: employment C-, amenities F, commute F.
- Vinton-Shellsburg Community School District (rural): math 79% / reading 77% proficiency, ranked #43 of 289 in IA (top 15%) — strong family-tenant draw, lease renewals of 3-5y typical.
- Market conditions: 61 active listings in the ZIP; 34 units permitted in Benton County in 2024 (0 in 5+ unit buildings).
Forward outlook
- Local home prices are declining (-3.0%/yr); year-one equity from $615 of loan paydown is wiped out by about $3k of value loss. Plan a longer hold.
- Benton County population projected at -13% by 2050 — secular population decline; favor cash flow + early exit over multi-decade hold.
Negotiation context
- It's been on market 43 days — a 3% lower offer ($86k) is reasonable based on typical stale-listing flexibility.
- 2 sale attempts since 2y ago with the ask held roughly flat each time — persistent listings suggest the price (not the market) is what's stuck; bring a comps-based counter.
- Current owner paid $60k; 48% above their basis — modest negotiation headroom, anchor on the comps not their cost.
Risks & watch-outs
- Watch-outs: property tax is 2.7% of price; built in 1920 — expect roof / HVAC / electrical / plumbing capex.
Questions for the listing agent
- It's been on market 43 days. Have you received any prior offers? Is the seller open to a 3% concession, seller financing, or rate buy-down credit?
- Built in 1920 — when were the roof, HVAC, electrical panel, plumbing, and water heater last replaced?
- Property tax is high relative to price — has the assessment been appealed recently, and will the sale trigger a re-assessment?
- Is there a deadline driving the sale (1031 exchange, divorce, estate, relocation)? That informs how much negotiation room exists.
- Schools are A-rated — typically a magnet for longer-tenancy family renters. What's the average tenant stay here, and is there a school-zone premium baked into asking?
- What's the average days-on-market for RENTAL listings here right now (not sales)? A rising rental-DOM trend means longer vacancies and softer asking-rent achievability than the comps imply.
- What's the recent tenant-quality profile in this submarket — average credit score on applications, eviction rate, late-payment / NSF rate, and stable-employment percentage? A property-management company in the area should have these aggregated.
- How much new for-sale + rental construction is in the pipeline within 1–3 miles? Heavy new supply typically softens prices + rents 12–24 months out; constrained supply supports both.
Investment metrics
- 1% rule
- 1.08% ✓
- Cap rate
- 7.00%
- Cash-on-cash
- 2.53%
- DSCR
- 1.11
- GRM
- 7.7
CMA / ARV
- ARV (median comp)
- $211,824
- List price
- $89,000
- Delta
- -57.98%
- Verdict
- UNDERPRICED
- Comps
- 20 within 1.0 mi
Show comp detail 12 sales within ~0.75 mi
| Address | Dist | Beds/Ba | Sqft | Sold | Price | $/sf | Match |
|---|---|---|---|---|---|---|---|
| 507 W 13th St | 0.49mi | 2/1.5 (-1) | 1,730 (+2%) | 2mo | $175,000 | $101 | 66 |
| 909 S 8th Ave | 0.30mi | 3/2.0 | 1,539 (-9%) | 5mo | $135,000 | $88 | 66 |
| 209 5th St St W | 0.38mi | 4/2.5 (+1) | 1,619 (-4%) | 2mo | $81,000 | $50 | 65 |
| 909 W 13th St | 0.72mi | 3/2.0 | 1,671 (-1%) | 3mo | $294,000 | $176 | 60 |
| 601 E 11th St | 0.22mi | 4/2.5 (+1) | 1,898 (+12%) | 1mo | $235,500 | $124 | 60 |
| 1112 A Ave | 0.25mi | 4/2.0 (+1) | 1,470 (-13%) | 4mo | $179,500 | $122 | 57 |
| 1107 G Ave | 0.60mi | 3/2.0 | 1,861 (+10%) | 0mo | $358,000 | $192 | 53 |
| 807 W 13th St | 0.67mi | 3/2.0 | 1,523 (-10%) | 1mo | $312,000 | $205 | 50 |
| 1307 G Ave Ave | 0.65mi | 3/2.0 | 1,812 (+7%) | 8mo | $210,000 | $116 | 49 |
| 206 N 8th Ave | 0.75mi | 3/2.0 | 1,809 (+7%) | 6mo | $185,000 | $102 | 46 |
| 503 3rd St St W | 0.59mi | 4/2.0 (+1) | 1,888 (+12%) | 4mo | $140,000 | $74 | 42 |
| 912 E 2nd St St | 0.67mi | 4/2.0 (+1) | 1,940 (+15%) | 4mo | $212,500 | $110 | 33 |
Match score weights: distance 35% · size 25% · config 20% · recency 20%. Top-matched comps best support the ARV.
Projected returns pro-forma
-3.0% appreciation · 3.0% rent growth · sell at horizon
- IRR
- -12.2%
- Equity multiple
- 0.56×
- Total profit
- $-11,006
- Equity at exit
- $13,270
- IRR
- -3.0%
- Equity multiple
- 0.80×
- Total profit
- $-4,990
- Equity at exit
- $7,695
Cash invested: $24,920 (down + closing). Projections, not guarantees.
Landlord ↔ Tenant lean methodology
- Overall (STATE)
- 83 Strongly Landlord-Friendly
- State Iowa
- 83 Strongly Landlord-Friendly · R+6
- County
- — inherits STATE
- City
- — inherits STATE
ZIP-level market 52349
- Home prices YoY
- -29.0%
- Active inventory
- 61
- Price-to-rent
- 7.7×
Monthly cashflow live
- Estimated rent
- $960 medium interval (Pro) →
- Mortgage (P&I)
- −$467
- Tax from tax record
- −$202 /mo · $2,428/yr
- Insurance
- −$37
- HOA
- −$0
- Vacancy / Maint / Mgmt
- −$202
- Net cashflow
- $53
Break-even live
UW: 25.0% down · 7.5% · 30yr · 1.5% tax · 5.0% vac · 8.0% maint · 8.0% mgmt
Financing live
Cash to close
- Down payment
- $22,250
- Closing costs
- $2,670
- Reserves months
- —
- Total cash needed
- —
Loan-product check · same deal, 3 products live
Conventional
25% down · 7.5% · 30yr
- Down + closing
- —
- Monthly P&I
- —
- Monthly cashflow
- —
- DSCR
- —
- Eligible?
- —
Personal DTI + credit; lowest rate.
DSCR
20% down · 8.5% · 30yr
- Down + closing
- —
- Monthly P&I
- —
- Monthly cashflow
- —
- DSCR
- —
- Eligible?
- —
No personal income docs; deal must DSCR.
Hard money
10% down · 12.0% · 12mo
- Down + closing
- —
- Monthly P&I
- —
- Monthly cashflow
- —
- DSCR
- —
- Eligible?
- —
Short-term bridge; refi at stabilization.
Listing history 13 events
-
2026-05-07status Pending 765-char remark
Show marketing remark (765 chars)
Incredible opportunity on a large corner lot with two garages! This fully gutted home is the perfect blank slate for your next project, with several major updates already completed. Recent improvements include a brand-new metal roof and gutters on the home, a new asphalt roof on the main garage, and a new dedicated water line connected to the city’s updated main. Electrical service has been newly trenched to the house and both garages, setting the stage for future development. A large half-dead tree has been removed and the stump professionally ground, opening up the spacious yard even more. With a huge lot, two sizable garages, and big-ticket items already done, this property offers endless potential for renovation, investment, or a custom rebuild.
-
2026-03-25$89,000 Active 765-char remark
Show marketing remark (765 chars)
Incredible opportunity on a large corner lot with two garages! This fully gutted home is the perfect blank slate for your next project, with several major updates already completed. Recent improvements include a brand-new metal roof and gutters on the home, a new asphalt roof on the main garage, and a new dedicated water line connected to the city’s updated main. Electrical service has been newly trenched to the house and both garages, setting the stage for future development. A large half-dead tree has been removed and the stump professionally ground, opening up the spacious yard even more. With a huge lot, two sizable garages, and big-ticket items already done, this property offers endless potential for renovation, investment, or a custom rebuild.
-
2026-01-27price $100,000
-
2024-09-03soldstatus $60,000
-
2024-08-30soldstatus $60,000 Closed
-
2024-08-12status Pending
-
2024-08-07price $70,000
-
2024-07-12$80,000 Active
-
2014-07-09soldstatus $75,143
-
2014-06-03soldstatus $74,500
-
2011-08-31soldstatus $85,000
-
1993-08-06soldstatus $55,500
-
1982-06-25soldstatus $42,750
ⓘ Source: listings_history table (triggers on properties + properties_extension) + one-shot
backfill from property_details.listing_events for pre-trigger history.
Tax reassessment forecast IA · Partial reset (capped growth)
- Current annual tax
- $2,428 · $202/mo
- Projected year-2 tax
- $2,428 · $202/mo
- Expected delta
- $0/yr ($0/mo · 0.0%)
ⓘ Screening estimate from a state-policy table — verify with the county assessor before closing.
Climate risk First Street
- Flood 1/10 Low FEMA zone X (unshaded) · 0% chance over 30 yrs
- Wildfire 4/10 Moderate
- Heat 3/10 Moderate 7 d/yr ≥103°F today · 15 d/yr by 30 yrs out
- Wind 2/10 Low
- Air quality 2/10 Low 0 unhealthy d/yr today · 1 by 30 yrs out
Nearby sold comps map
Loading sold comps map…
Walkable amenities ~0.75 mi
Loading nearby amenities…
Taxation est. · year 1
- Rental income
- $11,524
- − Mortgage interest
- −$4,985
- − Property taxes
- −$2,428
- − Insurance
- −$445
- − Repairs & maintenance
- −$922
- − Management
- −$922
- − Depreciation
- −$2,589
- Taxable loss
- −$767
- Est. tax savings @ 24.0%
- +$184
- After-tax cash flow
- $814/yr
For passive investors: Depreciation is non-cash, so a rental often shows a tax loss while cash-flowing — sheltering income. Rental losses are passive: they offset passive income freely, and up to $25,000/yr can offset ordinary (W-2) income if you actively participate and your MAGI is under $100k (phasing out to $0 by $150k); unused losses carry forward. On sale, claimed depreciation is recaptured at up to 25%, and gains may owe capital-gains tax (a 1031 exchange can defer both). Figures are a year-1 estimate at your 24.0% rate — not tax advice; consult a CPA.
Schools (NCES district)
- District
- Vinton-Shellsburg Community School District
- NCES district ID
- 1929310
- Math proficiency
- 79% ▼ -6.00%
- Reading proficiency
- 77% ▼ -1.00%
- Median HH income
- $52,023
- Composite
- 66.21/100
- National rank
- #430
- State rank
- #43 of 289 in IA
Livability — Vinton
- Score
- 80/100
- State rank
- #88
- US rank
- #1848
Category grades
Schools grade is shown separately in the Schools card above.
Census & demographics
- Census place
- Vinton, IA
- Population (ZIP)
- 7,745
Population outlook (Benton County) Hauer SSP2
- Today (2025)
- 25,078 people
- By 2030
- 24,606 · -1.9%
- By 2040
- 23,425 · -6.6%
- By 2050
- 21,891 · -12.7%
- By 2075
- 19,482 · -22.3%
- By 2100
- 17,139 · -31.7%
Race, ethnicity, and origin ACS 2023
- Neighborhood character
- Predominantly White (94%)
- Race & ethnicity
- White 94% Two or more races 4% Hispanic / Latino 2%
- Common ancestry
- Portuguese 7% Italian 3% Iranian 3%
- Foreign-born
- 1% · Canada
- Languages at home
- 96% English-only · German/W. Germanic 2% Spanish 2%
Political lean MEDSL · Benton
- 2024 margin
- Solid R (+33.2) · D 32.8% · R 66.0% · Other 1.3%
- 2008→2024 swing
- -37.7pp toward R · 2008: 4.5pp · 2024: -33.2pp
- All cycles
- 2024: R+33.2 2020: R+27.5 2016: R+26.0 2012: R+0.6 2008: D+4.5
Not yet ingested
- Civics
- —
Market trends
- HPI YoY
- ▼ -80.56%
- Current HPI
- 197.3164
- Rent YoY
- —
- Metro
- —
- State GDP YoY
- ▲ 2.48%
- F500 in state
- 4
Industry mix (Fortune 500 HQ in IA)
| Industry | F500 HQs | Revenue |
|---|---|---|
| Financial Services | 1 | $16B |
|
||
| Retail / Convenience | 1 | $15B |
|
||
Price history
+108.2% since first listed13 events — show timeline
- 2026-05-07 Pending — CRAAR, CDRMLS
- 2026-03-25 Listed $89,000 CRAAR, CDRMLS
- 2026-01-27 Price Changed $100,000 CRAAR, CDRMLS
- 2024-09-03 Sold (Public Records) $60,000 Public Records
- 2024-08-30 Sold (MLS) $60,000 CRAAR, CDRMLS
- 2024-08-12 Pending — CRAAR, CDRMLS
- 2024-08-07 Price Changed $70,000 CRAAR, CDRMLS
- 2024-07-12 Listed $80,000 CRAAR, CDRMLS
- 2014-07-09 Sold (Public Records) $75,143 Public Records
- 2014-06-03 Sold (Public Records) $74,500 Public Records
- 2011-08-31 Sold (Public Records) $85,000 Public Records
- 1993-08-06 Sold (Public Records) $55,500 Public Records
- 1982-06-25 Sold (Public Records) $42,750 Public Records
Property tax history
+2.9%/yrLatest (2025): $2,428 · +2.0% YoY. Source: county tax records.
Cash-flow waterfall
monthlySold comps — $/sqft
last 12 mo · ≤1 miLoading sold comps…