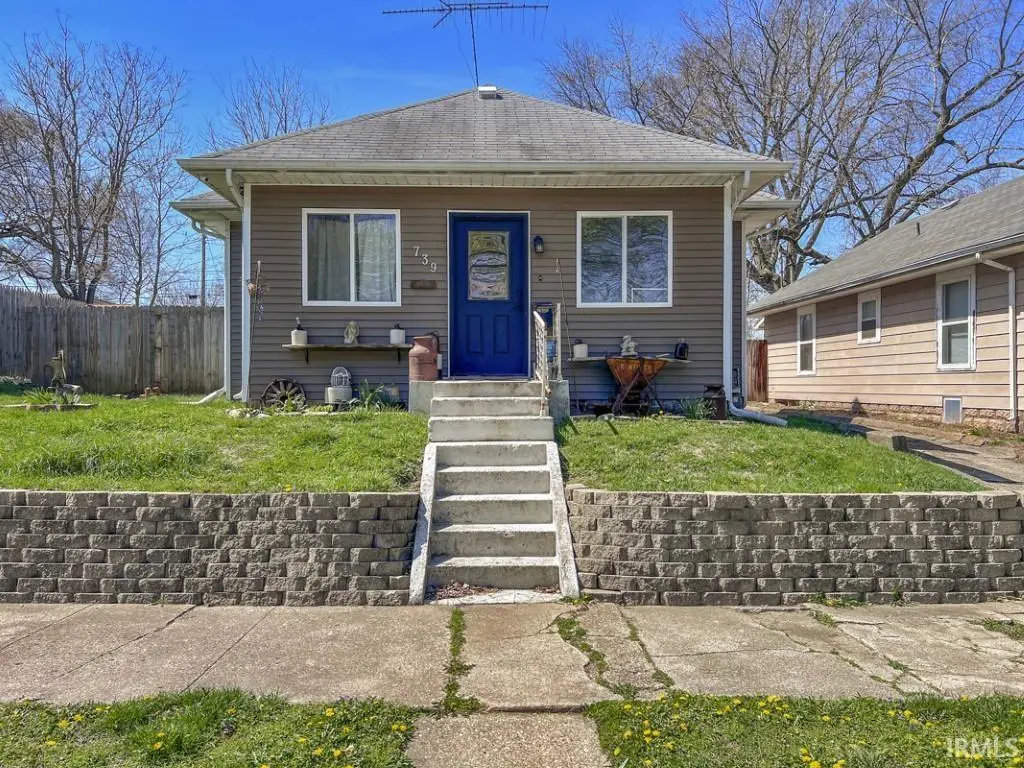
739 S Jay St · Kokomo, IN
Flood risk 1/10 · Minimal
- FEMA flood zone
- X (unshaded)
- Chance of flooding over 30 yrs
- 0.0%
- Est. flood insurance / yr
- $473 – $860
Fire risk 1/10 · Minimal
- Est. fire insurance / yr
- $717 – $1,331
Heat risk 3/10 · Minor
- Hot days now (above 102°F)
- 7 days/yr
- Hot days in 30 yrs
- 17 days/yr
Wind risk 2/10 · Minimal
- Chance of severe wind over 30 yrs
- —
Air-quality risk 3/10 · Minor
- Unhealthy air days now
- 2 days/yr
- Unhealthy air days in 30 yrs
- 3 days/yr
Risk factors via First Street. Map © Google.
Why this score? — see what drove the B+ grade
The composite is a weighted blend of 9 inputs, each scored 0–100. Each bar is that input's sub-score; the figure is the points it added to the 100-point composite (weight × sub-score).
- Cash flow +30.0/30.0
- ARV discount +15.0/15.0
- 1% rule +10.0/10.0
- DSCR +10.0/10.0
- Livability +3.4/5.0
- Condition / age +2.5/5.0
- Rent growth +2.1/5.0
- Schools +2.1/10.0
- Appreciation +0.0/10.0
$84,900
🖨 Deal sheet 📄 Offer letter ✓ Due diligence
Listing remarks
If you’ve been looking for a home with great potential in a central location, this 3 bedroom, 1.5 bath property is worth a look. Situated close to all the new downtown development and with easy access to Markland Avenue, you’re just minutes from shopping, restaurants, and everyday conveniences. Inside, the home offers a spacious main level with a large living area that flows into a dining room and an ample sized kitchen, creating a semi open layout that works well for daily living or entertaining. The main floor primary bedroom includes its own en suite bathroom with a walk in shower and a sliding glass door that leads directly to a large wooden deck, perfect for relaxing outdoo
Key facts
- Large wooden deck
- Central location
- Bonus room
Tags
Property features AI
Finance
- Other: Listing broker: The Hardie Group
Exterior
- Parking: Detached concrete garage with 2 spaces
- Utilities: Public water; Public sewer; Cable connected
- Home design: Single-family residence (site-built); 2 stories
- Construction: Aluminum and vinyl siding; Block foundation; Built as site-built home
- Exterior features: Enclosed porch; Deck; Partial privacy fencing; Rolling slope lot; Lot dimensions approximately 50 x 128
Interior
- Kitchen: Microwave; Refrigerator; Gas range
- Bedrooms: Total rooms: 7
- Flooring: Carpet; Laminate; Vinyl
- Bathrooms: 1 full bathroom; 1 half bathroom; 1 main-level bathroom
- Heating & cooling: Natural gas forced-air heating; Central air conditioning
- Interior features: Laminate counters; 1 fireplace (no special features listed)
- Laundry & utility: Washer hookup; Electric dryer hookup; Main-level laundry
Neighborhood map
What this means for you Summary
Snapshot
- This is a 4-bed/1.5-bath single-family listed at $85k.
Deal economics
- At list price, monthly cash flow is $600 ($7k/yr) — positive.
- The deal already cash-flows at list — no discount required.
- Meets the 1% rule at list price ($1k rent vs $85k).
- Recommended offer: $84k (1.5% below list) — sets the bar for market timing.
- Cap rate 14.8% vs local median 5.2% in Kokomo — top-decile yield for the area; either an underpriced asset or a hidden risk that comps aren't pricing in. Stress-test before assuming the spread holds.
Location & tenants
- Location reads 68/100 on livability (#227 in IN) — a middle-class / working-renter tenant base. Strengths: cost of living A+, housing A+, health & safety A; Watch: crime D, amenities F, commute F.
- Kokomo School Corporation (urban): math 22% / reading 30% proficiency, ranked #264 of 301 in IN (top 88%) — low school quality limits family demand, transient renter base, plan for 1-2y turnover; 62% free/reduced lunch — lower-income household profile, screen leases tightly.
- Zoned schools: Elwood Haynes Elementary School (math 22% / reading 17%, grade F, #814 of 994 statewide, top 83%, 611 students, 88% FRL); Central Middle School (math 23% / reading 38%, grade F, #203 of 330 statewide, top 63%, 458 students, 57% FRL); Kokomo High School (math 19% / reading 48%, grade F, #289 of 369 statewide, top 78%, 1,519 students, 58% FRL).
- Market conditions: Rents soft (-1.5%/yr); 242 active listings in the ZIP; 194 units permitted in Howard County in 2024 (0 in 5+ unit buildings).
Forward outlook
- Local home prices are declining (-3.0%/yr); year-one equity from $587 of loan paydown is wiped out by about $3k of value loss. Plan a longer hold.
- Howard County population projected at -11% by 2050 — secular population decline; favor cash flow + early exit over multi-decade hold.
- At projected returns (-3.0% appreciation + 0.0% rent growth), your $24k cash investment doubles in ~5 years — after that, you're playing with house money.
Negotiation context
- It's been on market 21 days — a 2% lower offer ($84k) is reasonable based on typical stale-listing flexibility.
- Current owner paid $30k; list at $85k implies a 183% gain — meaningful room to come down on a strong offer.
Risks & watch-outs
- Watch-outs: built in 1908 — expect roof / HVAC / electrical / plumbing capex.
Questions for the listing agent
- Built in 1908 — when were the roof, HVAC, electrical panel, plumbing, and water heater last replaced?
- Is there a deadline driving the sale (1031 exchange, divorce, estate, relocation)? That informs how much negotiation room exists.
- Schools are F-rated, which usually means shorter tenancies and higher turnover. Who's the typical renter profile here, and what's been the actual vacancy rate?
- Crime grade is D in this area — have there been break-ins, vandalism, or insurance claims at this property in the last 3 years? What carrier currently insures it and at what premium?
- What's the average days-on-market for RENTAL listings here right now (not sales)? A rising rental-DOM trend means longer vacancies and softer asking-rent achievability than the comps imply.
- What's the recent tenant-quality profile in this submarket — average credit score on applications, eviction rate, late-payment / NSF rate, and stable-employment percentage? A property-management company in the area should have these aggregated.
- How much new for-sale + rental construction is in the pipeline within 1–3 miles? Heavy new supply typically softens prices + rents 12–24 months out; constrained supply supports both.
Investment metrics
- 1% rule
- 1.71% ✓
- Cap rate
- 14.77%
- Cash-on-cash
- 30.29%
- DSCR
- 2.35
- GRM
- 4.9
CMA / ARV
- ARV (on-the-fly)
- $162,656
- Comps found
- 12
Show comp detail 12 sales within ~0.75 mi
| Address | Dist | Beds/Ba | Sqft | Sold | Price | $/sf | Match |
|---|---|---|---|---|---|---|---|
| 739 S Jay St | 0.00mi | 3/1.5 (-1) | 1,708 (-3%) | 0mo | $67,000 | $39 | 89 |
| 700 S Locke St | 0.13mi | 3/2.0 (-1) | 1,680 (-5%) | 3mo | $87,000 | $52 | 76 |
| 910 S Apperson Way | 0.19mi | 4/2.0 | 1,700 (-4%) | 9mo | $129,900 | $76 | 75 |
| 822 E King St | 0.12mi | 3/2.0 (-1) | 1,728 (-2%) | 11mo | $177,900 | $103 | 74 |
| 807 S Bell St | 0.14mi | 3/1.0 (-1) | 1,680 (-5%) | 9mo | $77,000 | $46 | 70 |
| 225 E Vaile Ave | 0.32mi | 3/2.0 (-1) | 1,948 (+10%) | 1mo | $170,000 | $87 | 60 |
| 514 S Webster St | 0.70mi | 3/1.5 (-1) | 1,792 (+1%) | 2mo | $165,000 | $92 | 59 |
| 932 E Mulberry St | 0.70mi | 3/2.0 (-1) | 1,728 (-2%) | 1mo | $42,000 | $24 | 56 |
| 1036 S Webster St | 0.71mi | 3/2.0 (-1) | 1,760 (-0%) | 5mo | $175,000 | $99 | 55 |
| 804 E Sycamore St | 0.55mi | 3/1.5 (-1) | 1,516 (-14%) | 1mo | $203,000 | $134 | 45 |
| 429 S Armstong St | 0.68mi | 3/2.0 (-1) | 1,576 (-11%) | 8mo | $149,900 | $95 | 37 |
| 1329 S Buckeye | 0.72mi | 4/2.0 | 2,026 (+15%) | 6mo | $197,000 | $97 | 35 |
Match score weights: distance 35% · size 25% · config 20% · recency 20%. Top-matched comps best support the ARV.
Projected returns pro-forma
-3.0% appreciation · 0.0% rent growth · sell at horizon
- IRR
- 21.6%
- Equity multiple
- 1.85×
- Total profit
- $20,195
- Equity at exit
- $12,659
- IRR
- 27.7%
- Equity multiple
- 3.12×
- Total profit
- $50,321
- Equity at exit
- $7,341
Cash invested: $23,772 (down + closing). Projections, not guarantees.
Landlord ↔ Tenant lean methodology
- Overall (STATE)
- 90 Strongly Landlord-Friendly
- State Indiana
- 90 Strongly Landlord-Friendly · R+11
- County
- — inherits STATE
- City
- — inherits STATE
ZIP-level market 46901
- Home prices YoY
- -24.4%
- Rents YoY
- -1.5%
- Active inventory
- 242
- Price-to-rent
- 4.9×
Monthly cashflow live
- Estimated rent
- $1,454 medium interval (Pro) →
- Mortgage (P&I)
- −$445
- Tax from tax record
- −$68 /mo · $816/yr
- Insurance
- −$35
- HOA
- −$0
- Vacancy / Maint / Mgmt
- −$305
- Net cashflow
- $600
Break-even live
UW: 25.0% down · 7.5% · 30yr · 1.5% tax · 5.0% vac · 8.0% maint · 8.0% mgmt
Financing live
Cash to close
- Down payment
- $21,225
- Closing costs
- $2,547
- Reserves months
- —
- Total cash needed
- —
Loan-product check · same deal, 3 products live
Conventional
25% down · 7.5% · 30yr
- Down + closing
- —
- Monthly P&I
- —
- Monthly cashflow
- —
- DSCR
- —
- Eligible?
- —
Personal DTI + credit; lowest rate.
DSCR
20% down · 8.5% · 30yr
- Down + closing
- —
- Monthly P&I
- —
- Monthly cashflow
- —
- DSCR
- —
- Eligible?
- —
No personal income docs; deal must DSCR.
Hard money
10% down · 12.0% · 12mo
- Down + closing
- —
- Monthly P&I
- —
- Monthly cashflow
- —
- DSCR
- —
- Eligible?
- —
Short-term bridge; refi at stabilization.
Listing history 4 events
-
2026-05-08status Pending
-
2026-05-04price $84,900
-
2026-04-17$89,900 Active
-
2019-12-26soldstatus $30,000
ⓘ Source: listings_history table (triggers on properties + properties_extension) + one-shot
backfill from property_details.listing_events for pre-trigger history.
Tax reassessment forecast IN · Partial reset (capped growth)
- Current annual tax
- $816 · $68/mo
- Projected year-2 tax
- $816 · $68/mo
- Expected delta
- $0/yr ($0/mo · 0.0%)
ⓘ Screening estimate from a state-policy table — verify with the county assessor before closing.
Climate risk First Street
- Flood 1/10 Low FEMA zone X (unshaded) · 0% chance over 30 yrs
- Wildfire 1/10 Low
- Heat 3/10 Moderate 7 d/yr ≥102°F today · 17 d/yr by 30 yrs out
- Wind 2/10 Low
- Air quality 3/10 Moderate 2 unhealthy d/yr today · 3 by 30 yrs out
Nearby sold comps map
Loading sold comps map…
Walkable amenities ~0.75 mi
Loading nearby amenities…
Taxation est. · year 1
- Rental income
- $17,447
- − Mortgage interest
- −$4,756
- − Property taxes
- −$816
- − Insurance
- −$424
- − Repairs & maintenance
- −$1,396
- − Management
- −$1,396
- − Depreciation
- −$2,470
- Taxable income
- $6,190
- Est. tax owed @ 24.0%
- −$1,486
- After-tax cash flow
- $5,715/yr
For passive investors: Depreciation is non-cash, so a rental often shows a tax loss while cash-flowing — sheltering income. Rental losses are passive: they offset passive income freely, and up to $25,000/yr can offset ordinary (W-2) income if you actively participate and your MAGI is under $100k (phasing out to $0 by $150k); unused losses carry forward. On sale, claimed depreciation is recaptured at up to 25%, and gains may owe capital-gains tax (a 1031 exchange can defer both). Figures are a year-1 estimate at your 24.0% rate — not tax advice; consult a CPA.
Schools (NCES district)
- District
- Kokomo School Corporation
- NCES district ID
- 1805370
- Math proficiency
- 22% ▼ -8.00%
- Reading proficiency
- 30% ▼ -5.00%
- Median HH income
- $35,804
- Composite
- 21.5/100
- National rank
- #8325
- State rank
- #264 of 301 in IN
Livability — Kokomo
- Score
- 68/100
- State rank
- #227
- US rank
- #9912
Category grades
Schools grade is shown separately in the Schools card above.
Census & demographics
- Census place
- Kokomo, IN
- County
- Howard County · 75,099 people
- City population
- 75,099
- Metro
- Kokomo, IN
- Population (ZIP)
- 38,082
- Household income
- $60,495
- Rent vs Own
- Severe rent burden
- 1116.0
Population outlook (Howard County) Hauer SSP2
- Today (2025)
- 81,522 people
- By 2030
- 80,104 · -1.7%
- By 2040
- 76,708 · -5.9%
- By 2050
- 72,880 · -10.6%
- By 2075
- 64,016 · -21.5%
- By 2100
- 51,705 · -36.6%
Race, ethnicity, and origin ACS 2023
- Neighborhood character
- Predominantly White (83%)
- Race & ethnicity
- White 83% Black 9% Two or more races 5% Hispanic / Latino 4%
- Common ancestry
- Italian 2% Romanian 2% Slovak 1%
- Foreign-born
- 1% · Canada
- Languages at home
- 96% English-only · German/W. Germanic 1% Spanish 1%
Political lean MEDSL · Howard
- 2024 margin
- Solid R (+35.3) · D 31.4% · R 66.7% · Other 1.8%
- 2008→2024 swing
- -29.1pp toward R · 2008: -6.2pp · 2024: -35.3pp
- All cycles
- 2024: R+35.3 2020: R+32.4 2016: R+33.9 2012: R+14.3 2008: R+6.2
Not yet ingested
- Civics
- —
Market trends
- HPI YoY
- ▼ -78.40%
- Current HPI
- 242.2565
- Rent YoY
- ▼ -1.47%
- Metro
- Kokomo, IN
- State GDP YoY
- ▲ 2.90%
- F500 in state
- 18
Industry mix (Fortune 500 HQ in IN)
| Industry | F500 HQs | Revenue |
|---|---|---|
| Industrial Machinery | 2 | $37B |
|
||
| Healthcare | 1 | $177B |
|
||
| Pharmaceuticals | 1 | $45B |
|
||
| Metals / Steel | 1 | $18B |
|
||
| Agriculture | 1 | $17B |
|
||
| Packaging | 1 | $12B |
|
||
Price history
+183.0% since first listed4 events — show timeline
- 2026-05-08 Pending — IRMLS
- 2026-05-04 Price Changed $84,900 IRMLS
- 2026-04-17 Listed $89,900 IRMLS
- 2019-12-26 Sold (Public Records) $30,000 Public Records
Property tax history
+23.9%/yrLatest (2024): $816 · +11.6% YoY. Source: county tax records.
Cash-flow waterfall
monthlySold comps — $/sqft
last 12 mo · ≤1 miLoading sold comps…