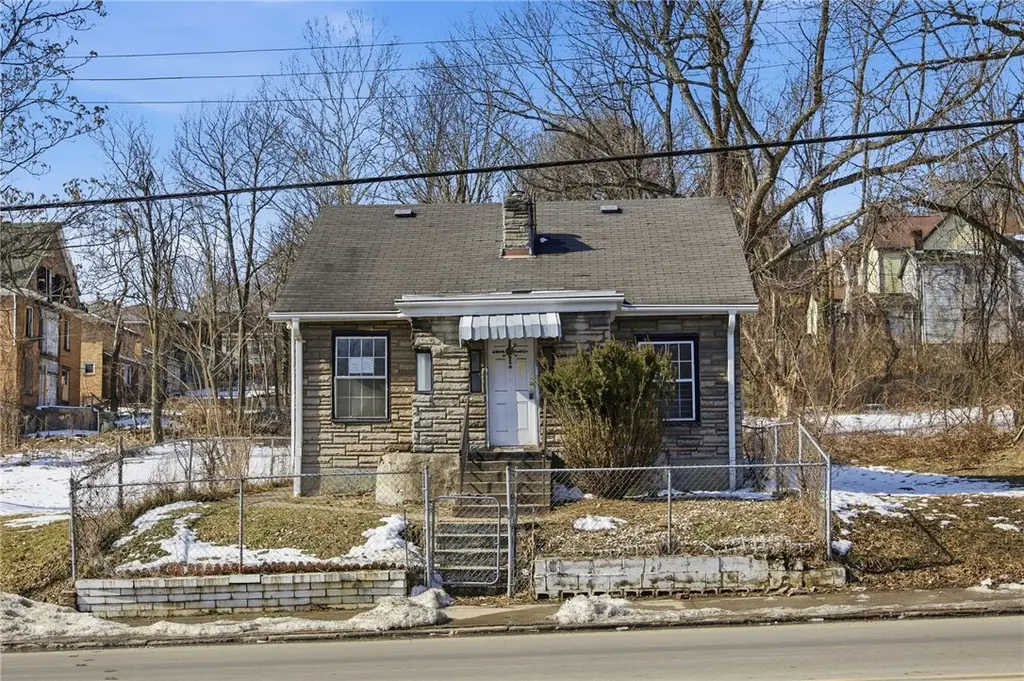
1209 Swissvale Ave · Wilkinsburg, PA
Flood risk 1/10 · Minimal
- FEMA flood zone
- X (unshaded)
- Chance of flooding over 30 yrs
- 0.0%
- Est. flood insurance / yr
- $473 – $860
Fire risk 1/10 · Minimal
- Est. fire insurance / yr
- $511 – $949
Heat risk 4/10 · Minor
- Hot days now (above 96°F)
- 7 days/yr
- Hot days in 30 yrs
- 18 days/yr
Wind risk 2/10 · Minimal
- Chance of severe wind over 30 yrs
- —
Air-quality risk 4/10 · Minor
- Unhealthy air days now
- 4 days/yr
- Unhealthy air days in 30 yrs
- 5 days/yr
Risk factors via First Street. Map © Google.
Why this score? — see what drove the D grade
The composite is a weighted blend of 9 inputs, each scored 0–100. Each bar is that input's sub-score; the figure is the points it added to the 100-point composite (weight × sub-score).
- Cash flow +15.0/30.0
- ARV discount +7.5/15.0
- 1% rule +5.0/10.0
- DSCR +5.0/10.0
- Livability +3.8/5.0
- Rent growth +3.5/5.0
- Condition / age +2.5/5.0
- Schools +1.5/10.0
- Appreciation +0.0/10.0
$29,500
🖨 Deal sheet 📄 Offer letter ✓ Due diligence
Listing remarks MLS
This home offers classic character with solid bones and great potential. Featuring a traditional layout with comfortable living spaces, this property is ideal for an owner-occupant looking to build equity or an investor seeking their next opportunity. The home needs minor TLC and cosmetic updates but provides a strong foundation to make it your own. Spacious yard offers room for outdoor enjoyment, gardening, or entertaining. Conveniently located near shopping, dining, major roadways, and public transportation. Whether you're looking to renovate and personalize or add to your portfolio, this Cape Cod presents a great value opportunity in an established neighborhood. Being sold as-is. Equal Housing Opportunity. Sale subject to appraisal. Lead-Based Paint notice required for properties built prior to 1978
Key facts
- Spacious yard
- Strong foundation
- Great potential
Tags
Neighborhood map
What this means for you Summary
Snapshot
- This is a 2-bed/2.0-bath single-family listed at $30k.
Deal economics
- At list price, monthly cash flow is $1k ($13k/yr) — positive.
- The deal already cash-flows at list — no discount required.
- Meets the 1% rule at list price ($2k rent vs $30k).
- Recommended offer: $27k (9.0% below list) — sets the bar for market timing.
- Cap rate 49.9% vs local median 11.3% in Wilkinsburg — top-decile yield for the area; either an underpriced asset or a hidden risk that comps aren't pricing in. Stress-test before assuming the spread holds.
Location & tenants
- Location reads 76/100 on livability (#411 in PA, #3,754 nationally) — a middle-class / working-renter tenant base. Strengths: commute A+, cost of living A+, housing A+; Watch: schools D+, health & safety D+, crime F.
- Wilkinsburg Borough SD (suburban): math 14% / reading 23% proficiency, ranked #503 of 539 in PA (top 93%) — low school quality limits family demand, transient renter base, plan for 1-2y turnover; 96% free/reduced lunch — lower-income household profile, screen leases tightly.
- Market conditions: Rents rising (+3.9%/yr); 118 active listings in the ZIP; 18 comparable units currently listed for rent nearby; rentals at typical pace (median 24d on market — plan ~3-4 weeks tenant-placement turnaround); 2,996 units permitted in Allegheny County in 2024 (1,588 in 5+ unit buildings).
- This rent runs 37% of the median local income ($55k/yr) — at the standard rent-burdened threshold; future hikes will face affordability resistance.
Forward outlook
- Local home prices are declining (-3.0%/yr); year-one equity from $204 of loan paydown is wiped out by about $885 of value loss. Plan a longer hold.
- At projected returns (-3.0% appreciation + 3.9% rent growth), your $8k cash investment doubles in ~1 year — after that, you're playing with house money.
Negotiation context
- It's been on market 108 days — a 9% lower offer ($27k) is reasonable based on typical stale-listing flexibility.
- Current owner paid $17k; list at $30k implies a 72% gain — meaningful room to come down on a strong offer.
Risks & watch-outs
- Watch-outs: property tax is 3.9% of price; built in 1942 — expect roof / HVAC / electrical / plumbing capex.
Questions for the listing agent
- It's been on market 108 days. Have you received any prior offers? Is the seller open to a 9% concession, seller financing, or rate buy-down credit?
- Built in 1942 — when were the roof, HVAC, electrical panel, plumbing, and water heater last replaced?
- Property tax is high relative to price — has the assessment been appealed recently, and will the sale trigger a re-assessment?
- Why hasn't it sold? Are there any deal-killer items the seller is aware of (foundation, flood, title, zoning, code violations)?
- Is there a deadline driving the sale (1031 exchange, divorce, estate, relocation)? That informs how much negotiation room exists.
- Schools are D-rated, which usually means shorter tenancies and higher turnover. Who's the typical renter profile here, and what's been the actual vacancy rate?
- Crime grade is F in this area — have there been break-ins, vandalism, or insurance claims at this property in the last 3 years? What carrier currently insures it and at what premium?
- The area grade is low — what's the realistic commute time and amenity access for the typical tenant pool here? Any planned neighborhood developments (good or bad) we should know about?
- What's the average days-on-market for RENTAL listings here right now (not sales)? A rising rental-DOM trend means longer vacancies and softer asking-rent achievability than the comps imply.
- What's the recent tenant-quality profile in this submarket — average credit score on applications, eviction rate, late-payment / NSF rate, and stable-employment percentage? A property-management company in the area should have these aggregated.
- How much new for-sale + rental construction is in the pipeline within 1–3 miles? Heavy new supply typically softens prices + rents 12–24 months out; constrained supply supports both.
Investment metrics
- 1% rule
- 5.73% ✓
- Cap rate
- 49.92%
- Cash-on-cash
- 155.82%
- DSCR
- 7.93
- GRM
- 1.5
CMA / ARV
- ARV (median comp)
- $59,526
- List price
- $29,500
- Delta
- -50.44%
- Verdict
- UNDERPRICED
- Comps
- 20 within 1.0 mi
Show comp detail 12 sales within ~0.75 mi
| Address | Dist | Beds/Ba | Sqft | Sold | Price | $/sf | Match |
|---|---|---|---|---|---|---|---|
| 1205 Glenn Ave | 0.14mi | 3/1.5 (+1) | 1,750 (+6%) | 14mo | $65,000 | $37 | 65 |
| 1117 James St | 0.27mi | 3/2.0 (+1) | 1,512 (-8%) | 6mo | $147,325 | $97 | 63 |
| 1334 Franklin Ave | 0.42mi | 3/2.0 (+1) | 1,736 (+5%) | 10mo | $120,000 | $69 | 58 |
| 25 Love Pl | 0.73mi | 3/2.5 (+1) | 1,638 (-1%) | 9mo | $337,000 | $206 | 50 |
| 1459 Foliage St | 0.37mi | 3/1.0 (+1) | 1,500 (-9%) | 12mo | $18,000 | $12 | 48 |
| 1446 Center St | 0.33mi | 3/1.0 (+1) | 1,478 (-10%) | 12mo | $65,000 | $44 | 48 |
| 612 Lamar Ave | 0.68mi | 3/1.5 (+1) | 1,566 (-5%) | 9mo | $364,900 | $233 | 45 |
| 615 Singer Pl | 0.67mi | 3/1.5 (+1) | 1,550 (-6%) | 10mo | $29,500 | $19 | 43 |
| 106 Hay St | 0.74mi | 3/2.0 (+1) | 1,764 (+7%) | 14mo | $319,000 | $181 | 37 |
| 16 Love Pl | 0.70mi | 3/2.5 (+1) | 1,883 (+14%) | 1mo | $366,000 | $194 | 36 |
| 1410 Traymore Ave | 0.61mi | 3/2.5 (+1) | 1,408 (-15%) | 10mo | $219,000 | $156 | 32 |
| 915 Ramsey St | 0.55mi | 3/1.0 (+1) | 1,480 (-10%) | 20mo | $120,000 | $81 | 31 |
Match score weights: distance 35% · size 25% · config 20% · recency 20%. Top-matched comps best support the ARV.
Projected returns pro-forma
-3.0% appreciation · 3.86% rent growth · sell at horizon
- IRR
- —
- Equity multiple
- 8.88×
- Total profit
- $65,067
- Equity at exit
- $4,399
- IRR
- —
- Equity multiple
- 19.28×
- Total profit
- $151,032
- Equity at exit
- $2,551
Cash invested: $8,260 (down + closing). Projections, not guarantees.
Landlord ↔ Tenant lean methodology
- Overall (STATE)
- 62 Landlord-Friendly
- State Pennsylvania
- 62 Landlord-Friendly · EVEN
- County
- — inherits STATE
- City
- — inherits STATE
ZIP-level market 15221
- Home prices YoY
- -32.3%
- Rents YoY
- 3.9%
- Active inventory
- 118
- Price-to-rent
- 1.5×
Monthly cashflow live
- Estimated rent
- $1,691 high interval (Pro) →
- Mortgage (P&I)
- −$155
- Tax from tax record
- −$96 /mo · $1,153/yr
- Insurance
- −$12
- HOA
- −$0
- Vacancy / Maint / Mgmt
- −$355
- Net cashflow
- $1,073
Break-even live
UW: 25.0% down · 7.5% · 30yr · 1.5% tax · 5.0% vac · 8.0% maint · 8.0% mgmt
Financing live
Cash to close
- Down payment
- $7,375
- Closing costs
- $885
- Reserves months
- —
- Total cash needed
- —
Loan-product check · same deal, 3 products live
Conventional
25% down · 7.5% · 30yr
- Down + closing
- —
- Monthly P&I
- —
- Monthly cashflow
- —
- DSCR
- —
- Eligible?
- —
Personal DTI + credit; lowest rate.
DSCR
20% down · 8.5% · 30yr
- Down + closing
- —
- Monthly P&I
- —
- Monthly cashflow
- —
- DSCR
- —
- Eligible?
- —
No personal income docs; deal must DSCR.
Hard money
10% down · 12.0% · 12mo
- Down + closing
- —
- Monthly P&I
- —
- Monthly cashflow
- —
- DSCR
- —
- Eligible?
- —
Short-term bridge; refi at stabilization.
Rent comps 18 comps
| Address | Beds | Baths | Sqft | Rent | $/sqft | DOM | Units | Dist |
|---|---|---|---|---|---|---|---|---|
| 1148 East St Pittsburgh, PA | 3.0 | 3.0 | 1738 | $1,700 | $0.98 | 43d | 1 | 0.21mi |
| 826 Walnut St Pittsburgh, PA | 2.0 | 1.0 | 1270 | $1,195 | $0.94 | 43d | 1 | 0.57mi |
| 600 Kelly Ave Pittsburgh, PA | 1.0–2.0 | 1.0 | 968 | $1,350 | $1.39 | 3d | 3 | 0.61mi |
| 7534 Penn Bridge Ct Pittsburgh, PA | 2.0 | 2.0 | 1259 | $1,750 | $1.39 | 43d | 1 | 0.74mi |
| 7215 Beacon Hill Dr Pittsburgh, PA | 2.0 | 2.0 | 1259 | $1,795 | $1.43 | 4d | 1 | 0.75mi |
| 442 Locust St Pittsburgh, PA | 2.0 | 1.0 | 1600 | $2,600 | $1.62 | 2d | 1 | 0.80mi |
| 519-521 S Trenton Ave Pittsburgh, PA | 3.0 | 1.5 | 1360 | $2,600 | $1.91 | 16d | 1 | 0.81mi |
| 1962 McNary Blvd Pittsburgh, PA | 3.0 | 1.0 | 1517 | $1,545 | $1.02 | 7d | 1 | 0.83mi |
| 100 Bryn Mawr Ct W Pittsburgh, PA | 1.0–2.0 | 1.0–2.0 | 975 | $1,904 | $1.95 | 2d | 15 | 0.84mi |
| 407 Biddle Ave #3 Pittsburgh, PA | 3.0 | 1.0 | 1200 | $1,700 | $1.42 | 43d | 1 | 0.85mi |
| 2031 Chalfant St Pittsburgh, PA | 3.0 | 1.5 | 1150 | $1,950 | $1.70 | 43d | 1 | 0.93mi |
| 1250 Blackadore Ave Pittsburgh, PA | 3.0 | 1.0 | 1440 | $1,750 | $1.22 | 23d | 1 | 1.28mi |
| 2210 Hampton St Pittsburgh, PA | 3.0 | 1.5 | 1512 | $1,650 | $1.09 | 23d | 1 | 1.28mi |
| 8918 Frankstown Rd Pittsburgh, PA | 3.0 | 1.0 | 1400 | $1,907 | $1.36 | 14d | 1 | 1.30mi |
| 1027 Lancaster Ave Unit 2 Pittsburgh, PA | 2.0 | 2.0 | 1300 | $2,599 | $2.00 | 1d | 1 | 1.35mi |
| 8612 Oakcrest Rd Pittsburgh, PA | 2.0 | 1.0 | 1218 | $1,450 | $1.19 | 23d | 1 | 1.44mi |
| 2323 Patterson Ave Pittsburgh, PA | 3.0 | 1.0 | 1440 | $1,800 | $1.25 | 43d | 1 | 1.44mi |
| 2323 Patterson Ave Unit NA Pittsburgh, PA | 3.0 | 1.0 | 1440 | $1,500 | $1.04 | 23d | 1 | 1.44mi |
Listing history 16 events
-
2026-06-18days on market $29,500 Active 108 DOM
-
2026-06-17days on market $29,500 Active 107 DOM
-
2026-06-16days on market $29,500 Active 106 DOM
-
2026-06-15days on market $29,500 Active 105 DOM
-
2026-06-13pricedays on market $29,500 Active 103 DOM
-
2026-06-09days on market $35,000 Active 99 DOM
-
2026-06-08days on market $35,000 Active 98 DOM
-
2026-06-07days on market $35,000 Active 97 DOM
-
2026-06-05days on market $35,000 Active 94 DOM
-
2026-06-03days on market $35,000 Active 93 DOM
-
2026-06-02days on market $35,000 Active 92 DOM
-
2026-06-01days on market $35,000 Active 91 DOM
-
2026-05-31days on market $35,000 Active 90 DOM
-
2026-04-29price $58,500 816-char remark
Show marketing remark (816 chars)
This home offers classic character with solid bones and great potential. Featuring a traditional layout with comfortable living spaces, this property is ideal for an owner-occupant looking to build equity or an investor seeking their next opportunity. The home needs minor TLC and cosmetic updates but provides a strong foundation to make it your own. Spacious yard offers room for outdoor enjoyment, gardening, or entertaining. Conveniently located near shopping, dining, major roadways, and public transportation. Whether you're looking to renovate and personalize or add to your portfolio, this Cape Cod presents a great value opportunity in an established neighborhood. Being sold as-is. Equal Housing Opportunity. Sale subject to appraisal. Lead-Based Paint notice required for properties built prior to 1978
-
2026-03-02$65,000 Active 816-char remark
Show marketing remark (816 chars)
This home offers classic character with solid bones and great potential. Featuring a traditional layout with comfortable living spaces, this property is ideal for an owner-occupant looking to build equity or an investor seeking their next opportunity. The home needs minor TLC and cosmetic updates but provides a strong foundation to make it your own. Spacious yard offers room for outdoor enjoyment, gardening, or entertaining. Conveniently located near shopping, dining, major roadways, and public transportation. Whether you're looking to renovate and personalize or add to your portfolio, this Cape Cod presents a great value opportunity in an established neighborhood. Being sold as-is. Equal Housing Opportunity. Sale subject to appraisal. Lead-Based Paint notice required for properties built prior to 1978
-
1986-07-18soldstatus $17,200
ⓘ Source: listings_history table (triggers on properties + properties_extension) + one-shot
backfill from property_details.listing_events for pre-trigger history.
Tax reassessment forecast PA · Partial reset (capped growth)
- Current annual tax
- $1,153 · $96/mo
- Projected year-2 tax
- $1,153 · $96/mo
- Expected delta
- $0/yr ($0/mo · 0.0%)
ⓘ Screening estimate from a state-policy table — verify with the county assessor before closing.
Climate risk First Street
- Flood 1/10 Low FEMA zone X (unshaded) · 0% chance over 30 yrs
- Wildfire 1/10 Low
- Heat 4/10 Moderate 7 d/yr ≥96°F today · 18 d/yr by 30 yrs out
- Wind 2/10 Low
- Air quality 4/10 Moderate 4 unhealthy d/yr today · 5 by 30 yrs out
Nearby sold comps map
Loading sold comps map…
Walkable amenities ~0.75 mi
Loading nearby amenities…
Taxation est. · year 1
- Rental income
- $20,288
- − Mortgage interest
- −$1,652
- − Property taxes
- −$1,153
- − Insurance
- −$148
- − Repairs & maintenance
- −$1,623
- − Management
- −$1,623
- − Depreciation
- −$858
- Taxable income
- $13,231
- Est. tax owed @ 24.0%
- −$3,175
- After-tax cash flow
- $9,695/yr
For passive investors: Depreciation is non-cash, so a rental often shows a tax loss while cash-flowing — sheltering income. Rental losses are passive: they offset passive income freely, and up to $25,000/yr can offset ordinary (W-2) income if you actively participate and your MAGI is under $100k (phasing out to $0 by $150k); unused losses carry forward. On sale, claimed depreciation is recaptured at up to 25%, and gains may owe capital-gains tax (a 1031 exchange can defer both). Figures are a year-1 estimate at your 24.0% rate — not tax advice; consult a CPA.
Schools (NCES district)
- District
- Wilkinsburg Borough SD
- NCES district ID
- 4226370
- Math proficiency
- 14% ▼ -8.00%
- Reading proficiency
- 23% ▼ -9.00%
- Median HH income
- $32,204
- Composite
- 14.94/100
- National rank
- #9368
- State rank
- #503 of 539 in PA
Livability — Wilkinsburg
- Score
- 76/100
- State rank
- #411
- US rank
- #3754
Category grades
Schools grade is shown separately in the Schools card above.
Census & demographics
- Census place
- Wilkinsburg, PA
- County
- Allegheny County · 1,022,028 people
- City population
- 29,513
- Metro
- Pittsburgh, PA
- Population (ZIP)
- 29,374
- Household income
- $55,028
- Rent vs Own
- Severe rent burden
- 1933.0
Population outlook (Allegheny County) Hauer SSP2
- Today (2025)
- 1,250,282 people
- By 2030
- 1,256,482 · +0.5%
- By 2040
- 1,256,318 · +0.5%
- By 2050
- 1,244,169 · -0.5%
- By 2075
- 1,197,693 · -4.2%
- By 2100
- 1,093,187 · -12.6%
Race, ethnicity, and origin ACS 2023
- Neighborhood character
- Diverse neighborhood (Simpson 0.60)
- Race & ethnicity
- White 47% Black 43% Two or more races 7% Hispanic / Latino 4% Asian 1%
- Common ancestry
- Romanian 4% Lithuanian 2% Serbian 1%
- Foreign-born
- 4% · Canada, South Korea, China
- Languages at home
- 93% English-only · Spanish 2% French/Haitian/Cajun 1% Other Indo-European 1%
Political lean MEDSL · Allegheny
- 2024 margin
- Strong D (+20.3) · D 59.7% · R 39.4%
- 2008→2024 swing
- +4.8pp toward D · 2008: 15.5pp · 2024: 20.3pp
- All cycles
- 2024: D+20.3 2020: D+20.4 2016: D+16.4 2012: D+14.4 2008: D+15.5
Not yet ingested
- Civics
- —
Market trends
- HPI YoY
- ▼ -109.77%
- Current HPI
- 230.0486
- Rent YoY
- ▲ 3.86%
- Metro
- Pittsburgh, PA
- State GDP YoY
- ▲ 1.68%
- F500 in state
- 34
Industry mix (Fortune 500 HQ in PA)
| Industry | F500 HQs | Revenue |
|---|---|---|
| Healthcare | 2 | $309B |
|
||
| Insurance | 2 | $27B |
|
||
| Telecommunications / Media | 1 | $124B |
|
||
| Industrial Distribution | 1 | $22B |
|
||
| Financial Services | 1 | $20B |
|
||
| Chemicals / Materials | 1 | $18B |
|
||
Price history
+240.1% since first listed3 events — show timeline
- 2026-04-29 Price Changed $58,500 West Penn MLS
- 2026-03-02 Listed $65,000 West Penn MLS
- 1986-07-18 Sold (Public Records) $17,200 Public Records
Property tax history
+6.8%/yrLatest (2026): $1,153 · +311.9% YoY. Source: county tax records.
Cash-flow waterfall
monthlySold comps — $/sqft
last 12 mo · ≤1 miLoading sold comps…