20095 Shadow Island Dr · Santa Clarita, CA
Flood risk 1/10 · Minimal
- FEMA flood zone
- X (unshaded)
- Chance of flooding over 30 yrs
- 0.0%
- Est. flood insurance / yr
- $507 – $1,088
Fire risk 8/10 · Major
- Est. fire insurance / yr
- $659 – $1,223
Heat risk 7/10 · Major
- Hot days now (above 99°F)
- 7 days/yr
- Hot days in 30 yrs
- 19 days/yr
Wind risk 1/10 · Minimal
- Chance of severe wind over 30 yrs
- —
Air-quality risk 6/10 · Moderate
- Unhealthy air days now
- 9 days/yr
- Unhealthy air days in 30 yrs
- 13 days/yr
Risk factors via First Street. Map © Google.
Why this score? — see what drove the C- grade
The composite is a weighted blend of 9 inputs, each scored 0–100. Each bar is that input's sub-score; the figure is the points it added to the 100-point composite (weight × sub-score).
- Cash flow +25.2/30.0
- DSCR +8.3/10.0
- 1% rule +6.6/10.0
- Schools +5.9/10.0
- Livability +3.5/5.0
- Rent growth +2.9/5.0
- Condition / age +2.5/5.0
- ARV discount +0.0/15.0
- Appreciation +0.0/10.0
$270,000
🖨 Deal sheet 📄 Offer letter ✓ Due diligence
Listing remarks
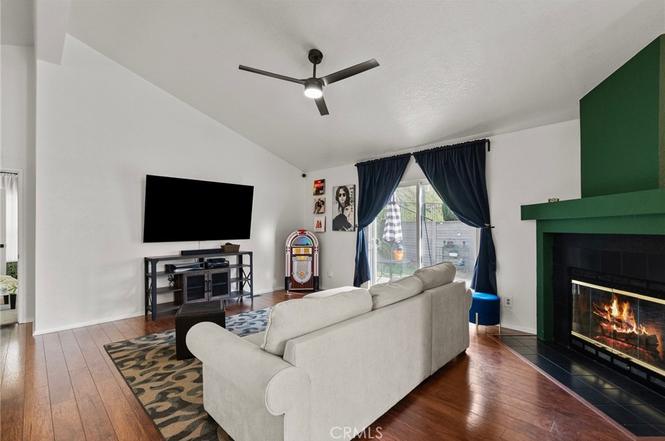
Manufactured home on permanent foundation with Land Lease. Buyer must obtain reapproval from park community before submitting offer. 2 Applications are required: 1 for Buyer(s), 1 for adults over 18 not on land lease or title. Welcome to this beautifully upgraded home located in the heart of Canyon Country. This spacious 2-bedroom, 2-bathroom residence offers an open and inviting floor plan, modern upgrades, and incredible mountain and valley views—making it the perfect retreat for families and entertainers alike. Step inside to discover a bright and airy living space, featuring high ceilings, recessed lighting, and elegant flooring throughout. The gourmet kitchen is a chef’s dr
Key facts
- Gourmet kitchen
- Cozy fireplace
- Granite countertops
Tags
Property features AI
Finance
- Other: Common interest: Planned development; No common walls (detached); Living area source: Assessor's data; Subdivision: Canyon View Estates (CYVE)
- Financial info: Land lease: $1,700.09 (land lease property)
- HOA & community: Part of an association (Canyon View Estates); Association amenities: pool, spa, clubhouse, tennis, playground, outdoor cooking area, onsite property management; Pets permitted (pet rules apply); Association has controlled access and guard; Community features: curbs, street lighting, sidewalks, park; Approximately 150 units in the community
Exterior
- Parking: Attached garage (front entry); 2 garage/parking spaces
- Security: Controlled access; Guarded community (guard)
- Utilities: Public/district water; Public sewer; Natural gas available; Electricity available; Cable available; Telephone available (in street)
- Home design: Manufactured house; One story; Located in a planned development
- Construction: Certified 433A foundation
- Exterior features: Patio; In-ground community spa; In-ground community pool; Storage building; Front yard; Back yard; Has view
Interior
- Kitchen: Quartz counters; Kitchen island; Eat-in kitchen
- Bedrooms: Primary bedroom (main floor); Main floor bedrooms: 2
- Flooring: Tile flooring; Wood flooring
- Bathrooms: 2 full bathrooms; Separate tub and walk-in shower in primary bath; Shower-in-tub option; Bathtub; Granite counters in bathrooms
- Heating & cooling: Central cooling; Central furnace heating
- Interior features: High ceilings (9+ feet); Ceiling fan(s); Recessed lighting; Sliding glass door(s); Mirrored closet doors; Double pane windows; Plantation shutters; Main-level floor plan (all bedrooms down)
- Laundry & utility: Indoor laundry room; Washer hookup; Gas dryer hookup; Individual laundry room
Neighborhood map
What this means for you Summary
Snapshot
- This is a 2-bed/2.0-bath manufactured listed at $270k.
Deal economics
- At list price, monthly cash flow is $606 ($7k/yr) — positive.
- The deal already cash-flows at list — no discount required.
- Meets the 1% rule at list price ($3k rent vs $270k).
- Recommended offer: $238k (12.0% below list) — sets the bar for market timing.
- Cap rate 9.0% vs local median 2.8% in Santa Clarita — top-decile yield for the area; either an underpriced asset or a hidden risk that comps aren't pricing in. Stress-test before assuming the spread holds.
Location & tenants
- Location reads 70/100 on livability (#229 in CA) — a middle-class / working-renter tenant base. Strengths: employment A+, housing A, crime A-; Watch: amenities D+, cost of living F, health & safety F.
- William S. Hart Union High (suburban): math 52% / reading 72% proficiency, ranked #155 of 1,400 in CA (top 11%) — acceptable for families but not a draw, mixed tenant base, ~2y average lease; only 18% free/reduced lunch — higher-income household profile.
- Market conditions: Rents rising (+1.7%/yr); 106 active listings in the ZIP; 21 comparable units currently listed for rent nearby; rentals leasing fast (median 1d on market — plan ~1-2 weeks tenant-placement turnaround); high-income renter base; 19,697 units permitted in Los Angeles County in 2024 (9,426 in 5+ unit buildings).
- This rent runs 33% of the median local income ($115k/yr) — at the standard rent-burdened threshold; future hikes will face affordability resistance.
Forward outlook
- Local home prices are declining (-3.0%/yr); year-one equity from $2k of loan paydown is wiped out by about $8k of value loss. Plan a longer hold.
- Los Angeles County population projected at +9% by 2050 — modest demand growth; plan on rents tracking national, not racing it.
Negotiation context
- It's been on market 164 days — a 12% lower offer ($238k) is reasonable based on typical stale-listing flexibility.
- 8 sale attempts since 20y ago with the ask held roughly flat each time — persistent listings suggest the price (not the market) is what's stuck; bring a comps-based counter.
Risks & watch-outs
- Climate carrying-cost: severe wildfire risk; extreme-heat days projected 7→19/yr by 2055 (HVAC capex compounding) — expect insurance premiums to compound above CPI over the hold.
Questions for the listing agent
- It's been on market 164 days. Have you received any prior offers? Is the seller open to a 12% concession, seller financing, or rate buy-down credit?
- Why hasn't it sold? Are there any deal-killer items the seller is aware of (foundation, flood, title, zoning, code violations)?
- Is there a deadline driving the sale (1031 exchange, divorce, estate, relocation)? That informs how much negotiation room exists.
- Schools are B-rated — typically a magnet for longer-tenancy family renters. What's the average tenant stay here, and is there a school-zone premium baked into asking?
- What's the average days-on-market for RENTAL listings here right now (not sales)? A rising rental-DOM trend means longer vacancies and softer asking-rent achievability than the comps imply.
- What's the recent tenant-quality profile in this submarket — average credit score on applications, eviction rate, late-payment / NSF rate, and stable-employment percentage? A property-management company in the area should have these aggregated.
- How much new for-sale + rental construction is in the pipeline within 1–3 miles? Heavy new supply typically softens prices + rents 12–24 months out; constrained supply supports both.
Investment metrics
- 1% rule
- 1.16% ✓
- Cap rate
- 8.98%
- Cash-on-cash
- 9.61%
- DSCR
- 1.43
- GRM
- 7.2
CMA / ARV
- ARV (on-the-fly)
- $209,760
- Comps found
- 12
Show comp detail 12 sales within ~0.75 mi
| Address | Dist | Beds/Ba | Sqft | Sold | Price | $/sf | Match |
|---|---|---|---|---|---|---|---|
| 20401 Soledad Canyon Rd #247 | 0.40mi | 2/2.0 | 1,248 (-5%) | 8mo | $155,000 | $124 | 67 |
| 20073 Edgewater Dr | 0.10mi | 3/2.0 (+1) | 1,482 (+13%) | 5mo | $322,000 | $217 | 64 |
| 20042 Canyon View Dr #74 | 0.14mi | 3/2.0 (+1) | 1,482 (+13%) | 4mo | $275,000 | $186 | 63 |
| 20401 Soledad Cyn #355 | 0.54mi | 3/2.0 (+1) | 1,248 (-5%) | 1mo | $224,000 | $179 | 61 |
| 20401 Soledad Canyon Rd #342 | 0.54mi | 3/2.0 (+1) | 1,344 (+2%) | 8mo | $210,000 | $156 | 59 |
| 20401 Soledad Cyn | 0.44mi | 3/2.0 (+1) | 1,440 (+10%) | 4mo | $230,000 | $160 | 54 |
| 20401 Soledad Canyon Rd #690 | 0.54mi | 3/2.0 (+1) | 1,344 (+2%) | 15mo | $240,400 | $179 | 53 |
| 20401 Soledad Canyon Rd #126 | 0.54mi | 3/2.0 (+1) | 1,224 (-7%) | 8mo | $130,000 | $106 | 52 |
| 20401 Soledad Canyon Rd Spc 543 | 0.54mi | 3/2.0 (+1) | 1,440 (+10%) | 4mo | $230,000 | $160 | 50 |
| 20401 Soledad Canyon Rd #114 | 0.54mi | 3/2.0 (+1) | 1,176 (-10%) | 4mo | $184,000 | $156 | 50 |
| 20401 Soledad Canyon Rd #451 | 0.54mi | 3/2.0 (+1) | 1,176 (-10%) | 7mo | $157,000 | $134 | 47 |
| 20401 Soledad Canyon Rd #203 | 0.54mi | 3/2.0 (+1) | 1,404 (+7%) | 19mo | $235,000 | $167 | 42 |
Match score weights: distance 35% · size 25% · config 20% · recency 20%. Top-matched comps best support the ARV.
Projected returns pro-forma
-3.0% appreciation · 1.7% rent growth · sell at horizon
- IRR
- -3.3%
- Equity multiple
- 0.88×
- Total profit
- $-9,175
- Equity at exit
- $40,258
- IRR
- 4.9%
- Equity multiple
- 1.34×
- Total profit
- $25,723
- Equity at exit
- $23,345
Cash invested: $75,600 (down + closing). Projections, not guarantees.
Landlord ↔ Tenant lean methodology
- Overall (STATE)
- 18 Strongly Tenant-Friendly
- State California
- 18 Strongly Tenant-Friendly · D+13
- County
- — inherits STATE
- City
- — inherits STATE
ZIP-level market 91351
- Rents YoY
- 1.7%
- Active inventory
- 106
- Price-to-rent
- 7.2×
Monthly cashflow live
- Estimated rent
- $3,126 high interval (Pro) →
- Mortgage (P&I)
- −$1,416
- Tax from tax record
- −$335 /mo · $4,026/yr
- Insurance
- −$112
- HOA
- −$0
- Vacancy / Maint / Mgmt
- −$656
- Net cashflow
- $606
Break-even live
UW: 25.0% down · 7.5% · 30yr · 1.5% tax · 5.0% vac · 8.0% maint · 8.0% mgmt
Financing live
Cash to close
- Down payment
- $67,500
- Closing costs
- $8,100
- Reserves months
- —
- Total cash needed
- —
Loan-product check · same deal, 3 products live
Conventional
25% down · 7.5% · 30yr
- Down + closing
- —
- Monthly P&I
- —
- Monthly cashflow
- —
- DSCR
- —
- Eligible?
- —
Personal DTI + credit; lowest rate.
DSCR
20% down · 8.5% · 30yr
- Down + closing
- —
- Monthly P&I
- —
- Monthly cashflow
- —
- DSCR
- —
- Eligible?
- —
No personal income docs; deal must DSCR.
Hard money
10% down · 12.0% · 12mo
- Down + closing
- —
- Monthly P&I
- —
- Monthly cashflow
- —
- DSCR
- —
- Eligible?
- —
Short-term bridge; refi at stabilization.
Rent comps 21 comps
| Address | Beds | Baths | Sqft | Rent | $/sqft | DOM | Units | Dist |
|---|---|---|---|---|---|---|---|---|
| 26956 Flo Ln #338 Canyon Country, CA | 2.0 | 2.0 | 1064 | $2,875 | $2.70 | 1d | 1 | 0.60mi |
| 26955 Rainbow Glen Dr Santa Clarita, CA | 3.0 | 2.0 | 1007 | $2,850 | $2.83 | 1d | 1 | 0.65mi |
| 26941 Rainbow Glen Dr #751 Canyon Country, CA | 2.0 | 2.0 | 907 | $2,900 | $3.20 | 1d | 1 | 0.65mi |
| 26921 Flo Ln Canyon Country, CA | 3.0 | 2.0 | 1107 | $2,950 | $2.66 | 1d | 1 | 0.67mi |
| 26901 Rainbow Glen Dr Santa Clarita, CA | 3.0 | 2.0 | 1001 | $2,950 | $2.95 | 1d | 1 | 0.71mi |
| 26842 Claudette St #204 Canyon Country, CA | 2.0 | 2.0 | 964 | $2,650 | $2.75 | 1d | 1 | 0.73mi |
| 20345 Rue Crevier Santa Clarita, CA | 2.0 | 2.0 | 907 | $2,700 | $2.98 | 1d | 1 | 0.74mi |
| 28131 Florence Ln Canyon Country, CA | 3.0 | 2.0 | 1515 | $4,300 | $2.84 | 1d | 1 | 0.77mi |
| 26741 Isabella Pkwy Canyon Country, CA | 1.0–2.0 | 1.0–2.0 | 850 | $2,989 | $3.52 | 1d | 3 | 0.85mi |
| 26844 Albion Way Unit 1 Santa Clarita, CA | 3.0 | 2.5 | 1817 | $3,995 | $2.20 | 12d | 1 | 0.97mi |
| 27301 Whites Canyon Rd Canyon Country, CA | 2.0 | 2.0 | 900 | $1,995 | $2.22 | 17d | 2 | 1.07mi |
| 19028 Drycliff St Unit C Canyon Country, CA | 3.0 | 1.5 | 982 | $3,600 | $3.67 | 2d | 1 | 1.14mi |
| 20000 Plum Canyon Rd Santa Clarita, CA | 1.0–3.0 | 1.0–3.0 | 1051 | $2,925 | $2.78 | 24d | 2 | 1.16mi |
| 20000 Plum Canyon Rd Santa Clarita, CA | 3.0 | 3.0 | 1370 | $3,700 | $2.70 | 1d | 1 | 1.16mi |
| 28427 Santa Rosa Ln Santa Clarita, CA | 2.0 | 2.0 | 1121 | $3,000 | $2.68 | 1d | 1 | 1.20mi |
| 19335 Laroda Ln Santa Clarita, CA | 2.0 | 2.0 | 1400 | $3,000 | $2.14 | 7d | 1 | 1.21mi |
| 28371 Mirabelle Ln Santa Clarita, CA | 3.0 | 2.5 | 1710 | $3,400 | $1.99 | 6d | 1 | 1.22mi |
| 28366 Casselman Ln Santa Clarita, CA | 3.0 | 2.5 | 1710 | $3,650 | $2.13 | 1d | 1 | 1.25mi |
| 28136 Bakerton Ave Canyon Country, CA | 3.0 | 2.0 | 1400 | $3,800 | $2.71 | 7d | 1 | 1.29mi |
| 19341 Opal Ln Santa Clarita, CA | 3.0 | 3.0 | 1850 | $3,850 | $2.08 | 18d | 1 | 1.30mi |
| 27077 Hidaway Ave Canyon Country, CA | 2.0 | 1.0 | 960 | $2,400 | $2.50 | 1d | 1 | 1.42mi |
Listing history 38 events
-
2026-06-18days on market $270,000 Active 164 DOM
-
2026-06-17days on market $270,000 Active 163 DOM
-
2026-06-16days on market $270,000 Active 162 DOM
-
2026-06-15days on market $270,000 Active 161 DOM
-
2026-06-13days on market $270,000 Active 159 DOM
-
2026-06-13days on market $270,000 Active 158 DOM
-
2026-06-09days on market $270,000 Active 155 DOM
-
2026-06-08days on market $270,000 Active 154 DOM
-
2026-06-07days on market $270,000 Active 153 DOM
-
2026-06-04days on market $270,000 Active 150 DOM
-
2026-06-03days on market $270,000 Active 149 DOM
-
2026-06-02days on market $270,000 Active 148 DOM
-
2026-06-01days on market $270,000 Active 147 DOM
-
2026-05-31days on market $270,000 Active 146 DOM
-
2026-01-05$270,000 Active
-
2026-01-05historical
-
2025-12-03price $270,000
-
2025-09-04$274,000 Active
-
2025-09-04historical
-
2025-08-26historical
-
2025-07-08price $275,000
-
2025-06-04status Active
-
2025-05-14status Pending Sale
-
2025-03-18price $285,000
-
2025-02-14$279,900 Active
-
2023-12-29soldstatus $270,000 Closed Sale
-
2023-12-22status Pending Sale
-
2023-11-21historical Active Under Contract
-
2023-10-30status Active
-
2023-10-20historical Active Under Contract
-
2023-09-12price $265,000
-
2023-08-18price $275,000
-
2023-07-21status Active
-
2023-07-11historical
-
2023-06-17price $285,000
-
2023-05-19$299,000 Active
-
2006-03-22soldstatus $200,000
-
2006-03-01$205,000
ⓘ Source: listings_history table (triggers on properties + properties_extension) + one-shot
backfill from property_details.listing_events for pre-trigger history.
Tax reassessment forecast CA · Resets to sale price
- Current annual tax
- $4,026 · $335/mo
- Projected year-2 tax
- $4,026 · $335/mo
- Expected delta
- $0/yr ($0/mo · 0.0%)
ⓘ Screening estimate from a state-policy table — verify with the county assessor before closing.
Climate risk First Street
- Flood 1/10 Low FEMA zone X (unshaded) · 0% chance over 30 yrs
- Wildfire 8/10 Severe
- Heat 7/10 Severe 7 d/yr ≥99°F today · 19 d/yr by 30 yrs out
- Wind 1/10 Low
- Air quality 6/10 Major 9 unhealthy d/yr today · 13 by 30 yrs out
Nearby sold comps map
Loading sold comps map…
Walkable amenities ~0.75 mi
Loading nearby amenities…
Taxation est. · year 1
- Rental income
- $37,511
- − Mortgage interest
- −$15,124
- − Property taxes
- −$4,026
- − Insurance
- −$1,350
- − Repairs & maintenance
- −$3,001
- − Management
- −$3,001
- − Depreciation
- −$7,855
- Taxable income
- $3,154
- Est. tax owed @ 24.0%
- −$757
- After-tax cash flow
- $6,510/yr
For passive investors: Depreciation is non-cash, so a rental often shows a tax loss while cash-flowing — sheltering income. Rental losses are passive: they offset passive income freely, and up to $25,000/yr can offset ordinary (W-2) income if you actively participate and your MAGI is under $100k (phasing out to $0 by $150k); unused losses carry forward. On sale, claimed depreciation is recaptured at up to 25%, and gains may owe capital-gains tax (a 1031 exchange can defer both). Figures are a year-1 estimate at your 24.0% rate — not tax advice; consult a CPA.
Schools (NCES district)
- District
- William S. Hart Union High
- NCES district ID
- 0642510
- Math proficiency
- 52% ▬ 0.00%
- Reading proficiency
- 72% ▲ 1.00%
- Median HH income
- $95,844
- Composite
- 58.6/100
- National rank
- #2030
- State rank
- #155 of 1400 in CA
Livability — Santa Clarita
- Score
- 70/100
- State rank
- #229
- US rank
- #7378
Category grades
Schools grade is shown separately in the Schools card above.
Census & demographics
- Census place
- Santa Clarita, CA
- County
- Los Angeles County · 9,444,647 people
- City population
- 219,066
- Metro
- Los Angeles-Long Beach-Anaheim, CA
- Population (ZIP)
- 33,155
- Household income
- $115,364
- Rent vs Own
- Severe rent burden
- 784.0
Population outlook (Los Angeles County) Hauer SSP2
- Today (2025)
- 10,940,515 people
- By 2030
- 11,256,481 · +2.9%
- By 2040
- 11,729,929 · +7.2%
- By 2050
- 11,948,407 · +9.2%
- By 2075
- 11,818,114 · +8.0%
- By 2100
- 10,842,928 · -0.9%
Race, ethnicity, and origin ACS 2023
- Neighborhood character
- Diverse neighborhood (Simpson 0.64)
- Race & ethnicity
- Hispanic / Latino 49% White 34% Two or more races 21% Asian 6% Black 4% Native American 1%
- Hispanic origin (detail)
- Mexican 36%
- Common ancestry
- Romanian 1% Lithuanian 1% Scotch-Irish 1%
- Foreign-born
- 23% · Canada, Jamaica, South Korea
- Languages at home
- 54% English-only · Spanish 35% Other Indo-European 3% Tagalog/Filipino 2%
Political lean MEDSL · Los Angeles
- 2024 margin
- Solid D (+32.9) · D 64.8% · R 31.9% · Other 3.3%
- 2008→2024 swing
- -7.4pp toward R · 2008: 40.4pp · 2024: 32.9pp
- All cycles
- 2024: D+32.9 2020: D+44.2 2016: D+48.0 2012: D+40.0 2008: D+40.4
Not yet ingested
- Civics
- —
Market trends
- HPI YoY
- ▼ -703.16%
- Current HPI
- 360.9901
- Rent YoY
- ▲ 1.70%
- Metro
- Los Angeles-Long Beach-Anaheim, CA
- State GDP YoY
- ▲ 3.21%
- F500 in state
- 116
Industry mix (Fortune 500 HQ in CA)
| Industry | F500 HQs | Revenue |
|---|---|---|
| Technology | 27 | $1,492B |
|
||
| Financial Services | 3 | $174B |
|
||
| Retail | 3 | $44B |
|
||
| Insurance | 3 | $26B |
|
||
| Media / Entertainment | 2 | $115B |
|
||
| Pharmaceuticals / Biotech | 2 | $62B |
|
||
Price history
+31.7% since first listed24 events — show timeline
- 2026-01-05 Listing Removed — CRMLS
- 2026-01-05 Listed $270,000 CRMLS
- 2025-12-03 Price Changed $270,000 CRMLS
- 2025-09-04 Listed $274,000 CRMLS
- 2025-09-04 Coming Soon — CRMLS
- 2025-08-26 Listing Removed — CRMLS
- 2025-07-08 Price Changed $275,000 CRMLS
- 2025-06-04 Relisted — CRMLS
- 2025-05-14 Pending — CRMLS
- 2025-03-18 Price Changed $285,000 CRMLS
- 2025-02-14 Listed $279,900 CRMLS
- 2023-12-29 Sold (MLS) $270,000 CRMLS
- 2023-12-22 Pending — CRMLS
- 2023-11-21 Contingent — CRMLS
- 2023-10-30 Relisted — CRMLS
- 2023-10-20 Contingent — CRMLS
- 2023-09-12 Price Changed $265,000 CRMLS
- 2023-08-18 Price Changed $275,000 CRMLS
- 2023-07-21 Relisted — CRMLS
- 2023-07-11 Listing Removed — CRMLS
- 2023-06-17 Price Changed $285,000 CRMLS
- 2023-05-19 Listed $299,000 CRMLS
- 2006-03-22 Sold (MLS) $200,000 CRMLS
- 2006-03-01 Listed $205,000 CRMLS
Property tax history
+4.6%/yrLatest (2025): $4,026 · +4.6% YoY. Source: county tax records.
Cash-flow waterfall
monthlySold comps — $/sqft
last 12 mo · ≤1 miLoading sold comps…