 🏗️ New Construction
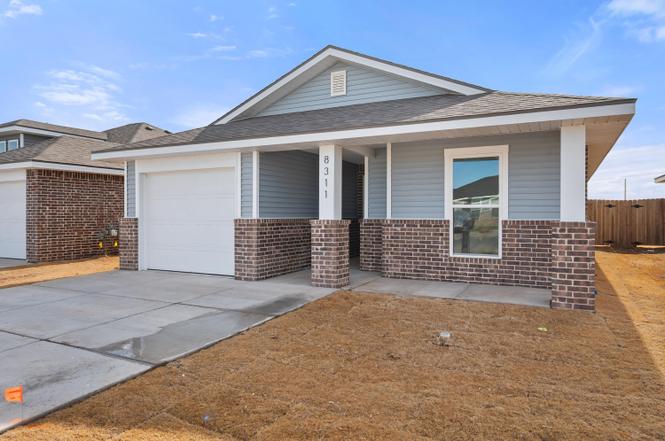
8311 24th St · Lubbock, TX
Flood risk No data
- FEMA flood zone
- —
- Chance of flooding over 30 yrs
- —
- Est. flood insurance / yr
- —
Fire risk No data
- Est. fire insurance / yr
- —
Heat risk No data
- Hot days now (above threshold)
- —
- Hot days in 30 yrs
- —
Wind risk No data
- Chance of severe wind over 30 yrs
- —
Air-quality risk No data
- Unhealthy air days now
- —
- Unhealthy air days in 30 yrs
- —
Risk factors via First Street. Map © Google.
Why this score? — see what drove the C- grade
The composite is a weighted blend of 9 inputs, each scored 0–100. Each bar is that input's sub-score; the figure is the points it added to the 100-point composite (weight × sub-score).
- Cash flow +20.7/30.0
- ARV discount +7.5/15.0
- DSCR +6.6/10.0
- Schools +4.4/10.0
- 1% rule +4.3/10.0
- Livability +4.0/5.0
- Rent growth +2.5/5.0
- Condition / age +2.5/5.0
- Appreciation +0.0/10.0
$174,000
🖨 Deal sheet 📄 Offer letter ✓ Due diligence
Listing remarks
Buy NOW and get $7K use-it-your-way cash!! Our cottage-style floor plans offer the most efficient and affordable use of space, making them the perfect choice for first-time home buyers! The Priscilla floor plan features has a beautiful brick and vinyl exterior with covered front entryway. Luxury vinyl plank flooring in the homes common areas. Noble white granite countertops, with a kitchen island with bar seating. Stainless steel appliances, and premium plumbing and lighting fixtures. Lastly, it has it's on secluded master suite with walk-in closet.
Key facts
- Walk-in closet
- 3,400 sq ft lot
- Garage
Tags
Property features AI
Exterior
- Parking: Attached garage (1 car); Concrete driveway
- Utilities: Public water; Public sewer; Electricity available; Natural gas available
- Home design: Residential single-family home; New construction
- Construction: Brick and vinyl siding; Composition roof; Slab foundation; Built as new construction
- Exterior features: Awning(s); Private yard; Front and back yard landscaped; Sprinklers in front and rear; Paved areas
Interior
- Kitchen: Disposal; Dishwasher; Electric range; Free-standing electric range; Microwave; Exhaust fan
- Bedrooms: Total rooms: 4
- Flooring: Carpet; Vinyl
- Bathrooms: 2 full bathrooms
- Heating & cooling: Central heating (natural gas); Central air; Ceiling fans; Attic fan; Electric cooling
- Interior features: Ceiling fans; Granite counters; Kitchen island; Open floorplan; Pantry; Storage; Walk-in closets
- Laundry & utility: Washer hookup; Electric dryer hookup; Dedicated laundry room; Gas water heater
Neighborhood map
What this means for you Summary
Snapshot
- This is a 2-bed/2.0-bath other listed at $174k.
Deal economics
- At list price, monthly cash flow is $236 ($3k/yr) — positive.
- The deal already cash-flows at list — no discount required.
- To meet the 1% rule (rent ≥ 1% of price), the offer needs to be $162k (7.1% below list).
- Recommended offer: $162k (7.1% below list) — sets the bar for 1% rule.
Location & tenants
- Location reads 80/100 on livability (#37 in TX, #1,749 nationally) — a professional / high-income tenant draw. Strengths: commute A+, cost of living A+, housing A+; Watch: employment C-, crime F.
- Frenship ISD (urban): math 47% / reading 54% proficiency, ranked #162 of 826 in TX (top 20%) — acceptable for families but not a draw, mixed tenant base, ~2y average lease.
- Zoned schools: Willow Bend El (math 34% / reading 41%, grade F, #1,744 of 4,322 statewide, top 41%, 730 students, 74% FRL); Frenship H S (math 44% / reading 65%, grade C-, #379 of 1,632 statewide, top 26%, 3,247 students, 46% FRL) — zoned schools average 60% FRL vs 36% district-wide (23 pts higher); higher-poverty schools than district average — tighter screening recommended.
- Market conditions: Rents soft (-0.1%/yr); 610 active listings in the ZIP; 37 comparable units currently listed for rent nearby; rentals at typical pace (median 21d on market — plan ~3-4 weeks tenant-placement turnaround); 41% of comp listings sitting > 30 days — soft ceiling on asking rent; 2,219 units permitted in Lubbock County in 2024 (252 in 5+ unit buildings).
- This rent runs 32% of the median local income ($62k/yr) — at the standard rent-burdened threshold; future hikes will face affordability resistance.
Forward outlook
- Local home prices are declining (-3.0%/yr); year-one equity from $1k of loan paydown is wiped out by about $5k of value loss. Plan a longer hold.
- Lubbock County population projected at +39% by 2050 — long-run rental-demand tailwind backs the buy-and-hold thesis.
Negotiation context
- It's been on market 76 days — a 6% lower offer ($164k) is reasonable based on typical stale-listing flexibility.
- 4 sale attempts with the ask held roughly flat each time — persistent listings suggest the price (not the market) is what's stuck; bring a comps-based counter.
Questions for the listing agent
- It's been on market 76 days. Have you received any prior offers? Is the seller open to a 7% concession, seller financing, or rate buy-down credit?
- Why hasn't it sold? Are there any deal-killer items the seller is aware of (foundation, flood, title, zoning, code violations)?
- Is there a deadline driving the sale (1031 exchange, divorce, estate, relocation)? That informs how much negotiation room exists.
- Schools are D-rated, which usually means shorter tenancies and higher turnover. Who's the typical renter profile here, and what's been the actual vacancy rate?
- Crime grade is F in this area — have there been break-ins, vandalism, or insurance claims at this property in the last 3 years? What carrier currently insures it and at what premium?
- What's the average days-on-market for RENTAL listings here right now (not sales)? A rising rental-DOM trend means longer vacancies and softer asking-rent achievability than the comps imply.
- What's the recent tenant-quality profile in this submarket — average credit score on applications, eviction rate, late-payment / NSF rate, and stable-employment percentage? A property-management company in the area should have these aggregated.
- How much new for-sale + rental construction is in the pipeline within 1–3 miles? Heavy new supply typically softens prices + rents 12–24 months out; constrained supply supports both.
Investment metrics
- 1% rule
- 0.93% ✗
- Cap rate
- 7.92%
- Cash-on-cash
- 5.81%
- DSCR
- 1.26
- GRM
- 9.0
CMA / ARV
No comps found within radius.
Projected returns pro-forma
-3.0% appreciation · 0.0% rent growth · sell at horizon
- IRR
- -10.4%
- Equity multiple
- 0.63×
- Total profit
- $-17,992
- Equity at exit
- $25,944
- IRR
- -5.4%
- Equity multiple
- 0.69×
- Total profit
- $-14,943
- Equity at exit
- $15,044
Cash invested: $48,720 (down + closing). Projections, not guarantees.
Landlord ↔ Tenant lean methodology
- Overall (STATE)
- 87 Strongly Landlord-Friendly
- State Texas
- 87 Strongly Landlord-Friendly · R+5
- County
- — inherits STATE
- City
- — inherits STATE
ZIP-level market 79407
- Home prices YoY
- -16.3%
- Rents YoY
- -0.1%
- Active inventory
- 610
- Price-to-rent
- 9.0×
Monthly cashflow live
- Estimated rent
- $1,616 high interval (Pro) →
- Mortgage (P&I)
- −$912
- Tax from tax record
- −$56 /mo · $675/yr
- Insurance
- −$72
- HOA
- −$0
- Vacancy / Maint / Mgmt
- −$339
- Net cashflow
- $236
Break-even live
UW: 25.0% down · 7.5% · 30yr · 1.5% tax · 5.0% vac · 8.0% maint · 8.0% mgmt
Financing live
Cash to close
- Down payment
- $43,500
- Closing costs
- $5,220
- Reserves months
- —
- Total cash needed
- —
Loan-product check · same deal, 3 products live
Conventional
25% down · 7.5% · 30yr
- Down + closing
- —
- Monthly P&I
- —
- Monthly cashflow
- —
- DSCR
- —
- Eligible?
- —
Personal DTI + credit; lowest rate.
DSCR
20% down · 8.5% · 30yr
- Down + closing
- —
- Monthly P&I
- —
- Monthly cashflow
- —
- DSCR
- —
- Eligible?
- —
No personal income docs; deal must DSCR.
Hard money
10% down · 12.0% · 12mo
- Down + closing
- —
- Monthly P&I
- —
- Monthly cashflow
- —
- DSCR
- —
- Eligible?
- —
Short-term bridge; refi at stabilization.
Rent comps 37 comps
| Address | Beds | Baths | Sqft | Rent | $/sqft | DOM | Units | Dist |
|---|---|---|---|---|---|---|---|---|
| 2603 Harmony Ave Lubbock, TX | 3.0 | 2.0 | 1450 | $1,749 | $1.21 | 13d | 1 | 0.28mi |
| 2603 Harmony Ave Lubbock, TX | 3.0 | 2.0 | 1450 | $1,749 | $1.21 | 21d | 1 | 0.28mi |
| 8607 29th St Lubbock, TX | 3.0 | 2.0 | 1350 | $1,749 | $1.30 | 43d | 1 | 0.30mi |
| 2511 Kenwood Ave Lubbock, TX | 3.0 | 2.0 | 1450 | $2,099 | $1.45 | 21d | 1 | 0.67mi |
| 2509 Kenwood Ave Lubbock, TX | 3.0 | 2.0 | 1450 | $1,699 | $1.17 | 21d | 1 | 0.67mi |
| 2055 Kenwood Ave Lubbock, TX | 3.0 | 2.0 | 1450 | $1,649 | $1.14 | 13d | 1 | 0.68mi |
| 2154 Kokomo Ave Lubbock, TX | 3.0 | 2.0 | 1450 | $1,799 | $1.24 | 21d | 1 | 0.72mi |
| 2028 Kenwood Ave Lubbock, TX | 3.0 | 2.0 | 1450 | $1,650 | $1.14 | 13d | 1 | 0.74mi |
| 2168 Langford Ave Lubbock, TX | 3.0 | 2.0 | 1450 | $1,699 | $1.17 | 43d | 1 | 0.74mi |
| 2125 Kirksey Ave Lubbock, TX | 3.0 | 2.0 | 1450 | $1,650 | $1.14 | 13d | 1 | 0.75mi |
| 2162 Langford Ave Lubbock, TX | 3.0 | 2.0 | 1450 | $1,699 | $1.17 | 43d | 1 | 0.78mi |
| 2131 Kokomo Ave Unit A Lubbock, TX | 3.0 | 2.0 | 1360 | $1,500 | $1.10 | 21d | 1 | 0.79mi |
| 2147 Langford Ave Lubbock, TX | 3.0 | 2.0 | 1450 | $1,699 | $1.17 | 21d | 1 | 0.79mi |
| 2143 Langford Ave Lubbock, TX | 3.0 | 2.0 | 1450 | $1,750 | $1.21 | 43d | 1 | 0.81mi |
| 2152 Langford Ave Unit Labs Lubbock, TX | 3.0 | 2.0 | 1450 | $1,660 | $1.14 | 21d | 1 | 0.82mi |
| 2139 Langford Ave Lubbock, TX | 3.0 | 2.0 | 1450 | $1,899 | $1.31 | 21d | 1 | 0.83mi |
| 2137 Langford Ave Lubbock, TX | 3.0 | 2.0 | 1450 | $1,700 | $1.17 | 21d | 1 | 0.83mi |
| 2148 Langford Ave Lubbock, TX | 3.0 | 2.0 | 1450 | $1,699 | $1.17 | 43d | 1 | 0.84mi |
| 2123 Langford Ave Lubbock, TX | 3.0 | 2.0 | 1450 | $1,799 | $1.24 | 21d | 1 | 0.85mi |
| 2138 Langford Ave Lubbock, TX | 3.0 | 2.0 | 1450 | $1,699 | $1.17 | 43d | 1 | 0.87mi |
| 2132 Langford Ave Lubbock, TX | 3.0 | 2.0 | 1450 | $1,699 | $1.17 | 13d | 1 | 0.88mi |
| 2128 Langford Ave Lubbock, TX | 3.0 | 2.0 | 1450 | $1,699 | $1.17 | 13d | 1 | 0.88mi |
| 2101 Langford Ave Lubbock, TX | 3.0 | 2.0 | 1500 | $1,400 | $0.93 | 43d | 1 | 0.89mi |
| 2122 Langford Ave Lubbock, TX | 3.0 | 2.0 | 1450 | $1,699 | $1.17 | 13d | 1 | 0.89mi |
| 1919 Langford Ave Unit A Lubbock, TX | 3.0 | 2.0 | 1500 | $1,399 | $0.93 | 43d | 1 | 0.90mi |
| 1919 Langford Ave Lubbock, TX | 3.0 | 2.0 | 1500 | $1,350 | $0.90 | 43d | 1 | 0.90mi |
| 1918 Langford Ave Unit B Lubbock, TX | 3.0 | 2.0 | 1500 | $1,399 | $0.93 | 13d | 1 | 0.94mi |
| 1903 Langford Ave Unit A Lubbock, TX | 3.0 | 2.0 | 1500 | $1,575 | $1.05 | 43d | 1 | 0.94mi |
| 1903 Langford Ave Unit A Lubbock, TX | 3.0 | 2.0 | 1500 | $1,575 | $1.05 | 13d | 1 | 0.94mi |
| 1903 Langford Ave Unit B Lubbock, TX | 3.0 | 2.0 | 1500 | $1,300 | $0.87 | 43d | 1 | 0.94mi |
| 7535 32nd St Lubbock, TX | 3.0 | 2.0 | 1120 | $1,395 | $1.25 | 43d | 1 | 1.02mi |
| 7541 33rd St Lubbock, TX | 3.0 | 2.0 | 1296 | $1,500 | $1.16 | 21d | 1 | 1.02mi |
| 8704 10th St Lubbock, TX | 3.0 | 2.0 | 1423 | $1,450 | $1.02 | 43d | 1 | 1.18mi |
| 7420 35th St Lubbock, TX | 3.0 | 2.0 | 1247 | $1,500 | $1.20 | 43d | 1 | 1.40mi |
| 7413 35th St Lubbock, TX | 3.0 | 2.0 | 1247 | $1,475 | $1.18 | 21d | 1 | 1.44mi |
| 7324 26th St Lubbock, TX | 2.0 | 1.0 | 936 | $850 | $0.91 | 43d | 1 | 1.46mi |
| 2911 Urbana Pl Lubbock, TX | 3.0 | 2.0 | 1452 | $1,800 | $1.24 | 21d | 1 | 1.48mi |
Listing history 10 events
-
2026-04-29status Pending
-
2026-04-24status Active
-
2026-04-09status Pending
-
2026-03-11status Active
-
2026-03-11price $174,000
-
2026-02-14status Pending
-
2026-02-12status Active
-
2026-01-27status Pending
-
2026-01-24price $177,000
-
2025-12-18$179,000 Active
ⓘ Source: listings_history table (triggers on properties + properties_extension) + one-shot
backfill from property_details.listing_events for pre-trigger history.
Tax reassessment forecast TX · Resets to sale price
- Current annual tax
- $675 · $56/mo
- Projected year-2 tax
- $3,184 · $265/mo
- Expected delta
- +$2,509/yr (+$209/mo · 371.5%)
ⓘ Screening estimate from a state-policy table — verify with the county assessor before closing.
Nearby sold comps map
Loading sold comps map…
Walkable amenities ~0.75 mi
Loading nearby amenities…
Taxation est. · year 1
- Rental income
- $19,398
- − Mortgage interest
- −$9,747
- − Property taxes
- −$675
- − Insurance
- −$870
- − Repairs & maintenance
- −$1,552
- − Management
- −$1,552
- − Depreciation
- −$5,062
- Taxable loss
- −$60
- Est. tax savings @ 24.0%
- +$14
- After-tax cash flow
- $2,843/yr
For passive investors: Depreciation is non-cash, so a rental often shows a tax loss while cash-flowing — sheltering income. Rental losses are passive: they offset passive income freely, and up to $25,000/yr can offset ordinary (W-2) income if you actively participate and your MAGI is under $100k (phasing out to $0 by $150k); unused losses carry forward. On sale, claimed depreciation is recaptured at up to 25%, and gains may owe capital-gains tax (a 1031 exchange can defer both). Figures are a year-1 estimate at your 24.0% rate — not tax advice; consult a CPA.
Schools (NCES district)
- District
- Frenship ISD
- NCES district ID
- 4819830
- Math proficiency
- 47% ▼ -8.00%
- Reading proficiency
- 54% ▬ 0.00%
- Median HH income
- $54,376
- Composite
- 43.59/100
- National rank
- #2976
- State rank
- #162 of 826 in TX
Livability — Lubbock
- Score
- 80/100
- State rank
- #37
- US rank
- #1749
Category grades
Schools grade is shown separately in the Schools card above.
Census & demographics
- Census place
- Lubbock, TX
- County
- Lubbock County · 293,542 people
- City population
- 283,030
- Metro
- Lubbock, TX
- Population (ZIP)
- 24,000
- Household income
- $61,509
- Rent vs Own
- Severe rent burden
- 1914.0
Population outlook (Lubbock County) Hauer SSP2
- Today (2025)
- 345,960 people
- By 2030
- 371,449 · +7.4%
- By 2040
- 424,539 · +22.7%
- By 2050
- 481,150 · +39.1%
- By 2075
- 633,467 · +83.1%
- By 2100
- 746,853 · +115.9%
Race, ethnicity, and origin ACS 2023
- Neighborhood character
- Diverse neighborhood (Simpson 0.56)
- Race & ethnicity
- White 58% Hispanic / Latino 31% Two or more races 17% Black 4% Asian 3%
- Hispanic origin (detail)
- Mexican 27%
- Common ancestry
- Italian 2% Lithuanian 1% Slovak 1%
- Foreign-born
- 5% · Canada, South Korea, China
- Languages at home
- 83% English-only · Spanish 13% Other Asian/Pacific 1% Chinese 1%
Political lean MEDSL · Lubbock
- 2024 margin
- Solid R (+39.5) · D 29.7% · R 69.2% · Other 1.0%
- 2008→2024 swing
- -2.8pp toward R · 2008: -36.7pp · 2024: -39.5pp
- All cycles
- 2024: R+39.5 2020: R+32.2 2016: R+38.4 2012: R+40.9 2008: R+36.7
Not yet ingested
- Civics
- —
Market trends
- HPI YoY
- ▼ -44.87%
- Current HPI
- 229.9895
- Rent YoY
- ▼ -0.07%
- Metro
- Lubbock, TX
- State GDP YoY
- ▲ 3.95%
- F500 in state
- 110
Industry mix (Fortune 500 HQ in TX)
| Industry | F500 HQs | Revenue |
|---|---|---|
| Energy | 16 | $1,198B |
|
||
| Technology | 5 | $198B |
|
||
| Engineering / Construction | 4 | $72B |
|
||
| Energy Services | 3 | $60B |
|
||
| Utilities | 3 | $41B |
|
||
| Healthcare | 2 | $330B |
|
||
Price history
-2.8% since first listed10 events — show timeline
- 2026-04-29 Pending — LARMLS
- 2026-04-24 Relisted — LARMLS
- 2026-04-09 Pending — LARMLS
- 2026-03-11 Relisted — LARMLS
- 2026-03-11 Price Changed $174,000 LARMLS
- 2026-02-14 Pending — LARMLS
- 2026-02-12 Relisted — LARMLS
- 2026-01-27 Pending — LARMLS
- 2026-01-24 Price Changed $177,000 LARMLS
- 2025-12-18 Listed $179,000 LARMLS
Cash-flow waterfall
monthlySold comps — $/sqft
last 12 mo · ≤1 miLoading sold comps…