1649 Talking Rocks Rd · Indian Point, MO
Flood risk 1/10 · Minimal
- FEMA flood zone
- X (unshaded)
- Chance of flooding over 30 yrs
- 0.0%
- Est. flood insurance / yr
- $507 – $1,088
Fire risk 4/10 · Minor
- Est. fire insurance / yr
- $1,054 – $1,958
Heat risk 4/10 · Minor
- Hot days now (above 105°F)
- 7 days/yr
- Hot days in 30 yrs
- 18 days/yr
Wind risk 2/10 · Minimal
- Chance of severe wind over 30 yrs
- 1.0%
Air-quality risk 2/10 · Minimal
- Unhealthy air days now
- 0 days/yr
- Unhealthy air days in 30 yrs
- 1 days/yr
Risk factors via First Street. Map © Google.
Why this score? — see what drove the F grade
The composite is a weighted blend of 9 inputs, each scored 0–100. Each bar is that input's sub-score; the figure is the points it added to the 100-point composite (weight × sub-score).
- Cash flow +7.5/30.0
- ARV discount +7.5/15.0
- Appreciation +3.9/10.0
- Schools +3.2/10.0
- Livability +3.1/5.0
- Rent growth +2.5/5.0
- Condition / age +2.5/5.0
- DSCR +1.6/10.0
- 1% rule +0.9/10.0
$225,000
🖨 Deal sheet 📄 Offer letter ✓ Due diligence
Listing remarks
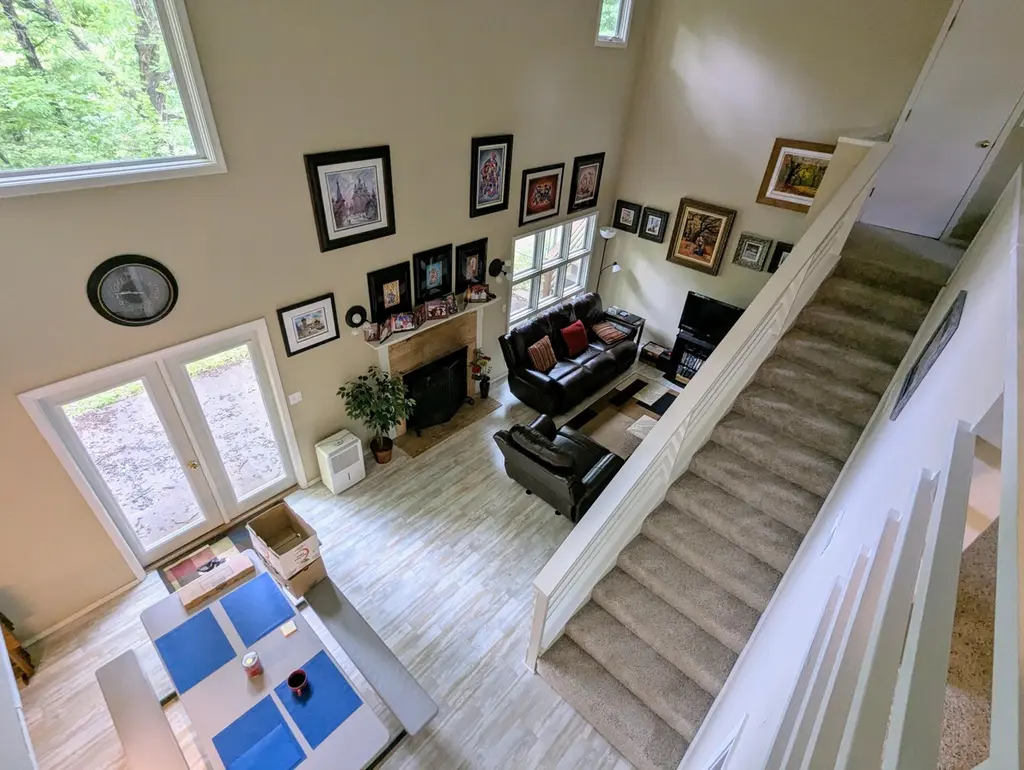
JUST BRING YOUR TOOTHBRUSH as everything stays in this 2 Bedroom/2 Bath stucco Lakehome fully furnished located only 3 minutes down Talking Rocks Rd off Bus 13 in Branson West. The Lakehome is only a 5 minutes to the available Slip w/ Pontoon/Lift. Boat Launch also at the Stump Hollow Dock. Partially chain linked fence, serenity garden, 2 additional parking pads, 10 X 39 back concrete patio, oversized 1 car garage w/ workshop, fully furnished so ready to move in and enjoy the lake life. Available 10 X 28 Slip w/ Pontoon Boat & 4pt Lift in dock w/ swim deck/fish cleaning station/water faucets/electric. Request a private showing today. Great LAKE opportunity!!
Key facts
- Boat launch
- Swim deck
- Serenity garden
Tags
Property features AI
Finance
- Other: TV antenna
Exterior
- Parking: Has garage (1 car); Additional parking; Driveway; Garage faces front; Workshop area in garage; Private parking
- Security: Smoke detector(s)
- Utilities: Propane for fuel; Septic tank sewer
- Home design: Single-family residential property; Located in the Starlite Hills subdivision; Directions: Branson West: South on Bus 13. Left on Talking Rocks Road to SIY on Right
- Construction: Stucco exterior; Metal roof; Full finished below-grade area; Home warranty included
- Exterior features: Boat slip; Rain gutters; Patio (covered); Deck; Storm doors; Partial chain-link fencing
Interior
- Kitchen: Electric oven; Free-standing electric oven; Dishwasher; Microwave; Refrigerator; Garbage disposal; Electric water heater
- Bedrooms: Bedroom locations not specified
- Flooring: Carpet; Tile; Laminate
- Bathrooms: 2 full bathrooms
- Heating & cooling: Heat pump (heating and cooling); Electric heating; Propane heating; Fireplace(s) (gas/propane) located in living room and basement; Ceiling fan(s)
- Interior features: High speed internet available; High ceilings; Insulated and double-pane windows with blinds and window coverings; Finished walk-out basement (full)
- Laundry & utility: Washer and dryer included; Main level laundry
Neighborhood map
What this means for you Summary
Snapshot
- This is a 2-bed/2.0-bath other listed at $225k.
Deal economics
- At list price, monthly cash flow is $-281 ($-3k/yr) — negative.
- To cash-flow at today's rent, offer at most $175k (22.0% below list).
- To meet the 1% rule (rent ≥ 1% of price), the offer needs to be $133k (40.7% below list).
- Recommended offer: $133k (40.7% below list) — sets the bar for 1% rule.
- Cap rate 4.8% vs local median 1.2% in Indian Point — top-decile yield for the area; either an underpriced asset or a hidden risk that comps aren't pricing in. Stress-test before assuming the spread holds.
Location & tenants
- Location reads 62/100 on livability (#369 in MO) — a middle-class / working-renter tenant base. Strengths: crime A, housing A-; Watch: health & safety C-, cost of living D+, amenities F.
- Reeds Spring R-IV (rural): math 34% / reading 42% proficiency, ranked #182 of 324 in MO (top 56%) — families likely to look elsewhere, expect single-tenant / working-renter base with shorter leases.
- Zoned schools: Reeds Spring Elem. (math 33% / reading 33%, grade F, #744 of 1,115 statewide, top 67%, 358 students, 62% FRL); Reeds Spring Middle (math 31% / reading 46%, grade F, #202 of 391 statewide, top 54%, 286 students, 56% FRL); Reeds Spring High (math 32% / reading 47%, grade F, #247 of 521 statewide, top 55%, 602 students, 47% FRL) — zoned schools at 55% FRL track the district average.
- Market conditions: 341 active listings in the ZIP; 191 units permitted in Stone County in 2024 (0 in 5+ unit buildings).
Forward outlook
- Local home prices are declining (-2.2%/yr); year-one equity from $2k of loan paydown is wiped out by about $5k of value loss. Plan a longer hold.
- Stone County population projected at -30% by 2050 — secular population decline; favor cash flow + early exit over multi-decade hold.
Negotiation context
- Only 10 days on market — expect competitive offers; lowballing is unlikely to land.
- 3 sale attempts with the ask held roughly flat each time — persistent listings suggest the price (not the market) is what's stuck; bring a comps-based counter.
Questions for the listing agent
- What do current leases actually rent for vs. the listed asking? Can we see a recent rent roll and the last 12 months of T-12 income?
- Is there a deadline driving the sale (1031 exchange, divorce, estate, relocation)? That informs how much negotiation room exists.
- Schools are F-rated, which usually means shorter tenancies and higher turnover. Who's the typical renter profile here, and what's been the actual vacancy rate?
- The area grade is low — what's the realistic commute time and amenity access for the typical tenant pool here? Any planned neighborhood developments (good or bad) we should know about?
- What's the average days-on-market for RENTAL listings here right now (not sales)? A rising rental-DOM trend means longer vacancies and softer asking-rent achievability than the comps imply.
- What's the recent tenant-quality profile in this submarket — average credit score on applications, eviction rate, late-payment / NSF rate, and stable-employment percentage? A property-management company in the area should have these aggregated.
- How much new for-sale + rental construction is in the pipeline within 1–3 miles? Heavy new supply typically softens prices + rents 12–24 months out; constrained supply supports both.
Investment metrics
- 1% rule
- 0.59% ✗
- Cap rate
- 4.80%
- Cash-on-cash
- -5.35%
- DSCR
- 0.76
- GRM
- 14.0
CMA / ARV
No comps found within radius.
Projected returns pro-forma
-2.17% appreciation · 3.0% rent growth · sell at horizon
- IRR
- -19.6%
- Equity multiple
- 0.26×
- Total profit
- $-46,594
- Equity at exit
- $41,917
- IRR
- -13.0%
- Equity multiple
- 0.09×
- Total profit
- $-57,118
- Equity at exit
- $34,139
Cash invested: $63,000 (down + closing). Projections, not guarantees.
Landlord ↔ Tenant lean methodology
- Overall (STATE)
- 81 Strongly Landlord-Friendly
- State Missouri
- 81 Strongly Landlord-Friendly · R+10
- County
- — inherits STATE
- City
- — inherits STATE
ZIP-level market 65737
- Home prices YoY
- -0.9%
- Active inventory
- 341
- Price-to-rent
- 14.0×
Monthly cashflow live
- Estimated rent
- $1,335 medium interval (Pro) →
- Mortgage (P&I)
- −$1,180
- Tax from tax record
- −$61 /mo · $737/yr
- Insurance
- −$94
- HOA
- −$0
- Vacancy / Maint / Mgmt
- −$280
- Net cashflow
- $-281
Break-even live
UW: 25.0% down · 7.5% · 30yr · 1.5% tax · 5.0% vac · 8.0% maint · 8.0% mgmt
Financing live
Cash to close
- Down payment
- $56,250
- Closing costs
- $6,750
- Reserves months
- —
- Total cash needed
- —
Loan-product check · same deal, 3 products live
Conventional
25% down · 7.5% · 30yr
- Down + closing
- —
- Monthly P&I
- —
- Monthly cashflow
- —
- DSCR
- —
- Eligible?
- —
Personal DTI + credit; lowest rate.
DSCR
20% down · 8.5% · 30yr
- Down + closing
- —
- Monthly P&I
- —
- Monthly cashflow
- —
- DSCR
- —
- Eligible?
- —
No personal income docs; deal must DSCR.
Hard money
10% down · 12.0% · 12mo
- Down + closing
- —
- Monthly P&I
- —
- Monthly cashflow
- —
- DSCR
- —
- Eligible?
- —
Short-term bridge; refi at stabilization.
Listing history 8 events
-
2026-05-11status Pending 672-char remark
-
2026-05-01$225,000 Active 672-char remark
-
2025-12-02status Active
-
2025-12-02price $239,700
-
2025-07-09price $249,700
-
2025-05-23$282,400 Active
-
2012-07-17soldstatus
-
1992-09-01soldstatus
ⓘ Source: listings_history table (triggers on properties + properties_extension) + one-shot
backfill from property_details.listing_events for pre-trigger history.
Tax reassessment forecast MO · Resets to sale price
- Current annual tax
- $737 · $61/mo
- Projected year-2 tax
- $2,182 · $182/mo
- Expected delta
- +$1,445/yr (+$120/mo · 196.1%)
ⓘ Screening estimate from a state-policy table — verify with the county assessor before closing.
Climate risk First Street
- Flood 1/10 Low FEMA zone X (unshaded) · 0% chance over 30 yrs
- Wildfire 4/10 Moderate
- Heat 4/10 Moderate 7 d/yr ≥105°F today · 18 d/yr by 30 yrs out
- Wind 2/10 Low 100% chance of damaging wind over 30 yrs
- Air quality 2/10 Low 0 unhealthy d/yr today · 1 by 30 yrs out
Nearby sold comps map
Loading sold comps map…
Walkable amenities ~0.75 mi
Loading nearby amenities…
Taxation est. · year 1
- Rental income
- $16,014
- − Mortgage interest
- −$12,603
- − Property taxes
- −$737
- − Insurance
- −$1,125
- − Repairs & maintenance
- −$1,281
- − Management
- −$1,281
- − Depreciation
- −$6,545
- Taxable loss
- −$7,559
- Est. tax savings @ 24.0%
- +$1,814
- After-tax cash flow
- $-1,556/yr
For passive investors: Depreciation is non-cash, so a rental often shows a tax loss while cash-flowing — sheltering income. Rental losses are passive: they offset passive income freely, and up to $25,000/yr can offset ordinary (W-2) income if you actively participate and your MAGI is under $100k (phasing out to $0 by $150k); unused losses carry forward. On sale, claimed depreciation is recaptured at up to 25%, and gains may owe capital-gains tax (a 1031 exchange can defer both). Figures are a year-1 estimate at your 24.0% rate — not tax advice; consult a CPA.
Schools (NCES district)
- District
- Reeds Spring R-IV
- NCES district ID
- 2926160
- Math proficiency
- 34% ▼ -3.00%
- Reading proficiency
- 42% ▼ -1.00%
- Median HH income
- $42,158
- Composite
- 32.06/100
- National rank
- #5819
- State rank
- #182 of 324 in MO
Livability — Indian Point
- Score
- 62/100
- State rank
- #369
- US rank
- #16282
Category grades
Schools grade is shown separately in the Schools card above.
Census & demographics
- Population (ZIP)
- 8,279
Population outlook (Stone County) Hauer SSP2
- Today (2025)
- 28,147 people
- By 2030
- 26,405 · -6.2%
- By 2040
- 22,762 · -19.1%
- By 2050
- 19,706 · -30.0%
- By 2075
- 14,742 · -47.6%
- By 2100
- 10,832 · -61.5%
Race, ethnicity, and origin ACS 2023
- Neighborhood character
- Predominantly White (91%)
- Race & ethnicity
- White 91% Hispanic / Latino 6% Two or more races 5%
- Hispanic origin (detail)
- Mexican 3%
- Common ancestry
- Lithuanian 5% Slovak 4% Iranian 3%
- Foreign-born
- 2% · Canada, China
- Languages at home
- 97% English-only · Spanish 3%
Political lean MEDSL · Stone
- 2024 margin
- Solid R (+61.4) · D 18.9% · R 80.3%
- 2008→2024 swing
- -24.1pp toward R · 2008: -37.3pp · 2024: -61.4pp
- All cycles
- 2024: R+61.4 2020: R+61.1 2016: R+62.1 2012: R+49.2 2008: R+37.3
Not yet ingested
- Civics
- —
Market trends
- HPI YoY
- ▼ -2.17%
- Current HPI
- 239.032
- Rent YoY
- —
- Metro
- —
- State GDP YoY
- ▲ 1.84%
- F500 in state
- 20
Industry mix (Fortune 500 HQ in MO)
| Industry | F500 HQs | Revenue |
|---|---|---|
| Healthcare | 1 | $163B |
|
||
| Insurance | 1 | $21B |
|
||
| Industrial Technology | 1 | $17B |
|
||
| Retail | 1 | $16B |
|
||
| Industrial Distribution | 1 | $10B |
|
||
| Utilities | 1 | $9B |
|
||
Price history
-20.3% since first listed9 events — show timeline
- 2026-06-12 Sold (MLS) — SOMO
- 2026-05-11 Pending — SOMO
- 2026-05-01 Listed $225,000 SOMO
- 2025-12-02 Relisted — SOMO
- 2025-12-02 Price Changed $239,700 SOMO
- 2025-07-09 Price Changed $249,700 SOMO
- 2025-05-23 Listed $282,400 SOMO
- 2012-07-17 Sold (Public Records) — Public Records
- 1992-09-01 Sold (Public Records) — Public Records
Property tax history
+1.9%/yrLatest (2025): $737 · -0.0% YoY. Source: county tax records.
Cash-flow waterfall
monthlySold comps — $/sqft
last 12 mo · ≤1 miLoading sold comps…