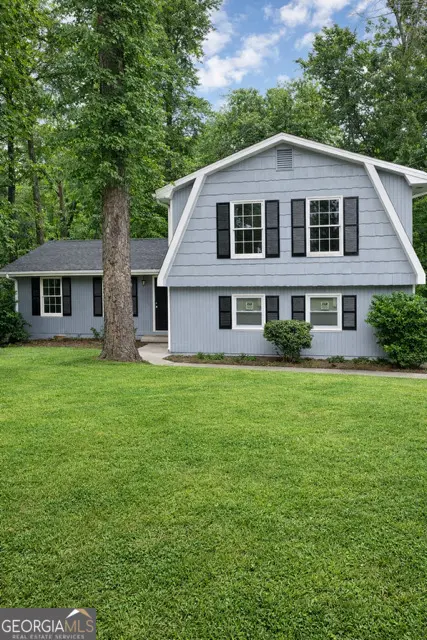
4700 Jakes Trl · Stonecrest, GA
Flood risk 1/10 · Minimal
- FEMA flood zone
- X (unshaded)
- Chance of flooding over 30 yrs
- 0.0%
- Est. flood insurance / yr
- $507 – $1,088
Fire risk 1/10 · Minimal
- Est. fire insurance / yr
- $963 – $1,789
Heat risk 5/10 · Moderate
- Hot days now (above 105°F)
- 7 days/yr
- Hot days in 30 yrs
- 16 days/yr
Wind risk 5/10 · Moderate
- Chance of severe wind over 30 yrs
- 24.0%
Air-quality risk 5/10 · Moderate
- Unhealthy air days now
- 7 days/yr
- Unhealthy air days in 30 yrs
- 10 days/yr
Risk factors via First Street. Map © Google.
Why this score? — see what drove the C- grade
The composite is a weighted blend of 9 inputs, each scored 0–100. Each bar is that input's sub-score; the figure is the points it added to the 100-point composite (weight × sub-score).
- Cash flow +16.7/30.0
- ARV discount +15.0/15.0
- DSCR +5.2/10.0
- 1% rule +5.1/10.0
- Rent growth +3.0/5.0
- Livability +2.5/5.0
- Condition / age +2.5/5.0
- Schools +2.1/10.0
- Appreciation +0.0/10.0
$235,000
🖨 Deal sheet 📄 Offer letter ✓ Due diligence
Listing remarks MLS
Welcome to this split level modern style home nestled in an established Decatur neighborhood! Featuring 3 bedrooms, 2.5 bathrooms, and over 2,000 square feet of living space, this home offers endless potential for homeowners and investors alike. Step inside to find a functional floor plan with generous living areas, perfect for entertaining and everyday living. The home boasts spacious bedrooms, ample natural light, and plenty of room to customize and make your own. Situated on a large 0.35-acre lot, the property offers a sizable backyard ideal for outdoor gatherings, gardening, or future enhancements. Conveniently located near shopping, dining, schools, parks, and major highways, this property combines comfort, space, and accessibility. Whether you're looking for your next home or your next investment opportunity, this property is full of potential! Don't miss your chance to own this charming Decatur gem schedule your private showing today!
Key facts
- Near schools
- Near dining
- Sizable backyard
Tags
Neighborhood map
What this means for you Summary
Snapshot
- This is a 3-bed/2.5-bath single-family listed at $235k.
Deal economics
- At list price, monthly cash flow is $145 ($2k/yr) — positive.
- The deal already cash-flows at list — no discount required.
- Meets the 1% rule at list price ($2k rent vs $235k).
- Recommended offer: $221k (6.0% below list) — sets the bar for market timing.
- Cap rate 7.0% vs local median 5.1% in Stonecrest — top-decile yield for the area; either an underpriced asset or a hidden risk that comps aren't pricing in. Stress-test before assuming the spread holds.
Location & tenants
- Location reads: area grade C — affects rentability + tenant quality, not the cash-flow math above.
- Dekalb County (suburban): math 19% / reading 28% proficiency, ranked #125 of 174 in GA (top 72%) — low school quality limits family demand, transient renter base, plan for 1-2y turnover; 68% free/reduced lunch — lower-income household profile, screen leases tightly.
- Market conditions: Rents rising (+2.2%/yr); 353 active listings in the ZIP; 33 comparable units currently listed for rent nearby; rentals lingering (median 44d on market — plan ~5-8 weeks vacancy on turnover, expect pricing pressure); 52% of comp listings sitting > 30 days — soft ceiling on asking rent; 1,240 units permitted in DeKalb County in 2024 (385 in 5+ unit buildings).
- At $2,383/mo this rent would consume 45% of the median local household income ($64k/yr) (locally 1659% of renters already pay >50% of income on rent) — very limited rent-growth headroom before tenants either downsize or default.
Forward outlook
- Local home prices are declining (-3.0%/yr); year-one equity from $2k of loan paydown is wiped out by about $7k of value loss. Plan a longer hold.
- DeKalb County population projected at +28% by 2050 — long-run rental-demand tailwind backs the buy-and-hold thesis.
Negotiation context
- It's been on market 66 days — a 6% lower offer ($221k) is reasonable based on typical stale-listing flexibility.
- Current owner paid $75k; list at $235k implies a 213% gain — meaningful room to come down on a strong offer.
Risks & watch-outs
- Climate carrying-cost: moderate wind risk, 24% chance of damaging wind over 30y; extreme-heat days projected 7→16/yr by 2055 (HVAC capex compounding) — expect insurance premiums to compound above CPI over the hold.
Questions for the listing agent
- It's been on market 66 days. Have you received any prior offers? Is the seller open to a 6% concession, seller financing, or rate buy-down credit?
- Built in 1973 — when were the roof, HVAC, electrical panel, plumbing, and water heater last replaced?
- Why hasn't it sold? Are there any deal-killer items the seller is aware of (foundation, flood, title, zoning, code violations)?
- Is there a deadline driving the sale (1031 exchange, divorce, estate, relocation)? That informs how much negotiation room exists.
- What's the average days-on-market for RENTAL listings here right now (not sales)? A rising rental-DOM trend means longer vacancies and softer asking-rent achievability than the comps imply.
- What's the recent tenant-quality profile in this submarket — average credit score on applications, eviction rate, late-payment / NSF rate, and stable-employment percentage? A property-management company in the area should have these aggregated.
- How much new for-sale + rental construction is in the pipeline within 1–3 miles? Heavy new supply typically softens prices + rents 12–24 months out; constrained supply supports both.
Investment metrics
- 1% rule
- 1.01% ✓
- Cap rate
- 7.04%
- Cash-on-cash
- 2.65%
- DSCR
- 1.12
- GRM
- 8.2
CMA / ARV
- ARV (median comp)
- $296,069
- List price
- $235,000
- Delta
- -20.63%
- Verdict
- UNDERPRICED
- Comps
- 20 within 1.0 mi
Show comp detail 12 sales within ~0.75 mi
| Address | Dist | Beds/Ba | Sqft | Sold | Price | $/sf | Match |
|---|---|---|---|---|---|---|---|
| 3202 Wintercreeper Dr | 0.64mi | 3/2.0 | 1,999 (-3%) | 1mo | $145,700 | $73 | 63 |
| 3127 Snapfinger Ct | 0.57mi | 3/2.5 | 2,186 (+6%) | 1mo | $185,000 | $85 | 61 |
| 2594 Treadway Dr | 0.50mi | 4/2.5 (+1) | 1,974 (-4%) | 8mo | $250,000 | $127 | 59 |
| 2904 Pleasant Ridge Dr | 0.70mi | 3/2.0 | 1,956 (-5%) | 8mo | $244,000 | $125 | 51 |
| 2849 Snapfinger Rd | 0.57mi | 4/3.0 (+1) | 1,925 (-6%) | 7mo | $256,000 | $133 | 50 |
| 4762 Huntsman Bnd | 0.50mi | 3/2.0 | 1,864 (-9%) | 12mo | $248,350 | $133 | 49 |
| 4480 Raleigh Dr | 0.69mi | 3/2.0 | 1,882 (-8%) | 5mo | $177,000 | $94 | 48 |
| 4402 Sebring Walk | 0.71mi | 4/2.5 (+1) | 1,968 (-4%) | 13mo | $230,000 | $117 | 44 |
| 3094 Oxbridge Way | 0.66mi | 4/2.5 (+1) | 2,254 (+10%) | 6mo | $261,000 | $116 | 43 |
| 4715 Wildginger Run | 0.64mi | 4/3.0 (+1) | 1,827 (-11%) | 3mo | $180,000 | $99 | 42 |
| 3240 Corktree Trl | 0.74mi | 4/2.5 (+1) | 1,895 (-8%) | 8mo | $255,000 | $135 | 41 |
| 5004 Jack Dr | 0.73mi | 4/2.5 (+1) | 2,256 (+10%) | 7mo | $325,000 | $144 | 38 |
Match score weights: distance 35% · size 25% · config 20% · recency 20%. Top-matched comps best support the ARV.
Projected returns pro-forma
-3.0% appreciation · 2.18% rent growth · sell at horizon
- IRR
- -13.0%
- Equity multiple
- 0.53×
- Total profit
- $-30,659
- Equity at exit
- $35,039
- IRR
- -5.4%
- Equity multiple
- 0.66×
- Total profit
- $-22,208
- Equity at exit
- $20,319
Cash invested: $65,800 (down + closing). Projections, not guarantees.
Landlord ↔ Tenant lean methodology
- Overall (STATE)
- 90 Strongly Landlord-Friendly
- State Georgia
- 90 Strongly Landlord-Friendly · R+3
- County
- — inherits STATE
- City
- — inherits STATE
ZIP-level market 30034
- Home prices YoY
- -27.4%
- Rents YoY
- 2.2%
- Active inventory
- 353
- Price-to-rent
- 8.2×
Monthly cashflow live
- Estimated rent
- $2,383 high interval (Pro) →
- Mortgage (P&I)
- −$1,232
- Tax from tax record
- −$407 /mo · $4,878/yr
- Insurance
- −$98
- HOA
- −$0
- Vacancy / Maint / Mgmt
- −$500
- Net cashflow
- $145
Break-even live
UW: 25.0% down · 7.5% · 30yr · 1.5% tax · 5.0% vac · 8.0% maint · 8.0% mgmt
Financing live
Cash to close
- Down payment
- $58,750
- Closing costs
- $7,050
- Reserves months
- —
- Total cash needed
- —
Loan-product check · same deal, 3 products live
Conventional
25% down · 7.5% · 30yr
- Down + closing
- —
- Monthly P&I
- —
- Monthly cashflow
- —
- DSCR
- —
- Eligible?
- —
Personal DTI + credit; lowest rate.
DSCR
20% down · 8.5% · 30yr
- Down + closing
- —
- Monthly P&I
- —
- Monthly cashflow
- —
- DSCR
- —
- Eligible?
- —
No personal income docs; deal must DSCR.
Hard money
10% down · 12.0% · 12mo
- Down + closing
- —
- Monthly P&I
- —
- Monthly cashflow
- —
- DSCR
- —
- Eligible?
- —
Short-term bridge; refi at stabilization.
Rent comps 33 comps
| Address | Beds | Baths | Sqft | Rent | $/sqft | DOM | Units | Dist |
|---|---|---|---|---|---|---|---|---|
| 2937 Thompson Cir Decatur, GA | 3.0 | 2.0 | 1480 | $1,860 | $1.26 | 1d | 1 | 0.27mi |
| 3095 Riders Trl Decatur, GA | 3.0 | 2.0 | 1800 | $4,500 | $2.50 | 1d | 1 | 0.33mi |
| 2884 Thompson Cir Decatur, GA | 4.0 | 3.5 | 2868 | $6,400 | $2.23 | 24d | 1 | 0.38mi |
| 2564 Treadway Dr Decatur, GA | 3.0 | 2.0 | 1927 | $2,950 | $1.53 | 43d | 1 | 0.44mi |
| 2878 Snapfinger Mnr Decatur, GA | 3.0 | 2.5 | 1670 | $1,780 | $1.07 | 2d | 1 | 0.46mi |
| 2559 Walden Lake Dr Unit 1 Decatur, GA | 3.0 | 2.5 | 1464 | $2,000 | $1.37 | 43d | 1 | 0.74mi |
| 2545 Walden Lake Dr Unit 1 Decatur, GA | 3.0 | 2.5 | 1464 | $2,000 | $1.37 | 43d | 1 | 0.77mi |
| 4936 Longview Run Decatur, GA | 4.0 | 2.5 | 2238 | $2,900 | $1.30 | 43d | 1 | 0.83mi |
| 4948 Longview Run Decatur, GA | 3.0 | 2.0 | 1892 | $2,135 | $1.13 | 5d | 1 | 0.84mi |
| 5038 Longview Walk Decatur, GA | 3.0 | 2.5 | 1577 | $1,995 | $1.27 | 43d | 1 | 0.89mi |
| 5108 Jack Dr Decatur, GA | 3.0 | 2.5 | 1872 | $2,185 | $1.17 | 24d | 1 | 0.89mi |
| 4917 Longview Walk Decatur, GA | 3.0 | 2.5 | 1486 | $2,000 | $1.35 | 20d | 1 | 0.93mi |
| 4908 Longview Walk Decatur, GA | 3.0 | 2.5 | 1480 | $2,000 | $1.35 | 43d | 1 | 0.94mi |
| 2658 Avanti Way Decatur, GA | 3.0 | 2.5 | 1616 | $2,000 | $1.24 | 43d | 1 | 0.96mi |
| 2569 Terrace Trl Decatur, GA | 3.0 | 3.0 | 1752 | $1,800 | $1.03 | 43d | 1 | 0.97mi |
| 2563 Terrace Trl Decatur, GA | 3.0 | 3.0 | 1752 | $1,950 | $1.11 | 12d | 1 | 0.98mi |
| 2993 Havenwood Way Lithonia, GA | 4.0 | 2.0 | 2655 | $2,300 | $0.87 | 43d | 1 | 1.00mi |
| 2553 Terrace Trl Unit 2553 Decatur, GA | 3.0 | 2.0 | 1865 | $1,950 | $1.05 | 12d | 1 | 1.01mi |
| 4433 Golf Vista Cir Decatur, GA | 3.0 | 2.5 | 1495 | $1,350 | $0.90 | 24d | 1 | 1.01mi |
| 2525 Terrace Trl Unit 2525 Decatur, GA | 3.0 | 3.0 | 1593 | $1,850 | $1.16 | 12d | 1 | 1.02mi |
| 5089 Galleon Xing Decatur, GA | 4.0 | 2.5 | 2488 | $2,460 | $0.99 | 44d | 1 | 1.10mi |
| 2692 Paxton PL #14 Decatur, GA | 3.0 | 2.5 | 1611 | $2,299 | $1.43 | 43d | 1 | 1.12mi |
| 2481 Terrace Trl Decatur, GA | 3.0 | 3.0 | 1752 | $2,050 | $1.17 | 43d | 1 | 1.12mi |
| 5388 Winding Glen Dr Lithonia, GA | 4.0 | 2.5 | 2251 | $2,230 | $0.99 | 43d | 1 | 1.16mi |
| 4292 Callum Ct Decatur, GA | 3.0 | 2.5 | 1611 | $2,200 | $1.37 | 43d | 1 | 1.20mi |
| 4282 Callum Ct Decatur, GA | 3.0 | 2.5 | 1611 | $2,200 | $1.37 | 43d | 1 | 1.21mi |
| 3170 Sherwood Oaks Ct Decatur, GA | 4.0 | 2.5 | 2987 | $3,200 | $1.07 | 1d | 1 | 1.25mi |
| 4955 Windsor Downs Ln Decatur, GA | 4.0 | 2.0 | 1888 | $2,050 | $1.09 | 5d | 1 | 1.33mi |
| 100 Cavalier Xing Stonecrest, GA | 3.0 | 2.0 | 1558 | $1,990 | $1.28 | 24d | 1 | 1.40mi |
| 2450 Northmill Ln Decatur, GA | 4.0 | 2.5 | 2046 | $2,135 | $1.04 | 43d | 1 | 1.41mi |
| 4909 Truitt Ln Decatur, GA | 3.0 | 2.0 | 1697 | $2,500 | $1.47 | 43d | 1 | 1.42mi |
| 3468 Deer Trce Lithonia, GA | 3.0 | 1.0 | 1886 | $2,800 | $1.48 | 24d | 1 | 1.46mi |
| 4919 Wilkins Station Dr Decatur, GA | 3.0 | 2.0 | 1770 | $2,161 | $1.22 | 20d | 1 | 1.48mi |
Listing history 17 events
-
2026-06-18days on market $235,000 Active 66 DOM
-
2026-06-17days on market $235,000 Active 65 DOM
-
2026-06-16days on market $235,000 Active 64 DOM
-
2026-06-15days on market $235,000 Active 63 DOM
-
2026-06-13days on market $235,000 Active 61 DOM
-
2026-06-09days on market $235,000 Active 57 DOM
-
2026-06-08days on market $235,000 Active 56 DOM
-
2026-06-07days on market $235,000 Active 55 DOM
-
2026-06-04statusdays on market $235,000 Active 52 DOM
-
2026-06-03days on market $235,000 Price Change 51 DOM
-
2026-06-02days on market $235,000 Price Change 50 DOM
-
2026-06-02pricestatus $235,000 Price Change 49 DOM
-
2026-06-01days on market $260,000 Active 49 DOM
-
2026-05-31days on market $260,000 Active 48 DOM
-
2026-04-09$260,000 New 955-char remark
Show marketing remark (955 chars)
Welcome to this split level modern style home nestled in an established Decatur neighborhood! Featuring 3 bedrooms, 2.5 bathrooms, and over 2,000 square feet of living space, this home offers endless potential for homeowners and investors alike. Step inside to find a functional floor plan with generous living areas, perfect for entertaining and everyday living. The home boasts spacious bedrooms, ample natural light, and plenty of room to customize and make your own. Situated on a large 0.35-acre lot, the property offers a sizable backyard ideal for outdoor gatherings, gardening, or future enhancements. Conveniently located near shopping, dining, schools, parks, and major highways, this property combines comfort, space, and accessibility. Whether you're looking for your next home or your next investment opportunity, this property is full of potential! Don't miss your chance to own this charming Decatur gem schedule your private showing today!
-
2008-09-12soldstatus $75,000
-
1982-07-30soldstatus $63,300
ⓘ Source: listings_history table (triggers on properties + properties_extension) + one-shot
backfill from property_details.listing_events for pre-trigger history.
Tax reassessment forecast GA · Resets to sale price
- Current annual tax
- $4,878 · $407/mo
- Projected year-2 tax
- $4,878 · $407/mo
- Expected delta
- $0/yr ($0/mo · 0.0%)
ⓘ Screening estimate from a state-policy table — verify with the county assessor before closing.
Climate risk First Street
- Flood 1/10 Low FEMA zone X (unshaded) · 0% chance over 30 yrs
- Wildfire 1/10 Low
- Heat 5/10 Major 7 d/yr ≥105°F today · 16 d/yr by 30 yrs out
- Wind 5/10 Major 24% chance of damaging wind over 30 yrs
- Air quality 5/10 Major 7 unhealthy d/yr today · 10 by 30 yrs out
Nearby sold comps map
Loading sold comps map…
Walkable amenities ~0.75 mi
Loading nearby amenities…
Taxation est. · year 1
- Rental income
- $28,592
- − Mortgage interest
- −$13,164
- − Property taxes
- −$4,878
- − Insurance
- −$1,175
- − Repairs & maintenance
- −$2,287
- − Management
- −$2,287
- − Depreciation
- −$6,836
- Taxable loss
- −$2,036
- Est. tax savings @ 24.0%
- +$489
- After-tax cash flow
- $2,235/yr
For passive investors: Depreciation is non-cash, so a rental often shows a tax loss while cash-flowing — sheltering income. Rental losses are passive: they offset passive income freely, and up to $25,000/yr can offset ordinary (W-2) income if you actively participate and your MAGI is under $100k (phasing out to $0 by $150k); unused losses carry forward. On sale, claimed depreciation is recaptured at up to 25%, and gains may owe capital-gains tax (a 1031 exchange can defer both). Figures are a year-1 estimate at your 24.0% rate — not tax advice; consult a CPA.
Schools (NCES district)
- District
- Dekalb County
- NCES district ID
- 1301740
- Math proficiency
- 19% ▼ -12.00%
- Reading proficiency
- 28% ▼ -7.00%
- Median HH income
- $51,448
- Composite
- 20.92/100
- National rank
- #8482
- State rank
- #125 of 174 in GA
Livability — Stonecrest
No livability data for this city. (Only ~50 U.S. cities are tracked.)
Census & demographics
- County
- Dekalb County · 782,738 people
- City population
- 106,165
- Metro
- Atlanta-Sandy Springs-Alpharetta, GA
- Population (ZIP)
- 41,847
- Household income
- $63,517
- Rent vs Own
- Severe rent burden
- 1659.0
Population outlook (DeKalb County) Hauer SSP2
- Today (2025)
- 839,977 people
- By 2030
- 891,768 · +6.2%
- By 2040
- 988,894 · +17.7%
- By 2050
- 1,074,583 · +27.9%
- By 2075
- 1,245,026 · +48.2%
- By 2100
- 1,303,135 · +55.1%
Race, ethnicity, and origin ACS 2023
- Neighborhood character
- Predominantly Black (90%)
- Race & ethnicity
- Black 90% White 4% Two or more races 3% Hispanic / Latino 2%
- Common ancestry
- Hispanic 1% Lithuanian 1%
- Foreign-born
- 8% · Canada
- Languages at home
- 93% English-only · Spanish 2% French/Haitian/Cajun 1%
Political lean MEDSL · DeKalb
- 2024 margin
- Solid D (+64.8) · D 81.9% · R 17.1% · Other 1.0%
- 2008→2024 swing
- +6.1pp toward D · 2008: 58.6pp · 2024: 64.8pp
- All cycles
- 2024: D+64.8 2020: D+67.4 2016: D+64.8 2012: D+56.8 2008: D+58.6
Not yet ingested
- Civics
- —
Market trends
- HPI YoY
- ▼ -78.92%
- Current HPI
- 209.5638
- Rent YoY
- ▲ 2.18%
- Metro
- Atlanta-Sandy Springs-Alpharetta, GA
- State GDP YoY
- ▲ 2.66%
- F500 in state
- 28
Industry mix (Fortune 500 HQ in GA)
| Industry | F500 HQs | Revenue |
|---|---|---|
| Paper / Packaging | 2 | $29B |
|
||
| Retail | 1 | $160B |
|
||
| Transportation / Logistics | 1 | $91B |
|
||
| Airlines | 1 | $62B |
|
||
| Consumer Goods | 1 | $47B |
|
||
| Utilities | 1 | $25B |
|
||
Price history
+310.7% since first listed3 events — show timeline
- 2026-04-09 Listed $260,000 GAMLS
- 2008-09-12 Sold (Public Records) $75,000 Public Records
- 1982-07-30 Sold (Public Records) $63,300 Public Records
Property tax history
+5.1%/yrLatest (2025): $4,878 · +2.5% YoY. Source: county tax records.
Cash-flow waterfall
monthlySold comps — $/sqft
last 12 mo · ≤1 miLoading sold comps…