 🌊 Lakefront
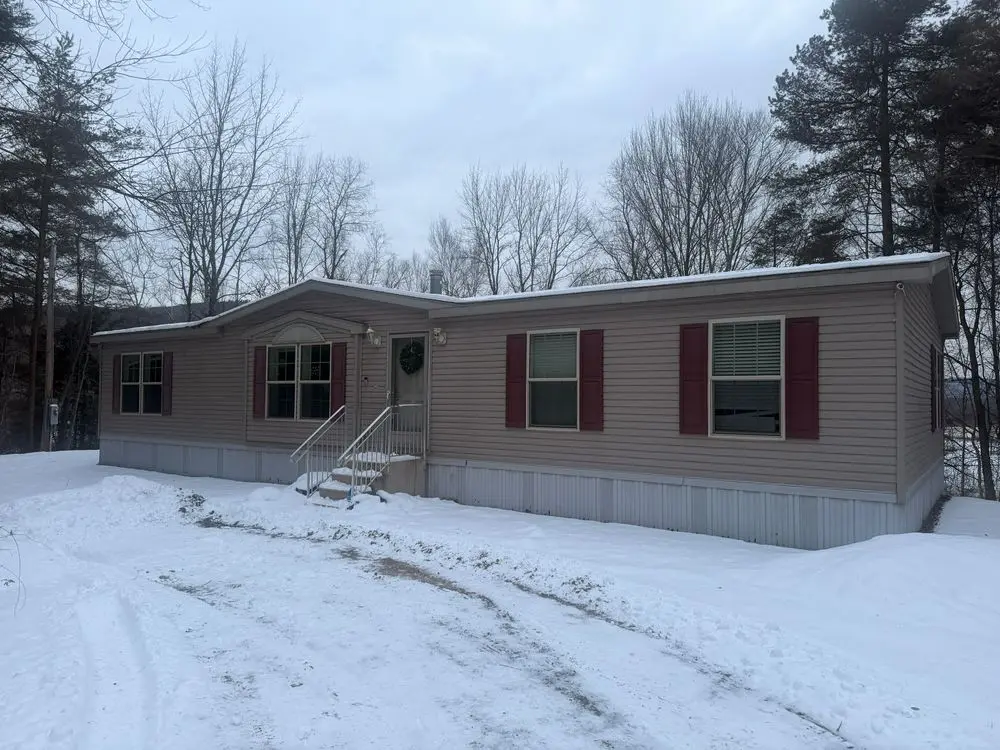
99 Glen Acres Rd · Margaretville, NY
Flood risk No data
- FEMA flood zone
- —
- Chance of flooding over 30 yrs
- —
- Est. flood insurance / yr
- —
Fire risk No data
- Est. fire insurance / yr
- —
Heat risk No data
- Hot days now (above threshold)
- —
- Hot days in 30 yrs
- —
Wind risk No data
- Chance of severe wind over 30 yrs
- —
Air-quality risk No data
- Unhealthy air days now
- —
- Unhealthy air days in 30 yrs
- —
Risk factors via First Street. Map © Google.
Why this score? — see what drove the C+ grade
The composite is a weighted blend of 9 inputs, each scored 0–100. Each bar is that input's sub-score; the figure is the points it added to the 100-point composite (weight × sub-score).
- Cash flow +25.0/30.0
- DSCR +8.2/10.0
- ARV discount +7.5/15.0
- Appreciation +7.2/10.0
- 1% rule +5.8/10.0
- Livability +3.2/5.0
- Schools +2.6/10.0
- Rent growth +2.5/5.0
- Condition / age +2.5/5.0
$299,999
🖨 Deal sheet 📄 Offer letter ✓ Due diligence
Listing remarks MLS
Doublewide for sale AS IS $199,900
Key facts
- Hot tub spa
- One-level living
- Pool
Tags
Neighborhood map
What this means for you Summary
Snapshot
- This is a 3-bed/2.0-bath manufactured listed at $300k.
Deal economics
- At list price, monthly cash flow is $655 ($8k/yr) — positive.
- The deal already cash-flows at list — no discount required.
- Meets the 1% rule at list price ($3k rent vs $300k).
- Cap rate 8.9% vs local median 4.2% in Margaretville — top-decile yield for the area; either an underpriced asset or a hidden risk that comps aren't pricing in. Stress-test before assuming the spread holds.
Location & tenants
- Location reads 65/100 on livability (#711 in NY) — a middle-class / working-renter tenant base. Strengths: health & safety A, cost of living A-; Watch: employment D, schools F, crime F.
- Margaretville Central School District (rural): math 30% / reading 25% proficiency, ranked #734 of 755 in NY (top 97%) — low school quality limits family demand, transient renter base, plan for 1-2y turnover.
- Market conditions: 47 active listings in the ZIP; 66 units permitted in Delaware County in 2024 (0 in 5+ unit buildings).
Forward outlook
- In year one you build about $15k of equity ($2k loan paydown + $13k appreciation (4.4% local appreciation)).
- Delaware County population projected at -27% by 2050 — secular population decline; favor cash flow + early exit over multi-decade hold.
- At projected returns (4.4% appreciation + 3.0% rent growth), your $84k cash investment doubles in ~4 years — after that, you're playing with house money.
- By year 3, paydown + projected appreciation supports a ~$37k cash-out refi (75% LTV) — recoverable capital for the next deal without selling this one.
Negotiation context
- Only 7 days on market — expect competitive offers; lowballing is unlikely to land.
Questions for the listing agent
- Is there a deadline driving the sale (1031 exchange, divorce, estate, relocation)? That informs how much negotiation room exists.
- Schools are F-rated, which usually means shorter tenancies and higher turnover. Who's the typical renter profile here, and what's been the actual vacancy rate?
- Crime grade is F in this area — have there been break-ins, vandalism, or insurance claims at this property in the last 3 years? What carrier currently insures it and at what premium?
- This sits on a lake — are riparian / water-frontage rights deeded with the parcel? Any dock permits, shoreline easements, or HOA water-use restrictions?
- What's the documented flood / surge / shoreline-erosion history here (FEMA AND non-FEMA — e.g., storm surge, creek backup, septic-field saturation)?
- Any water-quality or seasonal algae-bloom issues that affect tenant satisfaction or short-term-rental demand?
- What's the average days-on-market for RENTAL listings here right now (not sales)? A rising rental-DOM trend means longer vacancies and softer asking-rent achievability than the comps imply.
- What's the recent tenant-quality profile in this submarket — average credit score on applications, eviction rate, late-payment / NSF rate, and stable-employment percentage? A property-management company in the area should have these aggregated.
- How much new for-sale + rental construction is in the pipeline within 1–3 miles? Heavy new supply typically softens prices + rents 12–24 months out; constrained supply supports both.
Investment metrics
- 1% rule
- 1.08% ✓
- Cap rate
- 8.91%
- Cash-on-cash
- 9.35%
- DSCR
- 1.42
- GRM
- 7.7
CMA / ARV
- ARV (median comp)
- $128,734
- List price
- $299,999
- Delta
- 55.28%
- Verdict
- OVERPRICED
- Comps
- 3 within 1.0 mi
Projected returns pro-forma
4.36% appreciation · 3.0% rent growth · sell at horizon
- IRR
- 19.5%
- Equity multiple
- 2.19×
- Total profit
- $99,991
- Equity at exit
- $158,519
- IRR
- 19.7%
- Equity multiple
- 4.23×
- Total profit
- $271,656
- Equity at exit
- $264,525
Cash invested: $84,000 (down + closing). Projections, not guarantees.
Landlord ↔ Tenant lean methodology
- Overall (STATE)
- 15 Strongly Tenant-Friendly
- State New York
- 15 Strongly Tenant-Friendly · D+10
- County
- — inherits STATE
- City
- — inherits STATE
ZIP-level market 12455
- Home prices YoY
- 1.2%
- Active inventory
- 47
- Price-to-rent
- 7.7×
Monthly cashflow live
- Estimated rent
- $3,228 medium interval (Pro) →
- Mortgage (P&I)
- −$1,573
- Tax from tax record
- −$197 /mo · $2,367/yr
- Insurance
- −$125
- HOA
- −$0
- Vacancy / Maint / Mgmt
- −$678
- Net cashflow
- $655
Break-even live
UW: 25.0% down · 7.5% · 30yr · 1.5% tax · 5.0% vac · 8.0% maint · 8.0% mgmt
Financing live
Cash to close
- Down payment
- $75,000
- Closing costs
- $9,000
- Reserves months
- —
- Total cash needed
- —
Loan-product check · same deal, 3 products live
Conventional
25% down · 7.5% · 30yr
- Down + closing
- —
- Monthly P&I
- —
- Monthly cashflow
- —
- DSCR
- —
- Eligible?
- —
Personal DTI + credit; lowest rate.
DSCR
20% down · 8.5% · 30yr
- Down + closing
- —
- Monthly P&I
- —
- Monthly cashflow
- —
- DSCR
- —
- Eligible?
- —
No personal income docs; deal must DSCR.
Hard money
10% down · 12.0% · 12mo
- Down + closing
- —
- Monthly P&I
- —
- Monthly cashflow
- —
- DSCR
- —
- Eligible?
- —
Short-term bridge; refi at stabilization.
Listing history 15 events
-
2026-06-18days on market $299,999 Active 7 DOM
-
2026-06-17days on market $299,999 Active 6 DOM
-
2026-06-16days on market $299,999 Active 5 DOM
-
2026-06-15days on market $299,999 Active 4 DOM
-
2026-06-13days on market $299,999 Active 2 DOM
-
2026-06-12remarks 699-char remark
-
2026-06-12pricedays on market $299,999 Active 1 DOM
-
2026-06-09days on market $199,900 Active 138 DOM
-
2026-06-08days on market $199,900 Active 137 DOM
-
2026-06-07days on market $199,900 Active 136 DOM
-
2026-06-04days on market $199,900 Active 132 DOM
-
2026-06-02days on market $199,900 Active 131 DOM
-
2026-06-01days on market $199,900 Active 130 DOM
-
2026-05-31days on market $199,900 Active 129 DOM
-
2026-01-22$199,900 Active 34-char remark
Show marketing remark (34 chars)
Doublewide for sale AS IS $199,900
ⓘ Source: listings_history table (triggers on properties + properties_extension) + one-shot
backfill from property_details.listing_events for pre-trigger history.
Tax reassessment forecast NY · Partial reset (capped growth)
- Current annual tax
- $2,367 · $197/mo
- Projected year-2 tax
- $3,718 · $310/mo
- Expected delta
- +$1,352/yr (+$113/mo · 57.1%)
ⓘ Screening estimate from a state-policy table — verify with the county assessor before closing.
Nearby sold comps map
Loading sold comps map…
Walkable amenities ~0.75 mi
Loading nearby amenities…
Taxation est. · year 1
- Rental income
- $38,738
- − Mortgage interest
- −$16,805
- − Property taxes
- −$2,367
- − Insurance
- −$1,500
- − Repairs & maintenance
- −$3,099
- − Management
- −$3,099
- − Depreciation
- −$8,727
- Taxable income
- $3,141
- Est. tax owed @ 24.0%
- −$754
- After-tax cash flow
- $7,104/yr
For passive investors: Depreciation is non-cash, so a rental often shows a tax loss while cash-flowing — sheltering income. Rental losses are passive: they offset passive income freely, and up to $25,000/yr can offset ordinary (W-2) income if you actively participate and your MAGI is under $100k (phasing out to $0 by $150k); unused losses carry forward. On sale, claimed depreciation is recaptured at up to 25%, and gains may owe capital-gains tax (a 1031 exchange can defer both). Figures are a year-1 estimate at your 24.0% rate — not tax advice; consult a CPA.
Schools (NCES district)
- District
- Margaretville Central School District
- NCES district ID
- 3618510
- Math proficiency
- 30% ▬ 0.00%
- Reading proficiency
- 25% ▼ -5.00%
- Median HH income
- $42,369
- Composite
- 26.35/100
- National rank
- #12675
- State rank
- #734 of 755 in NY
Livability — Margaretville
- Score
- 65/100
- State rank
- #711
- US rank
- #13534
Category grades
Schools grade is shown separately in the Schools card above.
Census & demographics
- Population (ZIP)
- 1,859
Population outlook (Delaware County) Hauer SSP2
- Today (2025)
- 42,668 people
- By 2030
- 40,337 · -5.5%
- By 2040
- 35,514 · -16.8%
- By 2050
- 31,265 · -26.7%
- By 2075
- 24,455 · -42.7%
- By 2100
- 19,529 · -54.2%
Race, ethnicity, and origin ACS 2023
- Neighborhood character
- Predominantly White (74%)
- Race & ethnicity
- White 74% Hispanic / Latino 21% Two or more races 11%
- Hispanic origin (detail)
- Puerto Rican 1% Dominican 2%
- Common ancestry
- Romanian 5% Iranian 3% Slovak 3%
- Foreign-born
- 21% · Canada, South Korea
- Languages at home
- 77% English-only · Spanish 12% Russian/Polish/Slavic 2% Other Indo-European 2%
Political lean MEDSL · Delaware
- 2024 margin
- R (+19.8) · D 40.1% · R 59.9%
- 2008→2024 swing
- -14.6pp toward R · 2008: -5.2pp · 2024: -19.8pp
- All cycles
- 2024: R+19.8 2020: R+18.4 2016: R+29.2 2012: R+9.6 2008: R+5.2
Not yet ingested
- Civics
- —
Market trends
- HPI YoY
- ▲ 4.36%
- Current HPI
- 355.7672
- Rent YoY
- —
- Metro
- —
- State GDP YoY
- ▲ 2.60%
- F500 in state
- 92
Industry mix (Fortune 500 HQ in NY)
| Industry | F500 HQs | Revenue |
|---|---|---|
| Financial Services | 10 | $950B |
|
||
| Consumer Goods | 9 | $162B |
|
||
| Insurance | 4 | $225B |
|
||
| Telecommunications | 2 | $144B |
|
||
| Pharmaceuticals | 2 | $112B |
|
||
| Media / Entertainment | 2 | $69B |
|
||
Price history
1 event — show timeline
- 2026-01-22 Listed $199,900 ForSaleByOwner.com
Property tax history
+2.2%/yrLatest (2025): $2,367 · +1.2% YoY. Source: county tax records.
Cash-flow waterfall
monthlySold comps — $/sqft
last 12 mo · ≤1 miLoading sold comps…