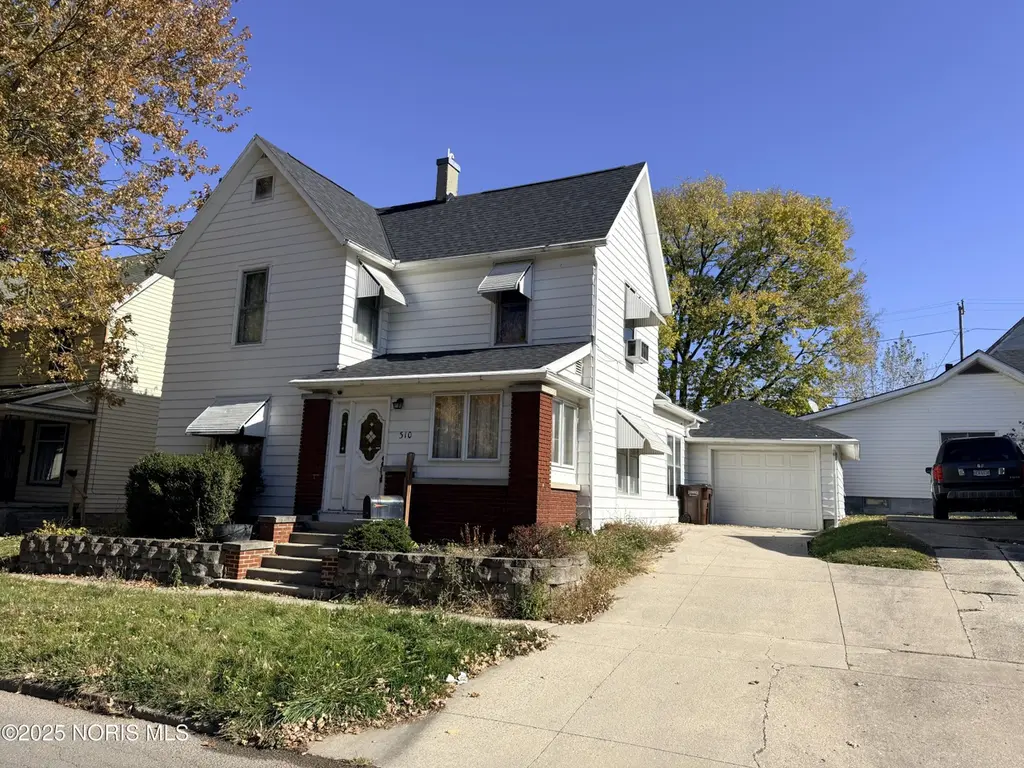
310 N Market St · Kenton, OH
Flood risk 1/10 · Minimal
- FEMA flood zone
- X
- Chance of flooding over 30 yrs
- 0.0%
- Est. flood insurance / yr
- $473 – $860
Fire risk 1/10 · Minimal
- Est. fire insurance / yr
- $713 – $1,323
Heat risk 3/10 · Minor
- Hot days now (above 100°F)
- 7 days/yr
- Hot days in 30 yrs
- 18 days/yr
Wind risk 2/10 · Minimal
- Chance of severe wind over 30 yrs
- —
Air-quality risk 2/10 · Minimal
- Unhealthy air days now
- 1 days/yr
- Unhealthy air days in 30 yrs
- 2 days/yr
Risk factors via First Street. Map © Google.
Why this score? — see what drove the B grade
The composite is a weighted blend of 9 inputs, each scored 0–100. Each bar is that input's sub-score; the figure is the points it added to the 100-point composite (weight × sub-score).
- Cash flow +30.0/30.0
- 1% rule +10.0/10.0
- DSCR +10.0/10.0
- ARV discount +7.5/15.0
- Schools +4.0/10.0
- Livability +3.7/5.0
- Rent growth +2.5/5.0
- Condition / age +2.5/5.0
- Appreciation +0.0/10.0
$49,900
🖨 Deal sheet 📄 Offer letter ✓ Due diligence
Listing remarks
Spacious and full of potential, this 4-bedroom, 2.5-bath home in Kenton offers over 2,200 square feet of living space — all priced to sell at just $49,900 The main level features a first-floor bedroom, formal living room, and formal dining room, perfect for entertaining. Upstairs, you'll find a huge bonus room that provides endless possibilities for a playroom, office, or additional bedroom. An attached garage adds convenience, and there's plenty of space throughout for your personal touch. With this much square footage at such an incredible value, this home won't last long — schedule your showing today! Home being sold as is. Extensive mold damage throughout, enter at your own
Key facts
- 3,485 sq ft lot
- Garage
- Built 1954
Property features AI
Exterior
- Parking: Attached garage; Driveway; On-street parking; 1.5 garage spaces (total parking 1.5)
- Utilities: Cable connected; Electricity connected (100 Amp service); Natural gas connected; Public water; Public sewer (sanitary sewer); Internet connected
- Home design: Single-family house; Two and one-half levels (3 stories total); Not attached to other structures; No common walls
- Construction: Vinyl siding; Concrete basement; Other foundation
- Exterior features: Shingle roof; City street frontage; Concrete road surface
Interior
- Kitchen: Kitchen on main level
- Bedrooms: Primary bedroom on main level; Three additional bedrooms on upper level; Bonus room on upper level
- Flooring: Carpet; Hardwood
- Bathrooms: Two full bathrooms and one half bathroom (2.5 total)
- Heating & cooling: Forced air heating (natural gas); Central air conditioning
- Interior features: Entrance foyer; Window treatments; Water heater
- Laundry & utility: Laundry in basement
Neighborhood map
What this means for you Summary
Snapshot
- This is a 3-bed/2.5-bath single-family listed at $50k.
Deal economics
- At list price, monthly cash flow is $632 ($8k/yr) — positive.
- The deal already cash-flows at list — no discount required.
- Meets the 1% rule at list price ($1k rent vs $50k).
- Recommended offer: $49k (1.5% below list) — sets the bar for market timing.
- Cap rate 21.5% vs local median 5.1% in Kenton — top-decile yield for the area; either an underpriced asset or a hidden risk that comps aren't pricing in. Stress-test before assuming the spread holds.
Location & tenants
- Location reads 73/100 on livability (#339 in OH) — a middle-class / working-renter tenant base. Strengths: cost of living A+, housing A+, health & safety A+; Watch: schools C-, amenities F, commute F.
- Kenton City (town): math 46% / reading 50% proficiency, ranked #479 of 656 in OH (top 73%) — families likely to look elsewhere, expect single-tenant / working-renter base with shorter leases.
- Market conditions: 53 active listings in the ZIP; 18 units permitted in Hardin County in 2024 (0 in 5+ unit buildings).
Forward outlook
- Local home prices are declining (-3.0%/yr); year-one equity from $345 of loan paydown is wiped out by about $1k of value loss. Plan a longer hold.
- Hardin County population projected at -18% by 2050 — secular population decline; favor cash flow + early exit over multi-decade hold.
- At projected returns (-3.0% appreciation + 3.0% rent growth), your $14k cash investment doubles in ~3 years — after that, you're playing with house money.
Negotiation context
- It's been on market 18 days — a 2% lower offer ($49k) is reasonable based on typical stale-listing flexibility.
Risks & watch-outs
- Watch-outs: property tax is 3.6% of price; built in 1954 — expect roof / HVAC / electrical / plumbing capex.
Questions for the listing agent
- Built in 1954 — when were the roof, HVAC, electrical panel, plumbing, and water heater last replaced?
- Property tax is high relative to price — has the assessment been appealed recently, and will the sale trigger a re-assessment?
- Is there a deadline driving the sale (1031 exchange, divorce, estate, relocation)? That informs how much negotiation room exists.
- What's the average days-on-market for RENTAL listings here right now (not sales)? A rising rental-DOM trend means longer vacancies and softer asking-rent achievability than the comps imply.
- What's the recent tenant-quality profile in this submarket — average credit score on applications, eviction rate, late-payment / NSF rate, and stable-employment percentage? A property-management company in the area should have these aggregated.
- How much new for-sale + rental construction is in the pipeline within 1–3 miles? Heavy new supply typically softens prices + rents 12–24 months out; constrained supply supports both.
Investment metrics
- 1% rule
- 2.70% ✓
- Cap rate
- 21.49%
- Cash-on-cash
- 54.26%
- DSCR
- 3.41
- GRM
- 3.1
CMA / ARV
- ARV (on-the-fly)
- $186,780
- Comps found
- 4
Show comp detail 4 sales within ~0.75 mi
| Address | Dist | Beds/Ba | Sqft | Sold | Price | $/sf | Match |
|---|---|---|---|---|---|---|---|
| 233 N Main St | 0.11mi | 4/3.0 (+1) | 2,966 (+5%) | 1mo | $169,000 | $57 | 79 |
| 618 N N. High St. St | 0.46mi | 4/2.5 (+1) | 2,748 (-3%) | 7mo | $265,000 | $96 | 63 |
| 127 Summit St. St | 0.21mi | 3/1.5 | 2,507 (-11%) | 14mo | $165,000 | $66 | 56 |
| 327 N High St | 0.30mi | 4/1.5 (+1) | 2,584 (-9%) | 18mo | $68,000 | $26 | 48 |
Match score weights: distance 35% · size 25% · config 20% · recency 20%. Top-matched comps best support the ARV.
Projected returns pro-forma
-3.0% appreciation · 3.0% rent growth · sell at horizon
- IRR
- 52.5%
- Equity multiple
- 3.31×
- Total profit
- $32,226
- Equity at exit
- $7,440
- IRR
- 57.8%
- Equity multiple
- 6.74×
- Total profit
- $80,178
- Equity at exit
- $4,314
Cash invested: $13,972 (down + closing). Projections, not guarantees.
Landlord ↔ Tenant lean methodology
- Overall (STATE)
- 73 Landlord-Friendly
- State Ohio
- 73 Landlord-Friendly · R+6
- County
- — inherits STATE
- City
- — inherits STATE
ZIP-level market 43326
- Home prices YoY
- -21.0%
- Active inventory
- 53
- Price-to-rent
- 3.1×
Monthly cashflow live
- Estimated rent
- $1,348 medium interval (Pro) →
- Mortgage (P&I)
- −$262
- Tax from tax record
- −$151 /mo · $1,811/yr
- Insurance
- −$21
- HOA
- −$0
- Vacancy / Maint / Mgmt
- −$283
- Net cashflow
- $632
Break-even live
UW: 25.0% down · 7.5% · 30yr · 1.5% tax · 5.0% vac · 8.0% maint · 8.0% mgmt
Financing live
Cash to close
- Down payment
- $12,475
- Closing costs
- $1,497
- Reserves months
- —
- Total cash needed
- —
Loan-product check · same deal, 3 products live
Conventional
25% down · 7.5% · 30yr
- Down + closing
- —
- Monthly P&I
- —
- Monthly cashflow
- —
- DSCR
- —
- Eligible?
- —
Personal DTI + credit; lowest rate.
DSCR
20% down · 8.5% · 30yr
- Down + closing
- —
- Monthly P&I
- —
- Monthly cashflow
- —
- DSCR
- —
- Eligible?
- —
No personal income docs; deal must DSCR.
Hard money
10% down · 12.0% · 12mo
- Down + closing
- —
- Monthly P&I
- —
- Monthly cashflow
- —
- DSCR
- —
- Eligible?
- —
Short-term bridge; refi at stabilization.
Listing history 18 events
-
2026-06-18days on market $49,900 Active 18 DOM
-
2026-06-17days on market $49,900 Active 17 DOM
-
2026-06-16days on market $49,900 Active 16 DOM
-
2026-06-15days on market $49,900 Active 15 DOM
-
2026-06-13days on market $49,900 Active 13 DOM
-
2026-06-12days on market $49,900 Active 12 DOM
-
2026-06-09days on market $49,900 Active 9 DOM
-
2026-06-08days on market $49,900 Active 8 DOM
-
2026-06-08days on market $49,900 Active 7 DOM
-
2026-06-07days on market $49,900 Active 6 DOM
-
2026-06-04days on market $49,900 Active 3 DOM
-
2026-06-02days on market $49,900 Active 2 DOM
-
2026-05-31remarks 687-char remark
-
2026-05-31pricestatusdays on market $49,900 Active 1 DOM
-
2026-03-05historical Contingent
-
2025-11-22price $114,900
-
2025-11-01$124,900 Active
-
2025-10-28historical $124,900
ⓘ Source: listings_history table (triggers on properties + properties_extension) + one-shot
backfill from property_details.listing_events for pre-trigger history.
Tax reassessment forecast OH · Partial reset (capped growth)
- Current annual tax
- $1,811 · $151/mo
- Projected year-2 tax
- $1,811 · $151/mo
- Expected delta
- $0/yr ($0/mo · 0.0%)
ⓘ Screening estimate from a state-policy table — verify with the county assessor before closing.
Climate risk First Street
- Flood 1/10 Low FEMA zone X · 0% chance over 30 yrs
- Wildfire 1/10 Low
- Heat 3/10 Moderate 7 d/yr ≥100°F today · 18 d/yr by 30 yrs out
- Wind 2/10 Low
- Air quality 2/10 Low 1 unhealthy d/yr today · 2 by 30 yrs out
Nearby sold comps map
Loading sold comps map…
Walkable amenities ~0.75 mi
Loading nearby amenities…
Taxation est. · year 1
- Rental income
- $16,179
- − Mortgage interest
- −$2,795
- − Property taxes
- −$1,811
- − Insurance
- −$250
- − Repairs & maintenance
- −$1,294
- − Management
- −$1,294
- − Depreciation
- −$1,452
- Taxable income
- $7,283
- Est. tax owed @ 24.0%
- −$1,748
- After-tax cash flow
- $5,833/yr
For passive investors: Depreciation is non-cash, so a rental often shows a tax loss while cash-flowing — sheltering income. Rental losses are passive: they offset passive income freely, and up to $25,000/yr can offset ordinary (W-2) income if you actively participate and your MAGI is under $100k (phasing out to $0 by $150k); unused losses carry forward. On sale, claimed depreciation is recaptured at up to 25%, and gains may owe capital-gains tax (a 1031 exchange can defer both). Figures are a year-1 estimate at your 24.0% rate — not tax advice; consult a CPA.
Schools (NCES district)
- District
- Kenton City
- NCES district ID
- 3910025
- Math proficiency
- 46% ▼ -17.00%
- Reading proficiency
- 50% ▼ -9.00%
- Median HH income
- $40,297
- Composite
- 40.19/100
- National rank
- #3786
- State rank
- #479 of 656 in OH
Livability — Kenton
- Score
- 73/100
- State rank
- #339
- US rank
- #5545
Category grades
Schools grade is shown separately in the Schools card above.
Census & demographics
- Census place
- Kenton, OH
- County
- Hardin · 33,287 people
- City population
- 12,594
- Population (ZIP)
- 12,594
- Household income
- $54,325
- Rent vs Own
- Severe rent burden
- 4.8
Population outlook (Hardin County) Hauer SSP2
- Today (2025)
- 31,000 people
- By 2030
- 30,031 · -3.1%
- By 2040
- 27,500 · -11.3%
- By 2050
- 25,265 · -18.5%
- By 2075
- 20,485 · -33.9%
- By 2100
- 16,031 · -48.3%
Race, ethnicity, and origin ACS 2023
- Neighborhood character
- Predominantly White (95%)
- Race & ethnicity
- White 95% Two or more races 3%
- Common ancestry
- Iranian 3% Serbian 1% Italian 1%
- Foreign-born
- 0%
- Languages at home
- 96% English-only · German/W. Germanic 2% Spanish 1%
Political lean MEDSL · Hardin
- 2024 margin
- Solid R (+54.7) · D 22.2% · R 76.9%
- 2008→2024 swing
- -33.8pp toward R · 2008: -20.9pp · 2024: -54.7pp
- All cycles
- 2024: R+54.7 2020: R+52.0 2016: R+47.2 2012: R+23.5 2008: R+20.9
Not yet ingested
- Civics
- —
Market trends
- HPI YoY
- ▼ -56.32%
- Current HPI
- 211.5705
- Rent YoY
- —
- Metro
- —
- State GDP YoY
- ▲ 1.98%
- F500 in state
- 48
Industry mix (Fortune 500 HQ in OH)
| Industry | F500 HQs | Revenue |
|---|---|---|
| Insurance | 3 | $145B |
|
||
| Industrial Machinery | 3 | $49B |
|
||
| Financial Services | 3 | $24B |
|
||
| Consumer Goods | 2 | $93B |
|
||
| Aerospace / Defense | 2 | $47B |
|
||
| Utilities | 2 | $33B |
|
||
Price history
-8.0% since first listed4 events — show timeline
- 2026-03-05 Contingent — NORIS
- 2025-11-22 Price Changed $114,900 NORIS
- 2025-11-01 Listed $124,900 NORIS
- 2025-10-28 Coming Soon $124,900 NORIS
Property tax history
+5.5%/yrLatest (2025): $1,811 · -0.6% YoY. Source: county tax records.
Cash-flow waterfall
monthlySold comps — $/sqft
last 12 mo · ≤1 miLoading sold comps…