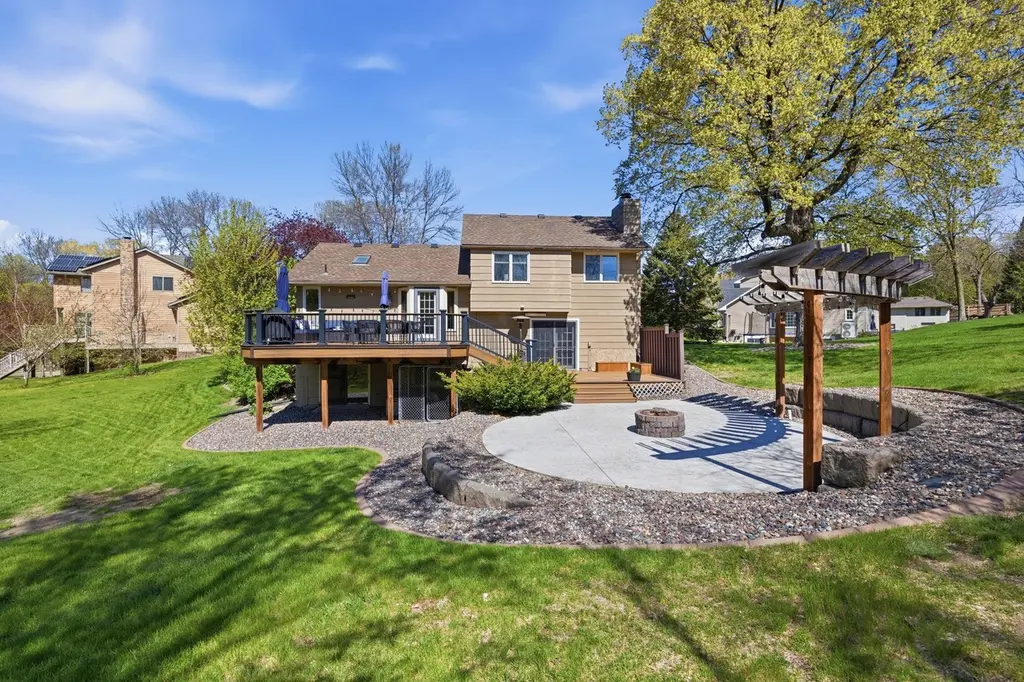
424 Butternut Ln SE · St. Michael, MN
Flood risk 5/10 · Moderate
- FEMA flood zone
- X
- Chance of flooding over 30 yrs
- 0.65%
- Est. flood insurance / yr
- $473 – $860
Fire risk 1/10 · Minimal
- Est. fire insurance / yr
- $888 – $1,650
Heat risk 2/10 · Minimal
- Hot days now (above 98°F)
- 7 days/yr
- Hot days in 30 yrs
- 14 days/yr
Wind risk 2/10 · Minimal
- Chance of severe wind over 30 yrs
- —
Air-quality risk 2/10 · Minimal
- Unhealthy air days now
- 1 days/yr
- Unhealthy air days in 30 yrs
- 2 days/yr
Risk factors via First Street. Map © Google.
Why this score? — see what drove the F grade
The composite is a weighted blend of 9 inputs, each scored 0–100. Each bar is that input's sub-score; the figure is the points it added to the 100-point composite (weight × sub-score).
- ARV discount +8.6/15.0
- Cash flow +6.6/30.0
- Schools +5.8/10.0
- Rent growth +2.5/5.0
- Livability +2.5/5.0
- Condition / age +2.5/5.0
- 1% rule +1.1/10.0
- DSCR +0.9/10.0
- Appreciation +0.0/10.0
$400,000
🖨 Deal sheet (PDF) 📄 Offer letter ✓ Due diligence
Listing remarks MLS
All information is approximate and estimated. Agents & buyers to verify all. Agents please view agent remarks. Nice home, good area, very nice lot but home needs some fix up.
Key facts
- 0.48 acre lot
- 2 garage spots
- Built 1988
Property features AI
Finance
- Financial info: Conventional financing indicated
Exterior
- Parking: Attached garage with garage door opener; 2-car garage (approximately 22.5 x 22.3, ~500 sq ft); Asphalt driveway; RV access/parking
- Utilities: City water (connected); City sewer (connected); Natural gas; Electric service with circuit breakers (Xcel Energy)
- Home design: Residential property; Four-or-more level split; Porch and multiple exterior entries
- Construction: Block foundation; Block basement; Roof replaced/installed within the last 8 years; Built on a foundation area of approximately 1,152
- Exterior features: Composite decking; Decks (main and lower); Front porch; Patio; Wood exterior; Medium tree coverage; Paved city streets with public maintenance
Interior
- Kitchen: Cooktop; Range; Microwave; Dishwasher; Refrigerator; Stainless steel appliances
- Bedrooms: 5 bedrooms total (3 bedrooms on one level); Upper-level bedrooms: two bedrooms (one 15 x 11, one 13 x 9) and one additional bedroom 11 x 9; Lower-level bedrooms: bedroom 4 (11 x 8) and bedroom 5 (11 x 10)
- Flooring: Hardwood floors; Tile floors
- Bathrooms: 2 full bathrooms; One full bath on the upper level and one full bath in the finished basement
- Heating & cooling: Forced air heating; Central air conditioning
- Interior features: Ceiling fans; Vaulted ceiling; Natural woodwork; Kitchen center island; Breakfast bar; Informal dining area; Kitchen window; Hardwood and tile floors; Water softener (owned); Iron filter; Washer/Dryer hookup; Exercise room
- Laundry & utility: Laundry room with washer and dryer hookups; Electric dryer hookup; Gas water heater
Neighborhood map
What this means for you Summary
Snapshot
- This is a 3-bed/2.0-bath single-family listed at $400k.
Deal economics
- At list price, monthly cash flow is $-660 ($-8k/yr) — negative.
- To cash-flow at today's rent, offer at most $283k (29.2% below list).
- To meet the 1% rule (rent ≥ 1% of price), the offer needs to be $246k (38.5% below list).
- Recommended offer: $246k (38.5% below list) — sets the bar for 1% rule.
- Cap rate 4.3% vs local median 3.2% in St. Michael — top-decile yield for the area; either an underpriced asset or a hidden risk that comps aren't pricing in. Stress-test before assuming the spread holds.
Location & tenants
- Location reads: area grade F — affects rentability + tenant quality, not the cash-flow math above.
- St. Michael-Albertville School District (rural): math 62% / reading 66% proficiency, ranked #17 of 301 in MN (top 6%) — acceptable for families but not a draw, mixed tenant base, ~2y average lease; only 9% free/reduced lunch — higher-income household profile.
- Zoned schools: St. Michael Elementary (math 84% / reading 71%, grade A, #21 of 857 statewide, top 3%, 588 students, 23% FRL); St. Michael-Albertville Middle East (math 57% / reading 65%, grade B+, #24 of 258 statewide, top 9%, 892 students, 18% FRL); St. Michael-Albertville Senior High (math 60% / reading 71%, grade B, #27 of 471 statewide, top 6%, 2,240 students, 17% FRL).
- Market conditions: 356 active listings in the ZIP; 5 comparable units currently listed for rent nearby; rentals leasing fast (median 0d on market — plan ~1-2 weeks tenant-placement turnaround); high-income renter base; 1,260 units permitted in Wright County in 2024 (180 in 5+ unit buildings).
Forward outlook
- Local home prices are declining (-3.0%/yr); year-one equity from $3k of loan paydown is wiped out by about $12k of value loss. Plan a longer hold.
- Wright County population projected at +9% by 2050 — modest demand growth; plan on rents tracking national, not racing it.
Negotiation context
- Only 3 days on market — expect competitive offers; lowballing is unlikely to land.
- 4 sale attempts since 25y ago with the ask held roughly flat each time — persistent listings suggest the price (not the market) is what's stuck; bring a comps-based counter.
- Current owner paid $212k; list at $400k implies a 89% gain — meaningful room to come down on a strong offer.
Risks & watch-outs
- Climate carrying-cost: moderate flood risk — expect insurance premiums to compound above CPI over the hold.
Questions for the listing agent
- What do current leases actually rent for vs. the listed asking? Can we see a recent rent roll and the last 12 months of T-12 income?
- Is there a deadline driving the sale (1031 exchange, divorce, estate, relocation)? That informs how much negotiation room exists.
- The area grade is low — what's the realistic commute time and amenity access for the typical tenant pool here? Any planned neighborhood developments (good or bad) we should know about?
- What's the average days-on-market for RENTAL listings here right now (not sales)? A rising rental-DOM trend means longer vacancies and softer asking-rent achievability than the comps imply.
- What's the recent tenant-quality profile in this submarket — average credit score on applications, eviction rate, late-payment / NSF rate, and stable-employment percentage? A property-management company in the area should have these aggregated.
- How much new for-sale + rental construction is in the pipeline within 1–3 miles? Heavy new supply typically softens prices + rents 12–24 months out; constrained supply supports both.
Investment metrics
- 1% rule
- 0.61% ✗
- Cap rate
- 4.31%
- Cash-on-cash
- -7.08%
- DSCR
- 0.69
- GRM
- 13.6
CMA / ARV
- ARV (median comp)
- $410,000
- List price
- $400,000
- Delta
- -2.44%
- Verdict
- FAIR
- Comps
- 3 within 2.0 mi
Projected returns pro-forma
-3.0% appreciation · 3.0% rent growth · sell at horizon
- IRR
- -28.6%
- Equity multiple
- 0.05×
- Total profit
- $-106,945
- Equity at exit
- $59,641
- IRR
- -28.3%
- Equity multiple
- -0.32×
- Total profit
- $-147,544
- Equity at exit
- $34,585
Cash invested: $112,000 (down + closing). Projections, not guarantees.
Landlord ↔ Tenant lean methodology
- Overall (STATE)
- 46 Balanced
- State Minnesota
- 46 Balanced · D+2
- County
- — inherits STATE
- City
- — inherits STATE
ZIP-level market 55376
- Home prices YoY
- -30.4%
- Active inventory
- 356
- Price-to-rent
- 13.6×
Monthly cashflow live
- Estimated rent
- $2,459 high interval (Pro) →
- Mortgage (P&I)
- −$2,098
- Tax from tax record
- −$339 /mo · $4,064/yr
- Insurance
- −$167
- HOA
- −$0
- Vacancy / Maint / Mgmt
- −$516
- Net cashflow
- $-660
Break-even live
Sensitivity live
| Price | -10% $-434 | -5% $-547 | +0% $-660 | +5% $-774 | +10% $-887 |
|---|---|---|---|---|---|
| Rent | -10% $-855 | -5% $-758 | +0% $-660 | +5% $-563 | +10% $-466 |
| Rate | -1.0pp $-459 | -0.5pp $-559 | base $-660 | +0.5pp $-764 | +1.0pp $-870 |
UW: 25.0% down · 7.5% · 30yr · 1.5% tax · 5.0% vac · 8.0% maint · 8.0% mgmt
Financing live
Cash to close
- Down payment
- $100,000
- Closing costs
- $12,000
- Reserves months
- —
- Total cash needed
- —
Loan-product check · same deal, 3 products live
Conventional
25% down · 7.5% · 30yr
- Down + closing
- —
- Monthly P&I
- —
- Monthly cashflow
- —
- DSCR
- —
- Eligible?
- —
Personal DTI + credit; lowest rate.
DSCR
20% down · 8.5% · 30yr
- Down + closing
- —
- Monthly P&I
- —
- Monthly cashflow
- —
- DSCR
- —
- Eligible?
- —
No personal income docs; deal must DSCR.
Hard money
10% down · 12.0% · 12mo
- Down + closing
- —
- Monthly P&I
- —
- Monthly cashflow
- —
- DSCR
- —
- Eligible?
- —
Short-term bridge; refi at stabilization.
Rent comps 5 comps
| Address | Beds | Baths | Sqft | Rent | $/sqft | DOM | Units | Dist |
|---|---|---|---|---|---|---|---|---|
| 4165 Orleans Dr NE Saint Michael, MN | 2.0 | 1.5 | 1548 | $1,800 | $1.16 | 6d | 1 | 0.59mi |
| 2948 Kepler Ave NE Saint Michael, MN | 3.0 | 2.5 | 2400 | $2,800 | $1.17 | 0d | 1 | 0.92mi |
| 11811 Frankfort Pkwy NE Saint Michael, MN | 3.0 | 1.0–2.0 | 1017 | $2,500 | $2.46 | 0d | 13 | 0.92mi |
| 433 1st St NW Saint Michael, MN | 4.0 | 2.0 | 1830 | $2,669 | $1.46 | 5d | 1 | 1.12mi |
| 5055 Lander Ave NE Albertville, MN | 2.0–5.0 | 2.0–3.5 | 2067 | $3,269 | $1.58 | 0d | 7 | 1.48mi |
Listing history 13 events
-
2026-05-17historical Contingent - Inspection
-
2026-05-15$400,000 Active
-
2026-05-10historical
-
2007-07-20soldstatus $212,000 178-char remark
Show marketing remark (178 chars)
All information is approximate and estimated. Agents & buyers to verify all. Agents please view agent remarks. Nice home, good area, very nice lot but home needs some fix up.
-
2007-06-21historical 178-char remark
Show marketing remark (178 chars)
All information is approximate and estimated. Agents & buyers to verify all. Agents please view agent remarks. Nice home, good area, very nice lot but home needs some fix up.
-
2007-05-17$219,900 178-char remark
Show marketing remark (178 chars)
All information is approximate and estimated. Agents & buyers to verify all. Agents please view agent remarks. Nice home, good area, very nice lot but home needs some fix up.
-
2006-12-06historical
-
2006-06-13$268,000
-
2002-04-08soldstatus $205,000
-
2002-03-29soldstatus $205,000
-
2002-02-28historical
-
2001-09-10$229,500
-
2001-09-07soldstatus $195,000
ⓘ Source: listings_history table (triggers on properties + properties_extension) + one-shot
backfill from property_details.listing_events for pre-trigger history.
Tax reassessment forecast MN · Partial reset (capped growth)
- Current annual tax
- $4,064 · $339/mo
- Projected year-2 tax
- $4,272 · $356/mo
- Expected delta
- +$208/yr (+$17/mo · 5.1%)
ⓘ Screening estimate from a state-policy table — verify with the county assessor before closing.
Climate risk First Street
- Flood 5/10 Major FEMA zone X · 65% chance over 30 yrs
- Wildfire 1/10 Low
- Heat 2/10 Low 7 d/yr ≥98°F today · 14 d/yr by 30 yrs out
- Wind 2/10 Low
- Air quality 2/10 Low 1 unhealthy d/yr today · 2 by 30 yrs out
Nearby sold comps map
Loading sold comps map…
Walkable amenities ~0.75 mi
Loading nearby amenities…
Taxation est. · year 1
- Rental income
- $29,506
- − Mortgage interest
- −$22,406
- − Property taxes
- −$4,064
- − Insurance
- −$2,000
- − Repairs & maintenance
- −$2,361
- − Management
- −$2,361
- − Depreciation
- −$11,636
- Taxable loss
- −$15,321
- Est. tax savings @ 24.0%
- +$3,677
- After-tax cash flow
- $-4,249/yr
For passive investors: Depreciation is non-cash, so a rental often shows a tax loss while cash-flowing — sheltering income. Rental losses are passive: they offset passive income freely, and up to $25,000/yr can offset ordinary (W-2) income if you actively participate and your MAGI is under $100k (phasing out to $0 by $150k); unused losses carry forward. On sale, claimed depreciation is recaptured at up to 25%, and gains may owe capital-gains tax (a 1031 exchange can defer both). Figures are a year-1 estimate at your 24.0% rate — not tax advice; consult a CPA.
Schools (NCES district)
- District
- St. Michael-Albertville School District
- NCES district ID
- 2733790
- Math proficiency
- 62% ▼ -13.00%
- Reading proficiency
- 66% ▼ -10.00%
- Median HH income
- $86,897
- Composite
- 57.91/100
- National rank
- #1042
- State rank
- #17 of 301 in MN
Livability — St. Michael
No livability data for this city. (Only ~50 U.S. cities are tracked.)
Census & demographics
- Census place
- St. Michael, MN
- County
- Wright County · 79,164 people
- City population
- 19,317
- Metro
- Minneapolis-St. Paul-Bloomington, MN-WI
- Population (ZIP)
- 20,106
- Household income
- $131,266
- Rent vs Own
- Severe rent burden
- 132.0
Population outlook (Wright County) Hauer SSP2
- Today (2025)
- 142,526 people
- By 2030
- 146,915 · +3.1%
- By 2040
- 153,625 · +7.8%
- By 2050
- 155,416 · +9.0%
- By 2075
- 150,352 · +5.5%
- By 2100
- 130,631 · -8.3%
Race, ethnicity, and origin ACS 2023
- Neighborhood character
- Predominantly White (87%)
- Race & ethnicity
- White 87% Black 4% Two or more races 4% Hispanic / Latino 3% Asian 3%
- Common ancestry
- Portuguese 13% Romanian 5% Lithuanian 4%
- Foreign-born
- 4% · Canada, South Korea, Vietnam
- Languages at home
- 95% English-only · Spanish 2% Other Asian/Pacific 1% German/W. Germanic 1%
Political lean MEDSL · Wright
- 2024 margin
- Strong R (+29.4) · D 34.4% · R 63.8% · Other 1.8%
- 2008→2024 swing
- -11.9pp toward R · 2008: -17.4pp · 2024: -29.4pp
- All cycles
- 2024: R+29.4 2020: R+28.6 2016: R+33.2 2012: R+21.4 2008: R+17.4
Not yet ingested
- Civics
- —
Market trends
- HPI YoY
- ▼ -100.03%
- Current HPI
- 229.5977
- Rent YoY
- —
- Metro
- Minneapolis-St. Paul-Bloomington, MN-WI
- State GDP YoY
- ▲ 2.41%
- F500 in state
- 34
Industry mix (Fortune 500 HQ in MN)
| Industry | F500 HQs | Revenue |
|---|---|---|
| Healthcare | 2 | $407B |
|
||
| Retail | 2 | $150B |
|
||
| Consumer Goods | 2 | $32B |
|
||
| Industrial Machinery | 2 | $6B |
|
||
| Agriculture | 1 | $40B |
|
||
| Healthcare / Medical Devices | 1 | $32B |
|
||
Price history
+105.1% since first listed14 events — show timeline
- 2026-05-22 Pending — NORTHSTARMLS as Distributed by MLS Grid
- 2026-05-17 Contingent — NORTHSTARMLS as Distributed by MLS Grid
- 2026-05-15 Listed $400,000 NORTHSTARMLS as Distributed by MLS Grid
- 2026-05-10 Coming Soon $400,000 NORTHSTARMLS as Distributed by MLS Grid
- 2007-07-20 Sold (MLS) $212,000 NORTHSTARMLS as Distributed by MLS Grid
- 2007-06-21 Listing Removed — NORTHSTARMLS as Distributed by MLS Grid
- 2007-05-17 Listed $219,900 NORTHSTARMLS as Distributed by MLS Grid
- 2006-12-06 Listing Removed — NORTHSTARMLS as Distributed by MLS Grid
- 2006-06-13 Listed $268,000 NORTHSTARMLS as Distributed by MLS Grid
- 2002-04-08 Sold (Public Records) $205,000 Public Records
- 2002-03-29 Sold (MLS) $205,000 NORTHSTARMLS as Distributed by MLS Grid
- 2002-02-28 Listing Removed — NORTHSTARMLS as Distributed by MLS Grid
- 2001-09-10 Listed $229,500 NORTHSTARMLS as Distributed by MLS Grid
- 2001-09-07 Sold (Public Records) $195,000 Public Records
Property tax history
+3.4%/yrLatest (2025): $4,064 · +6.8% YoY. Source: county tax records.
Cash-flow waterfall
monthlySold comps — $/sqft
last 12 mo · ≤1 miLoading sold comps…