142 Roadrunner Dr · Sam Rayburn, TX
Flood risk No data
- FEMA flood zone
- —
- Chance of flooding over 30 yrs
- —
- Est. flood insurance / yr
- —
Fire risk No data
- Est. fire insurance / yr
- —
Heat risk No data
- Hot days now (above threshold)
- —
- Hot days in 30 yrs
- —
Wind risk No data
- Chance of severe wind over 30 yrs
- —
Air-quality risk No data
- Unhealthy air days now
- —
- Unhealthy air days in 30 yrs
- —
Risk factors via First Street. Map © Google.
Why this score? — see what drove the A- grade
The composite is a weighted blend of 9 inputs, each scored 0–100. Each bar is that input's sub-score; the figure is the points it added to the 100-point composite (weight × sub-score).
- Cash flow +28.9/30.0
- ARV discount +15.0/15.0
- DSCR +10.0/10.0
- 1% rule +8.5/10.0
- Appreciation +5.6/10.0
- Schools +4.3/10.0
- Livability +3.3/5.0
- Rent growth +2.5/5.0
- Condition / age +2.5/5.0
$65,000
🖨 Deal sheet 📄 Offer letter ✓ Due diligence
Listing remarks MLS
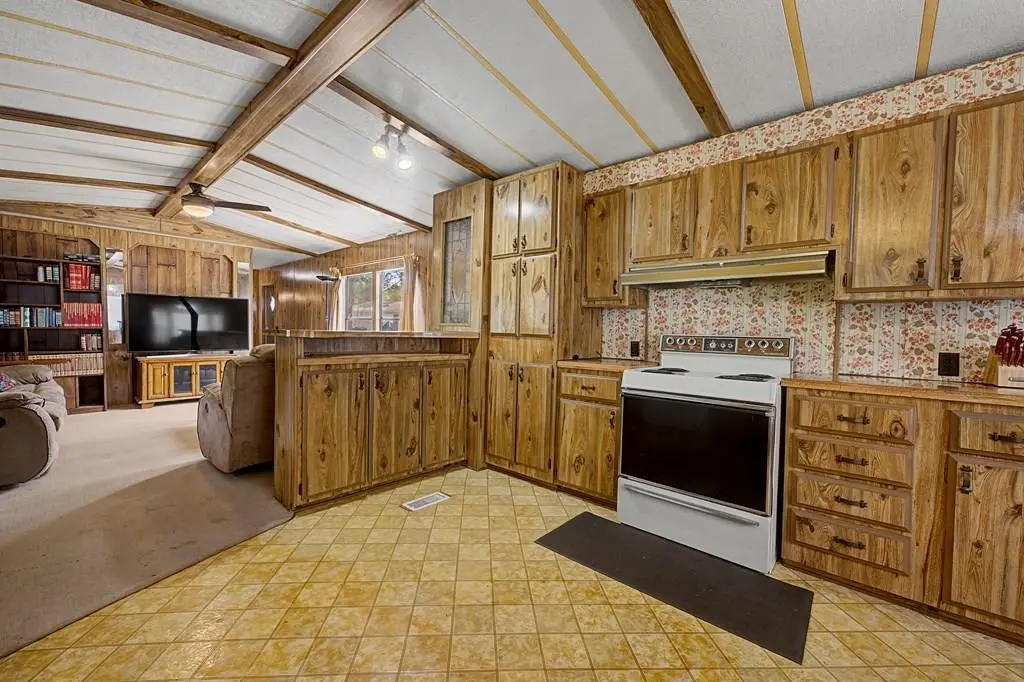
Whether you're searching for a weekend lake camp or a full-time getaway, this 2-bedroom, 2-bath mobile home in Audubon Hills of Rayburn Country is ready for its next owner. Designed for easy lake living, the property features a 2-car carport, a spacious screened porch for relaxing or entertaining, a new roof installed in 2020, and all new plumbing. Conveniently located near area boat ramps, Umphrey Pavilion, Rayburn Resort, and the marina, this property offers quick access to some of the best recreation, dining, and entertainment Lake Sam Rayburn has to offer.
Key facts
- New plumbing
- Near boat ramps
- Screened porch
Tags
Neighborhood map
What this means for you Summary
Snapshot
- This is a 2-bed/2.0-bath manufactured listed at $65k.
Deal economics
- At list price, monthly cash flow is $221 ($3k/yr) — positive.
- The deal already cash-flows at list — no discount required.
- Meets the 1% rule at list price ($874 rent vs $65k).
- Recommended offer: $61k (6.0% below list) — sets the bar for market timing.
- Cap rate 10.4% vs local median 1.5% in Sam Rayburn — top-decile yield for the area; either an underpriced asset or a hidden risk that comps aren't pricing in. Stress-test before assuming the spread holds.
Location & tenants
- Location reads 66/100 on livability (#606 in TX) — a middle-class / working-renter tenant base. Strengths: crime A+, employment A+, cost of living A+; Watch: schools D+, amenities F, commute F.
- Brookeland ISD (rural): math 43% / reading 53% proficiency, ranked #445 of 1,141 in TX (top 39%) — families likely to look elsewhere, expect single-tenant / working-renter base with shorter leases.
- Market conditions: 419 active listings in the ZIP; 45 units permitted in Jasper County in 2024 (0 in 5+ unit buildings).
Forward outlook
- In year one you build about $1k of equity ($449 loan paydown + $830 appreciation (1.3% local appreciation)).
- Jasper County population projected at -15% by 2050 — secular population decline; favor cash flow + early exit over multi-decade hold.
- At projected returns (1.3% appreciation + 3.0% rent growth), your $18k cash investment doubles in ~5 years — after that, you're playing with house money.
Negotiation context
- It's been on market 80 days — a 6% lower offer ($61k) is reasonable based on typical stale-listing flexibility.
- 2 sale attempts since 9y ago; this cycle's ask has dropped $10k (13%) from the opening price — seller is motivated, your offer sets the floor, not the list.
Questions for the listing agent
- It's been on market 80 days. Have you received any prior offers? Is the seller open to a 6% concession, seller financing, or rate buy-down credit?
- What does the HOA fee cover, when was the last increase, and are there any pending special assessments or reserve-fund shortfalls?
- Why hasn't it sold? Are there any deal-killer items the seller is aware of (foundation, flood, title, zoning, code violations)?
- Is there a deadline driving the sale (1031 exchange, divorce, estate, relocation)? That informs how much negotiation room exists.
- Schools are D-rated, which usually means shorter tenancies and higher turnover. Who's the typical renter profile here, and what's been the actual vacancy rate?
- What's the average days-on-market for RENTAL listings here right now (not sales)? A rising rental-DOM trend means longer vacancies and softer asking-rent achievability than the comps imply.
- What's the recent tenant-quality profile in this submarket — average credit score on applications, eviction rate, late-payment / NSF rate, and stable-employment percentage? A property-management company in the area should have these aggregated.
- How much new for-sale + rental construction is in the pipeline within 1–3 miles? Heavy new supply typically softens prices + rents 12–24 months out; constrained supply supports both.
Investment metrics
- 1% rule
- 1.35% ✓
- Cap rate
- 10.38%
- Cash-on-cash
- 14.58%
- DSCR
- 1.65
- GRM
- 6.2
CMA / ARV
- ARV (median comp)
- $110,942
- List price
- $65,000
- Delta
- -41.41%
- Verdict
- UNDERPRICED
- Comps
- 2 within 1.0 mi
Show comp detail 1 sale within ~0.75 mi
| Address | Dist | Beds/Ba | Sqft | Sold | Price | $/sf | Match |
|---|---|---|---|---|---|---|---|
| 130 Bluejay Dr | 0.10mi | 2/2.0 | 840 (-9%) | 3mo | $129,900 | $155 | 78 |
Match score weights: distance 35% · size 25% · config 20% · recency 20%. Top-matched comps best support the ARV.
Projected returns pro-forma
1.28% appreciation · 3.0% rent growth · sell at horizon
- IRR
- 17.2%
- Equity multiple
- 1.89×
- Total profit
- $16,214
- Equity at exit
- $23,132
- IRR
- 20.2%
- Equity multiple
- 3.51×
- Total profit
- $45,672
- Equity at exit
- $31,483
Cash invested: $18,200 (down + closing). Projections, not guarantees.
Landlord ↔ Tenant lean methodology
- Overall (STATE)
- 87 Strongly Landlord-Friendly
- State Texas
- 87 Strongly Landlord-Friendly · R+5
- County
- — inherits STATE
- City
- — inherits STATE
ZIP-level market 75931
- Home prices YoY
- 0.6%
- Active inventory
- 419
- Price-to-rent
- 6.2×
Monthly cashflow live
- Estimated rent
- $874 medium interval (Pro) →
- Mortgage (P&I)
- −$341
- Tax from tax record
- −$67 /mo · $799/yr
- Insurance
- −$27
- HOA
- −$35
- Vacancy / Maint / Mgmt
- −$184
- Net cashflow
- $221
Break-even live
UW: 25.0% down · 7.5% · 30yr · 1.5% tax · 5.0% vac · 8.0% maint · 8.0% mgmt
Financing live
Cash to close
- Down payment
- $16,250
- Closing costs
- $1,950
- Reserves months
- —
- Total cash needed
- —
Loan-product check · same deal, 3 products live
Conventional
25% down · 7.5% · 30yr
- Down + closing
- —
- Monthly P&I
- —
- Monthly cashflow
- —
- DSCR
- —
- Eligible?
- —
Personal DTI + credit; lowest rate.
DSCR
20% down · 8.5% · 30yr
- Down + closing
- —
- Monthly P&I
- —
- Monthly cashflow
- —
- DSCR
- —
- Eligible?
- —
No personal income docs; deal must DSCR.
Hard money
10% down · 12.0% · 12mo
- Down + closing
- —
- Monthly P&I
- —
- Monthly cashflow
- —
- DSCR
- —
- Eligible?
- —
Short-term bridge; refi at stabilization.
HOA detail
- Monthly dues
- $35 · $420/yr
Listing history 19 events
-
2026-06-18days on market $65,000 Active 80 DOM
-
2026-06-17days on market $65,000 Active 79 DOM
-
2026-06-16days on market $65,000 Active 78 DOM
-
2026-06-15days on market $65,000 Active 77 DOM
-
2026-06-13days on market $65,000 Active 75 DOM
-
2026-06-12days on market $65,000 Active 74 DOM
-
2026-06-09days on market $65,000 Active 71 DOM
-
2026-06-08days on market $65,000 Active 70 DOM
-
2026-06-08days on market $65,000 Active 69 DOM
-
2026-06-07pricedays on market $65,000 Active 68 DOM
-
2026-06-03days on market $70,000 Active 65 DOM
-
2026-06-02days on market $70,000 Active 64 DOM
-
2026-06-01days on market $70,000 Active 63 DOM
-
2026-05-31days on market $70,000 Active 62 DOM
-
2026-04-28price $70,000 566-char remark
Show marketing remark (566 chars)
Whether you're searching for a weekend lake camp or a full-time getaway, this 2-bedroom, 2-bath mobile home in Audubon Hills of Rayburn Country is ready for its next owner. Designed for easy lake living, the property features a 2-car carport, a spacious screened porch for relaxing or entertaining, a new roof installed in 2020, and all new plumbing. Conveniently located near area boat ramps, Umphrey Pavilion, Rayburn Resort, and the marina, this property offers quick access to some of the best recreation, dining, and entertainment Lake Sam Rayburn has to offer.
-
2026-03-30$75,000 Active 566-char remark
Show marketing remark (566 chars)
Whether you're searching for a weekend lake camp or a full-time getaway, this 2-bedroom, 2-bath mobile home in Audubon Hills of Rayburn Country is ready for its next owner. Designed for easy lake living, the property features a 2-car carport, a spacious screened porch for relaxing or entertaining, a new roof installed in 2020, and all new plumbing. Conveniently located near area boat ramps, Umphrey Pavilion, Rayburn Resort, and the marina, this property offers quick access to some of the best recreation, dining, and entertainment Lake Sam Rayburn has to offer.
-
2018-05-25soldstatus
-
2018-03-26historical
-
2017-09-26$49,900
ⓘ Source: listings_history table (triggers on properties + properties_extension) + one-shot
backfill from property_details.listing_events for pre-trigger history.
Tax reassessment forecast TX · Resets to sale price
- Current annual tax
- $799 · $67/mo
- Projected year-2 tax
- $1,190 · $99/mo
- Expected delta
- +$391/yr (+$33/mo · 48.9%)
ⓘ Screening estimate from a state-policy table — verify with the county assessor before closing.
Nearby sold comps map
Loading sold comps map…
Walkable amenities ~0.75 mi
Loading nearby amenities…
Taxation est. · year 1
- Rental income
- $10,492
- − Mortgage interest
- −$3,641
- − Property taxes
- −$799
- − Insurance
- −$325
- − Repairs & maintenance
- −$839
- − Management
- −$839
- − HOA
- −$420
- − Depreciation
- −$1,891
- Taxable income
- $1,737
- Est. tax owed @ 24.0%
- −$417
- After-tax cash flow
- $2,237/yr
For passive investors: Depreciation is non-cash, so a rental often shows a tax loss while cash-flowing — sheltering income. Rental losses are passive: they offset passive income freely, and up to $25,000/yr can offset ordinary (W-2) income if you actively participate and your MAGI is under $100k (phasing out to $0 by $150k); unused losses carry forward. On sale, claimed depreciation is recaptured at up to 25%, and gains may owe capital-gains tax (a 1031 exchange can defer both). Figures are a year-1 estimate at your 24.0% rate — not tax advice; consult a CPA.
Schools (NCES district)
- District
- Brookeland ISD
- NCES district ID
- 4811520
- Math proficiency
- 43% ▼ -1.00%
- Reading proficiency
- 53% ▼ -1.00%
- Median HH income
- $45,145
- Composite
- 42.74/100
- National rank
- #6781
- State rank
- #445 of 1141 in TX
Livability — Sam Rayburn
- Score
- 66/100
- State rank
- #606
- US rank
- #11495
Category grades
Schools grade is shown separately in the Schools card above.
Census & demographics
- Census place
- Sam Rayburn, TX
- Population (ZIP)
- 2,209
Population outlook (Jasper County) Hauer SSP2
- Today (2025)
- 33,986 people
- By 2030
- 32,965 · -3.0%
- By 2040
- 30,908 · -9.1%
- By 2050
- 28,893 · -15.0%
- By 2075
- 24,828 · -26.9%
- By 2100
- 19,987 · -41.2%
Race, ethnicity, and origin ACS 2023
- Neighborhood character
- Predominantly White (93%)
- Race & ethnicity
- White 93% Two or more races 4% Hispanic / Latino 3% Black 1%
- Common ancestry
- Italian 4% Lithuanian 2% Romanian 1%
- Foreign-born
- 2%
- Languages at home
- 97% English-only · German/W. Germanic 2% Other Indo-European 1%
Political lean MEDSL · Jasper
- 2024 margin
- Solid R (+66.6) · D 16.5% · R 83.1%
- 2008→2024 swing
- -24.6pp toward R · 2008: -42.0pp · 2024: -66.6pp
- All cycles
- 2024: R+66.6 2020: R+61.4 2016: R+59.9 2012: R+48.4 2008: R+42.0
Not yet ingested
- Civics
- —
Market trends
- HPI YoY
- ▲ 1.28%
- Current HPI
- 231.9835
- Rent YoY
- —
- Metro
- —
- State GDP YoY
- ▲ 3.95%
- F500 in state
- 110
Industry mix (Fortune 500 HQ in TX)
| Industry | F500 HQs | Revenue |
|---|---|---|
| Energy | 16 | $1,198B |
|
||
| Technology | 5 | $198B |
|
||
| Engineering / Construction | 4 | $72B |
|
||
| Energy Services | 3 | $60B |
|
||
| Utilities | 3 | $41B |
|
||
| Healthcare | 2 | $330B |
|
||
Price history
+40.3% since first listed5 events — show timeline
- 2026-04-28 Price Changed $70,000 Deep East Texas MLS
- 2026-03-30 Listed $75,000 Deep East Texas MLS
- 2018-05-25 Sold (Public Records) — Public Records
- 2018-03-26 Listing Removed — HARMLS
- 2017-09-26 Listed $49,900 HARMLS
Property tax history
+3.9%/yrLatest (2025): $799 · -6.3% YoY. Source: county tax records.
Cash-flow waterfall
monthlySold comps — $/sqft
last 12 mo · ≤1 miLoading sold comps…