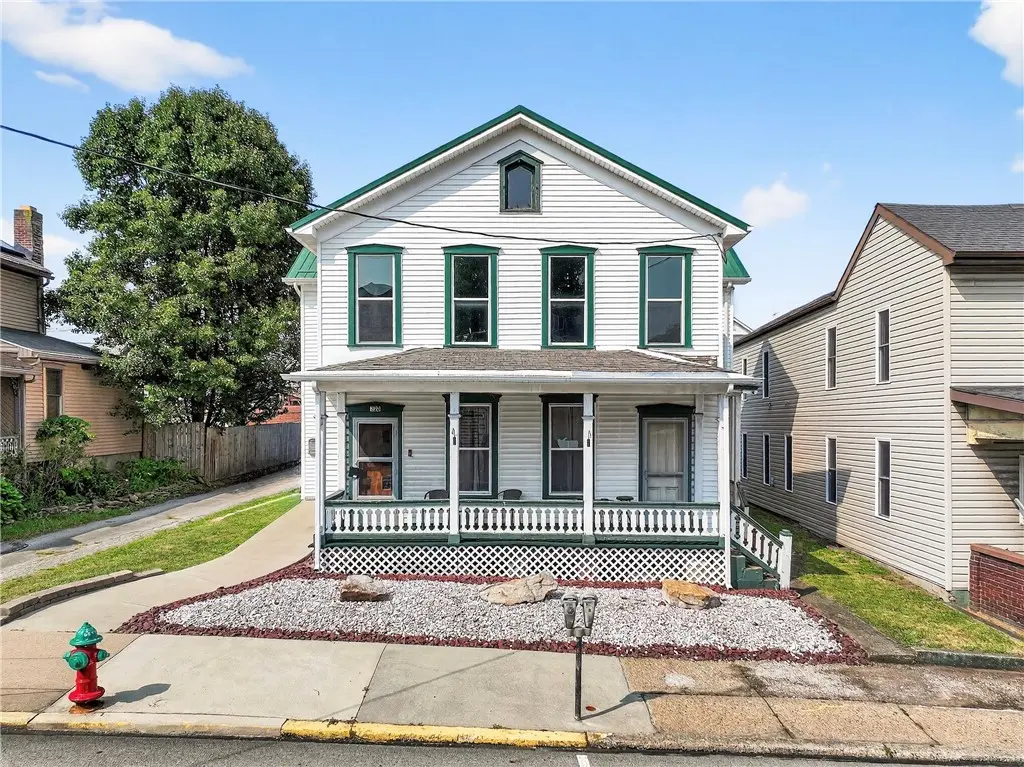
320 W Main St · Mount Pleasant, PA
Flood risk 1/10 · Minimal
- FEMA flood zone
- X (unshaded)
- Chance of flooding over 30 yrs
- 0.0%
- Est. flood insurance / yr
- $507 – $1,088
Fire risk 1/10 · Minimal
- Est. fire insurance / yr
- $511 – $949
Heat risk 4/10 · Minor
- Hot days now (above 95°F)
- 7 days/yr
- Hot days in 30 yrs
- 19 days/yr
Wind risk 2/10 · Minimal
- Chance of severe wind over 30 yrs
- —
Air-quality risk 2/10 · Minimal
- Unhealthy air days now
- 0 days/yr
- Unhealthy air days in 30 yrs
- 1 days/yr
Risk factors via First Street. Map © Google.
Why this score? — see what drove the D+ grade
The composite is a weighted blend of 9 inputs, each scored 0–100. Each bar is that input's sub-score; the figure is the points it added to the 100-point composite (weight × sub-score).
- Cash flow +11.4/30.0
- Appreciation +8.6/10.0
- ARV discount +7.5/15.0
- 1% rule +3.7/10.0
- Livability +3.6/5.0
- DSCR +3.3/10.0
- Schools +3.2/10.0
- Rent growth +2.5/5.0
- Condition / age +2.5/5.0
$90,000
🖨 Deal sheet (PDF) 📄 Offer letter ✓ Due diligence
Listing remarks MLS
Sitting in a prime location, this property features two established commercial spaces on the main level that both offer immediate cash flow. The upstairs has great potential for a third unit. This is a fantastic opportunity for investors seeking an income producing property.
Key facts
- Immediate cash flow
- 5,998 sq ft lot
- Garage
Tags
Neighborhood map
What this means for you Summary
Snapshot
- This is a other listed at $90k.
Deal economics
- At list price, monthly cash flow is $-32 ($-383/yr) — negative.
- To cash-flow at today's rent, offer at most $84k (6.3% below list).
- To meet the 1% rule (rent ≥ 1% of price), the offer needs to be $78k (12.9% below list).
- Recommended offer: $78k (12.9% below list) — sets the bar for 1% rule.
- Cap rate 5.9% vs local median 2.8% in Mount Pleasant — top-decile yield for the area; either an underpriced asset or a hidden risk that comps aren't pricing in. Stress-test before assuming the spread holds.
Location & tenants
- Location reads 72/100 on livability (#647 in PA) — a middle-class / working-renter tenant base. Strengths: crime A+, cost of living A+, housing A+; Watch: amenities F, commute F, employment F.
- Mount Pleasant Area SD (suburban): math 25% / reading 51% proficiency, ranked #378 of 539 in PA (top 70%) — families likely to look elsewhere, expect single-tenant / working-renter base with shorter leases.
- Zoned schools: Mount Pleasant Area Hs (math 42%, 594 students, 28% FRL).
- Market conditions: 55 active listings in the ZIP; 5 comparable units currently listed for rent nearby; rentals at typical pace (median 26d on market — plan ~3-4 weeks tenant-placement turnaround); 415 units permitted in Westmoreland County in 2024 (10 in 5+ unit buildings).
Forward outlook
- In year one you build about $7k of equity ($622 loan paydown + $6k appreciation (7.2% local appreciation)).
- Westmoreland County population projected at -19% by 2050 — secular population decline; favor cash flow + early exit over multi-decade hold.
- At projected returns (7.2% appreciation + 3.0% rent growth), your $25k cash investment doubles in ~4 years — after that, you're playing with house money.
- By year 5, paydown + projected appreciation supports a ~$32k cash-out refi (75% LTV) — recoverable capital for the next deal without selling this one.
Negotiation context
- It's been on market 269 days — a 12% lower offer ($79k) is reasonable based on typical stale-listing flexibility.
- 3 sale attempts since 17y ago; this cycle's ask has dropped $10k (10%) from the opening price — seller is motivated, your offer sets the floor, not the list.
- Current owner paid $20k; list at $90k implies a 350% gain — meaningful room to come down on a strong offer.
Questions for the listing agent
- What do current leases actually rent for vs. the listed asking? Can we see a recent rent roll and the last 12 months of T-12 income?
- It's been on market 269 days. Have you received any prior offers? Is the seller open to a 13% concession, seller financing, or rate buy-down credit?
- Why hasn't it sold? Are there any deal-killer items the seller is aware of (foundation, flood, title, zoning, code violations)?
- Is there a deadline driving the sale (1031 exchange, divorce, estate, relocation)? That informs how much negotiation room exists.
- The area grade is low — what's the realistic commute time and amenity access for the typical tenant pool here? Any planned neighborhood developments (good or bad) we should know about?
- What's the average days-on-market for RENTAL listings here right now (not sales)? A rising rental-DOM trend means longer vacancies and softer asking-rent achievability than the comps imply.
- What's the recent tenant-quality profile in this submarket — average credit score on applications, eviction rate, late-payment / NSF rate, and stable-employment percentage? A property-management company in the area should have these aggregated.
- How much new for-sale + rental construction is in the pipeline within 1–3 miles? Heavy new supply typically softens prices + rents 12–24 months out; constrained supply supports both.
Investment metrics
- 1% rule
- 0.87% ✗
- Cap rate
- 5.87%
- Cash-on-cash
- -1.52%
- DSCR
- 0.93
- GRM
- 9.6
CMA / ARV
No comps found within radius.
Projected returns pro-forma
7.2% appreciation · 3.0% rent growth · sell at horizon
- IRR
- 17.0%
- Equity multiple
- 2.21×
- Total profit
- $30,517
- Equity at exit
- $63,533
- IRR
- 16.5%
- Equity multiple
- 4.58×
- Total profit
- $90,189
- Equity at exit
- $121,754
Cash invested: $25,200 (down + closing). Projections, not guarantees.
Landlord ↔ Tenant lean methodology
- Overall (STATE)
- 62 Landlord-Friendly
- State Pennsylvania
- 62 Landlord-Friendly · EVEN
- County
- — inherits STATE
- City
- — inherits STATE
ZIP-level market 15666
- Home prices YoY
- 3.3%
- Active inventory
- 55
- Price-to-rent
- 9.6×
Monthly cashflow live
- Estimated rent
- $784 high interval (Pro) →
- Mortgage (P&I)
- −$472
- Tax from tax record
- −$142 /mo · $1,702/yr
- Insurance
- −$38
- HOA
- −$0
- Vacancy / Maint / Mgmt
- −$165
- Net cashflow
- $-32
Break-even live
Sensitivity live
| Price | -10% $19 | -5% $-6 | +0% $-32 | +5% $-57 | +10% $-83 |
|---|---|---|---|---|---|
| Rent | -10% $-94 | -5% $-63 | +0% $-32 | +5% $-1 | +10% $30 |
| Rate | -1.0pp $13 | -0.5pp $-9 | base $-32 | +0.5pp $-55 | +1.0pp $-79 |
UW: 25.0% down · 7.5% · 30yr · 1.5% tax · 5.0% vac · 8.0% maint · 8.0% mgmt
Financing live
Cash to close
- Down payment
- $22,500
- Closing costs
- $2,700
- Reserves months
- —
- Total cash needed
- —
Loan-product check · same deal, 3 products live
Conventional
25% down · 7.5% · 30yr
- Down + closing
- —
- Monthly P&I
- —
- Monthly cashflow
- —
- DSCR
- —
- Eligible?
- —
Personal DTI + credit; lowest rate.
DSCR
20% down · 8.5% · 30yr
- Down + closing
- —
- Monthly P&I
- —
- Monthly cashflow
- —
- DSCR
- —
- Eligible?
- —
No personal income docs; deal must DSCR.
Hard money
10% down · 12.0% · 12mo
- Down + closing
- —
- Monthly P&I
- —
- Monthly cashflow
- —
- DSCR
- —
- Eligible?
- —
Short-term bridge; refi at stabilization.
Rent comps 5 comps
| Address | Beds | Baths | Sqft | Rent | $/sqft | DOM | Units | Dist |
|---|---|---|---|---|---|---|---|---|
| 401 W Main St Unit D Mt Pleasant, PA | 1.0 | 1.0 | — | $650 | — | 45d | 1 | 0.08mi |
| 501 Washington St Unit 3 Mt Pleasant, PA | 1.0 | 1.0 | 650 | $600 | $0.92 | 25d | 1 | 0.21mi |
| 9 E Main St Unit 2 Mt Pleasant, PA | 2.0 | 1.0 | — | $900 | — | 25d | 1 | 0.27mi |
| 228 E Main St Mount Pleasant, PA | 3.0 | 1.0 | 1560 | $1,500 | $0.96 | 19d | 1 | 0.42mi |
| 325 Back St Unit B Mt Pleasant, PA | 2.0 | 1.0 | — | $900 | — | 25d | 1 | 1.15mi |
Listing history 23 events
-
2026-06-21days on market $90,000 Active 269 DOM
-
2026-06-18days on market $90,000 Active 266 DOM
-
2026-06-17days on market $90,000 Active 265 DOM
-
2026-06-16days on market $90,000 Active 264 DOM
-
2026-06-15days on market $90,000 Active 263 DOM
-
2026-06-13days on market $90,000 Active 261 DOM
-
2026-06-09days on market $90,000 Active 257 DOM
-
2026-06-08days on market $90,000 Active 256 DOM
-
2026-06-07days on market $90,000 Active 255 DOM
-
2026-06-05days on market $90,000 Active 252 DOM
-
2026-06-03days on market $90,000 Active 251 DOM
-
2026-06-02days on market $90,000 Active 250 DOM
-
2026-06-01days on market $90,000 Active 249 DOM
-
2026-05-31days on market $90,000 Active 248 DOM
-
2026-01-09price $90,000 275-char remark
Show marketing remark (275 chars)
Sitting in a prime location, this property features two established commercial spaces on the main level that both offer immediate cash flow. The upstairs has great potential for a third unit. This is a fantastic opportunity for investors seeking an income producing property.
-
2025-12-23status Active 275-char remark
Show marketing remark (275 chars)
Sitting in a prime location, this property features two established commercial spaces on the main level that both offer immediate cash flow. The upstairs has great potential for a third unit. This is a fantastic opportunity for investors seeking an income producing property.
-
2025-12-16status Pending 275-char remark
Show marketing remark (275 chars)
Sitting in a prime location, this property features two established commercial spaces on the main level that both offer immediate cash flow. The upstairs has great potential for a third unit. This is a fantastic opportunity for investors seeking an income producing property.
-
2025-11-26price $95,000 275-char remark
Show marketing remark (275 chars)
Sitting in a prime location, this property features two established commercial spaces on the main level that both offer immediate cash flow. The upstairs has great potential for a third unit. This is a fantastic opportunity for investors seeking an income producing property.
-
2025-09-17$100,000 Active 275-char remark
Show marketing remark (275 chars)
Sitting in a prime location, this property features two established commercial spaces on the main level that both offer immediate cash flow. The upstairs has great potential for a third unit. This is a fantastic opportunity for investors seeking an income producing property.
-
2010-02-25soldstatus $20,000
-
2010-02-17price $22,000 146-char remark
Show marketing remark (146 chars)
"HANDYMAN SPECIAL" Large home with character. Zoned B-1 Business. Many possibilities here. Detached garage. Paved rear and side alleys.
-
2010-02-17soldstatus $20,000 146-char remark
Show marketing remark (146 chars)
"HANDYMAN SPECIAL" Large home with character. Zoned B-1 Business. Many possibilities here. Detached garage. Paved rear and side alleys.
-
2009-08-31$20,000 146-char remark
Show marketing remark (146 chars)
"HANDYMAN SPECIAL" Large home with character. Zoned B-1 Business. Many possibilities here. Detached garage. Paved rear and side alleys.
ⓘ Source: listings_history table (triggers on properties + properties_extension) + one-shot
backfill from property_details.listing_events for pre-trigger history.
Tax reassessment forecast PA · Partial reset (capped growth)
- Current annual tax
- $1,702 · $142/mo
- Projected year-2 tax
- $1,702 · $142/mo
- Expected delta
- $0/yr ($0/mo · 0.0%)
ⓘ Screening estimate from a state-policy table — verify with the county assessor before closing.
Climate risk First Street
- Flood 1/10 Low FEMA zone X (unshaded) · 0% chance over 30 yrs
- Wildfire 1/10 Low
- Heat 4/10 Moderate 7 d/yr ≥95°F today · 19 d/yr by 30 yrs out
- Wind 2/10 Low
- Air quality 2/10 Low 0 unhealthy d/yr today · 1 by 30 yrs out
Nearby sold comps map
Loading sold comps map…
Walkable amenities ~0.75 mi
Loading nearby amenities…
Taxation est. · year 1
- Rental income
- $9,408
- − Mortgage interest
- −$5,041
- − Property taxes
- −$1,702
- − Insurance
- −$450
- − Repairs & maintenance
- −$753
- − Management
- −$753
- − Depreciation
- −$2,618
- Taxable loss
- −$1,909
- Est. tax savings @ 24.0%
- +$458
- After-tax cash flow
- $75/yr
For passive investors: Depreciation is non-cash, so a rental often shows a tax loss while cash-flowing — sheltering income. Rental losses are passive: they offset passive income freely, and up to $25,000/yr can offset ordinary (W-2) income if you actively participate and your MAGI is under $100k (phasing out to $0 by $150k); unused losses carry forward. On sale, claimed depreciation is recaptured at up to 25%, and gains may owe capital-gains tax (a 1031 exchange can defer both). Figures are a year-1 estimate at your 24.0% rate — not tax advice; consult a CPA.
Schools (NCES district)
- District
- Mount Pleasant Area SD
- NCES district ID
- 4216170
- Math proficiency
- 25% ▼ -19.00%
- Reading proficiency
- 51% ▼ -12.00%
- Median HH income
- $47,175
- Composite
- 32.46/100
- National rank
- #5716
- State rank
- #378 of 539 in PA
Livability — Mount Pleasant
- Score
- 72/100
- State rank
- #647
- US rank
- #6287
Category grades
Schools grade is shown separately in the Schools card above.
Census & demographics
- Census place
- Mount Pleasant, PA
- Population (ZIP)
- 15,420
Population outlook (Westmoreland County) Hauer SSP2
- Today (2025)
- 342,555 people
- By 2030
- 331,717 · -3.2%
- By 2040
- 304,976 · -11.0%
- By 2050
- 277,444 · -19.0%
- By 2075
- 224,607 · -34.4%
- By 2100
- 171,084 · -50.1%
Race, ethnicity, and origin ACS 2023
- Neighborhood character
- Predominantly White (98%)
- Race & ethnicity
- White 98% Two or more races 2%
- Common ancestry
- Romanian 15% Iranian 2% Slovak 2%
- Foreign-born
- 1%
Political lean MEDSL · Westmoreland
- 2024 margin
- Strong R (+28.4) · D 35.4% · R 63.9%
- 2008→2024 swing
- -11.7pp toward R · 2008: -16.7pp · 2024: -28.4pp
- All cycles
- 2024: R+28.4 2020: R+28.3 2016: R+31.3 2012: R+23.7 2008: R+16.7
Not yet ingested
- Civics
- —
Market trends
- HPI YoY
- ▲ 7.20%
- Current HPI
- 224.6311
- Rent YoY
- —
- Metro
- —
- State GDP YoY
- ▲ 1.68%
- F500 in state
- 34
Industry mix (Fortune 500 HQ in PA)
| Industry | F500 HQs | Revenue |
|---|---|---|
| Healthcare | 2 | $309B |
|
||
| Insurance | 2 | $27B |
|
||
| Telecommunications / Media | 1 | $124B |
|
||
| Industrial Distribution | 1 | $22B |
|
||
| Financial Services | 1 | $20B |
|
||
| Chemicals / Materials | 1 | $18B |
|
||
Price history
+350.0% since first listed9 events — show timeline
- 2026-01-09 Price Changed $90,000 West Penn MLS
- 2025-12-23 Relisted — West Penn MLS
- 2025-12-16 Pending — West Penn MLS
- 2025-11-26 Price Changed $95,000 West Penn MLS
- 2025-09-17 Listed $100,000 West Penn MLS
- 2010-02-25 Sold (Public Records) $20,000 Public Records
- 2010-02-17 Sold (MLS) $20,000 West Penn MLS
- 2010-02-17 Price Changed $22,000 West Penn MLS
- 2009-08-31 Listed $20,000 West Penn MLS
Property tax history
+1.5%/yrLatest (2026): $1,702 · +0.0% YoY. Source: county tax records.
Cash-flow waterfall
monthlySold comps — $/sqft
last 12 mo · ≤1 miLoading sold comps…