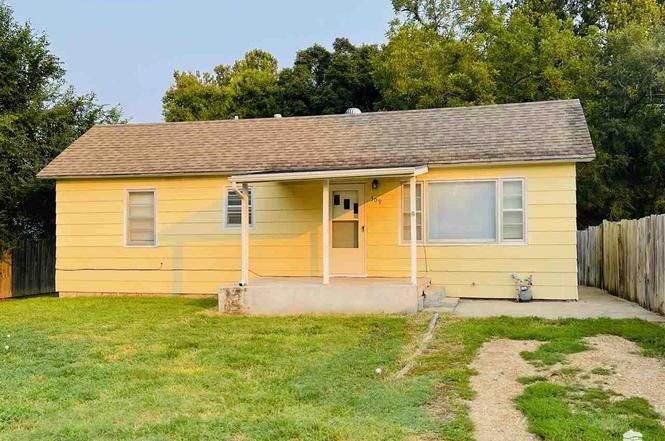
309 12th St · Ogden, KS
Flood risk 1/10 · Minimal
- FEMA flood zone
- X (shaded)
- Chance of flooding over 30 yrs
- 0.0%
- Est. flood insurance / yr
- $507 – $1,088
Fire risk 5/10 · Moderate
- Est. fire insurance / yr
- $1,154 – $2,142
Heat risk 4/10 · Minor
- Hot days now (above 108°F)
- 7 days/yr
- Hot days in 30 yrs
- 17 days/yr
Wind risk 2/10 · Minimal
- Chance of severe wind over 30 yrs
- —
Air-quality risk 2/10 · Minimal
- Unhealthy air days now
- 2 days/yr
- Unhealthy air days in 30 yrs
- 2 days/yr
Risk factors via First Street. Map © Google.
Why this score? — see what drove the B+ grade
The composite is a weighted blend of 9 inputs, each scored 0–100. Each bar is that input's sub-score; the figure is the points it added to the 100-point composite (weight × sub-score).
- Cash flow +30.0/30.0
- 1% rule +10.0/10.0
- DSCR +10.0/10.0
- Appreciation +10.0/10.0
- ARV discount +7.5/15.0
- Schools +3.6/10.0
- Livability +3.2/5.0
- Rent growth +2.5/5.0
- Condition / age +2.5/5.0
$55,000
🖨 Deal sheet 📄 Offer letter ✓ Due diligence
Listing remarks MLS
Great investment property or starter home! This 1 bed 1 bath home is a super cute starter and has lots of potential. Large lot and alley access , close to Fort Riley! Shed stays. Call Kelly Niemczyk 785-375-8300 or Kelsey Adams at 785-307-1882 today. Please give at least 24 hr notice if not longer.
Key facts
- 7,200 sq ft lot
- Built 1945
- Listed 94 days
Property features AI
Exterior
- Utilities: Public water
- Home design: Single-family residence; Residential property
- Construction: Construction materials: Unknown; Built area above grade: 630; Crawl space foundation
- Exterior features: No exterior amenities listed; No fencing
Interior
- Kitchen: Oven, Range, Refrigerator
- Bedrooms: 1 main-level bedroom
- Flooring: Carpet
- Bathrooms: 1 full bathroom
- Heating & cooling: Central air conditioning; Electric heating
- Interior features: Oven, Range, Refrigerator; Crawl space basement
Neighborhood map
What this means for you Summary
Snapshot
- This is a 1-bed/1.0-bath single-family listed at $55k.
Deal economics
- At list price, monthly cash flow is $286 ($3k/yr) — positive.
- The deal already cash-flows at list — no discount required.
- Meets the 1% rule at list price ($843 rent vs $55k).
- Recommended offer: $50k (9.0% below list) — sets the bar for market timing.
Location & tenants
- Location reads 65/100 on livability (#301 in KS) — a middle-class / working-renter tenant base. Strengths: cost of living A+, housing A+, crime A; Watch: health & safety D+, schools D, amenities F.
- Manhattan-Ogden (urban): math 39% / reading 46% proficiency, ranked #26 of 169 in KS (top 15%) — families likely to look elsewhere, expect single-tenant / working-renter base with shorter leases.
- Market conditions: 17 active listings in the ZIP; 132 units permitted in Riley County in 2024 (35 in 5+ unit buildings).
- This rent is only 15% of the median local income ($68k/yr) — well below the 30% rent-burden line; pricing power to push rent on renewal without tenant pushback.
Forward outlook
- In year one you build about $6k of equity ($380 loan paydown + $6k appreciation (10.0% local appreciation)).
- Riley County population projected at +30% by 2050 — long-run rental-demand tailwind backs the buy-and-hold thesis.
- At projected returns (10.0% appreciation + 3.0% rent growth), your $15k cash investment doubles in ~2 years — after that, you're playing with house money.
- By year 6, paydown + projected appreciation supports a ~$35k cash-out refi (75% LTV) — recoverable capital for the next deal without selling this one.
Negotiation context
- It's been on market 95 days — a 9% lower offer ($50k) is reasonable based on typical stale-listing flexibility.
- 4 sale attempts since 5y ago; this cycle's ask has dropped $5k (8%) from the opening price — seller is motivated, your offer sets the floor, not the list.
- Current owner paid $25k; list at $55k implies a 120% gain — meaningful room to come down on a strong offer.
Risks & watch-outs
- Watch-outs: built in 1945 — expect roof / HVAC / electrical / plumbing capex.
- Climate carrying-cost: moderate wildfire risk — expect insurance premiums to compound above CPI over the hold.
Questions for the listing agent
- It's been on market 95 days. Have you received any prior offers? Is the seller open to a 9% concession, seller financing, or rate buy-down credit?
- Built in 1945 — when were the roof, HVAC, electrical panel, plumbing, and water heater last replaced?
- Why hasn't it sold? Are there any deal-killer items the seller is aware of (foundation, flood, title, zoning, code violations)?
- Is there a deadline driving the sale (1031 exchange, divorce, estate, relocation)? That informs how much negotiation room exists.
- Schools are D-rated, which usually means shorter tenancies and higher turnover. Who's the typical renter profile here, and what's been the actual vacancy rate?
- What's the average days-on-market for RENTAL listings here right now (not sales)? A rising rental-DOM trend means longer vacancies and softer asking-rent achievability than the comps imply.
- What's the recent tenant-quality profile in this submarket — average credit score on applications, eviction rate, late-payment / NSF rate, and stable-employment percentage? A property-management company in the area should have these aggregated.
- How much new for-sale + rental construction is in the pipeline within 1–3 miles? Heavy new supply typically softens prices + rents 12–24 months out; constrained supply supports both.
Investment metrics
- 1% rule
- 1.53% ✓
- Cap rate
- 12.54%
- Cash-on-cash
- 22.30%
- DSCR
- 1.99
- GRM
- 5.4
CMA / ARV
No comps found within radius.
Projected returns pro-forma
10.0% appreciation · 3.0% rent growth · sell at horizon
- IRR
- 41.0%
- Equity multiple
- 4.13×
- Total profit
- $48,193
- Equity at exit
- $49,548
- IRR
- 35.4%
- Equity multiple
- 9.29×
- Total profit
- $127,612
- Equity at exit
- $106,853
Cash invested: $15,400 (down + closing). Projections, not guarantees.
Landlord ↔ Tenant lean methodology
- Overall (STATE)
- 83 Strongly Landlord-Friendly
- State Kansas
- 83 Strongly Landlord-Friendly · R+10
- County
- — inherits STATE
- City
- — inherits STATE
ZIP-level market 66517
- Home prices YoY
- 4.2%
- Active inventory
- 17
- Price-to-rent
- 5.4×
Monthly cashflow live
- Estimated rent
- $843 medium interval (Pro) →
- Mortgage (P&I)
- −$288
- Tax from tax record
- −$68 /mo · $821/yr
- Insurance
- −$23
- HOA
- −$0
- Vacancy / Maint / Mgmt
- −$177
- Net cashflow
- $286
Break-even live
UW: 25.0% down · 7.5% · 30yr · 1.5% tax · 5.0% vac · 8.0% maint · 8.0% mgmt
Financing live
Cash to close
- Down payment
- $13,750
- Closing costs
- $1,650
- Reserves months
- —
- Total cash needed
- —
Loan-product check · same deal, 3 products live
Conventional
25% down · 7.5% · 30yr
- Down + closing
- —
- Monthly P&I
- —
- Monthly cashflow
- —
- DSCR
- —
- Eligible?
- —
Personal DTI + credit; lowest rate.
DSCR
20% down · 8.5% · 30yr
- Down + closing
- —
- Monthly P&I
- —
- Monthly cashflow
- —
- DSCR
- —
- Eligible?
- —
No personal income docs; deal must DSCR.
Hard money
10% down · 12.0% · 12mo
- Down + closing
- —
- Monthly P&I
- —
- Monthly cashflow
- —
- DSCR
- —
- Eligible?
- —
Short-term bridge; refi at stabilization.
Listing history 26 events
-
2026-06-19days on market $55,000 Active 95 DOM
-
2026-06-18days on market $55,000 Active 94 DOM
-
2026-06-17days on market $55,000 Active 93 DOM
-
2026-06-16days on market $55,000 Active 92 DOM
-
2026-06-15days on market $55,000 Active 91 DOM
-
2026-06-14days on market $55,000 Active 89 DOM
-
2026-06-13days on market $55,000 Active 88 DOM
-
2026-06-10days on market $55,000 Active 86 DOM
-
2026-06-09days on market $55,000 Active 85 DOM
-
2026-06-08days on market $55,000 Active 84 DOM
-
2026-06-07days on market $55,000 Active 83 DOM
-
2026-06-03days on market $55,000 Active 79 DOM
-
2026-06-02days on market $55,000 Active 78 DOM
-
2026-06-01days on market $55,000 Active 77 DOM
-
2026-05-31days on market $55,000 Active 76 DOM
-
2026-05-30days on market $55,000 Active 75 DOM
-
2026-05-06price $55,000
-
2026-04-24status Active
-
2026-04-04status Pending
-
2026-02-23$60,000 Active
-
2023-11-04historical
-
2023-10-11
-
2021-06-25soldstatus 300-char remark
Show marketing remark (300 chars)
Great investment property or starter home! This 1 bed 1 bath home is a super cute starter and has lots of potential. Large lot and alley access , close to Fort Riley! Shed stays. Call Kelly Niemczyk 785-375-8300 or Kelsey Adams at 785-307-1882 today. Please give at least 24 hr notice if not longer.
-
2021-06-25soldstatus
Show marketing remark (300 chars)
Great investment property or starter home! This 1 bed 1 bath home is a super cute starter and has lots of potential. Large lot and alley access , close to Fort Riley! Shed stays. Call Kelly Niemczyk 785-375-8300 or Kelsey Adams at 785-307-1882 today. Please give at least 24 hr notice if not longer.
-
2021-05-28$32,000 300-char remark
Show marketing remark (300 chars)
Great investment property or starter home! This 1 bed 1 bath home is a super cute starter and has lots of potential. Large lot and alley access , close to Fort Riley! Shed stays. Call Kelly Niemczyk 785-375-8300 or Kelsey Adams at 785-307-1882 today. Please give at least 24 hr notice if not longer.
-
2009-07-01soldstatus $25,000
ⓘ Source: listings_history table (triggers on properties + properties_extension) + one-shot
backfill from property_details.listing_events for pre-trigger history.
Tax reassessment forecast KS · Resets to sale price
- Current annual tax
- $821 · $68/mo
- Projected year-2 tax
- $821 · $68/mo
- Expected delta
- $0/yr ($0/mo · 0.0%)
ⓘ Screening estimate from a state-policy table — verify with the county assessor before closing.
Climate risk First Street
- Flood 1/10 Low FEMA zone X (shaded) · 0% chance over 30 yrs
- Wildfire 5/10 Major
- Heat 4/10 Moderate 7 d/yr ≥108°F today · 17 d/yr by 30 yrs out
- Wind 2/10 Low
- Air quality 2/10 Low 2 unhealthy d/yr today · 2 by 30 yrs out
Nearby sold comps map
Loading sold comps map…
Walkable amenities ~0.75 mi
Loading nearby amenities…
Taxation est. · year 1
- Rental income
- $10,115
- − Mortgage interest
- −$3,081
- − Property taxes
- −$821
- − Insurance
- −$275
- − Repairs & maintenance
- −$809
- − Management
- −$809
- − Depreciation
- −$1,600
- Taxable income
- $2,720
- Est. tax owed @ 24.0%
- −$653
- After-tax cash flow
- $2,781/yr
For passive investors: Depreciation is non-cash, so a rental often shows a tax loss while cash-flowing — sheltering income. Rental losses are passive: they offset passive income freely, and up to $25,000/yr can offset ordinary (W-2) income if you actively participate and your MAGI is under $100k (phasing out to $0 by $150k); unused losses carry forward. On sale, claimed depreciation is recaptured at up to 25%, and gains may owe capital-gains tax (a 1031 exchange can defer both). Figures are a year-1 estimate at your 24.0% rate — not tax advice; consult a CPA.
Schools (NCES district)
- District
- Manhattan-Ogden
- NCES district ID
- 2009180
- Math proficiency
- 39% ▼ -1.00%
- Reading proficiency
- 46% ▲ 1.00%
- Median HH income
- $44,001
- Composite
- 35.97/100
- National rank
- #4795
- State rank
- #26 of 169 in KS
Livability — Ogden
- Score
- 65/100
- State rank
- #301
- US rank
- #13306
Category grades
Schools grade is shown separately in the Schools card above.
Census & demographics
- Census place
- Ogden, KS
- County
- Riley County · 62,662 people
- City population
- 1,696
- Metro
- Manhattan, KS
- Population (ZIP)
- 1,696
- Household income
- $68,421
- Rent vs Own
- Severe rent burden
- 54.0
Population outlook (Riley County) Hauer SSP2
- Today (2025)
- 83,656 people
- By 2030
- 89,075 · +6.5%
- By 2040
- 99,100 · +18.5%
- By 2050
- 109,146 · +30.5%
- By 2075
- 134,178 · +60.4%
- By 2100
- 153,653 · +83.7%
Race, ethnicity, and origin ACS 2023
- Neighborhood character
- Majority White (65%)
- Race & ethnicity
- White 65% Hispanic / Latino 17% Black 10% Asian 6% Two or more races 5% Native American 2%
- Hispanic origin (detail)
- Mexican 11% Puerto Rican 2%
- Common ancestry
- Lithuanian 5% Scotch-Irish 1% Romanian 1%
- Foreign-born
- 6%
- Languages at home
- 96% English-only · Spanish 2% Tagalog/Filipino 2%
Political lean MEDSL · Riley
- 2024 margin
- Toss-up / Even · D 49.6% · R 47.8% · Other 2.5%
- 2008→2024 swing
- +8.8pp toward D · 2008: -7.0pp · 2024: 1.8pp
- All cycles
- 2024: D+1.8 2020: D+3.2 2016: R+4.5 2012: R+12.7 2008: R+7.0
Not yet ingested
- Civics
- —
Market trends
- HPI YoY
- ▲ 10.25%
- Current HPI
- 254.8252
- Rent YoY
- —
- Metro
- Manhattan, KS
- State GDP YoY
- —
- F500 in state
- 0
Price history
+120.0% since first listed10 events — show timeline
- 2026-05-06 Price Changed $55,000 FHAOR as distributed by MLS GRID
- 2026-04-24 Relisted — FHAOR as distributed by MLS GRID
- 2026-04-04 Pending — FHAOR as distributed by MLS GRID
- 2026-02-23 Listed $60,000 FHAOR as distributed by MLS GRID
- 2023-11-04 Rental Removed — APPFOLIO
- 2023-10-11 Listed for Rent — APPFOLIO
- 2021-06-25 Sold (Public Records) — Public Records
- 2021-06-25 Sold (MLS) — FHAOR as distributed by MLS GRID
- 2021-05-28 Listed $32,000 FHAOR as distributed by MLS GRID
- 2009-07-01 Sold (Public Records) $25,000 Public Records
Property tax history
+3.3%/yrLatest (2025): $821 · -1.5% YoY. Source: county tax records.
Cash-flow waterfall
monthlySold comps — $/sqft
last 12 mo · ≤1 miLoading sold comps…