 Duplex
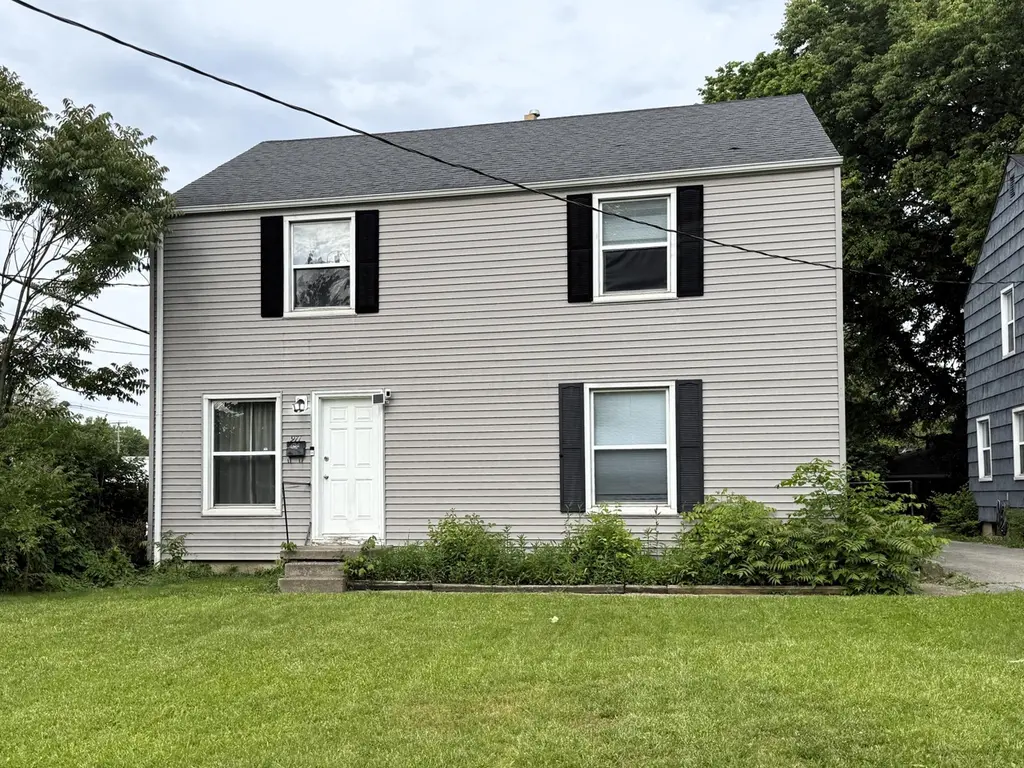
969 Sheridan Ave · Bexley, OH
Flood risk 1/10 · Minimal
- FEMA flood zone
- X (unshaded)
- Chance of flooding over 30 yrs
- 0.0%
- Est. flood insurance / yr
- $473 – $860
Fire risk 1/10 · Minimal
- Est. fire insurance / yr
- $713 – $1,323
Heat risk 4/10 · Minor
- Hot days now (above 100°F)
- 7 days/yr
- Hot days in 30 yrs
- 18 days/yr
Wind risk 2/10 · Minimal
- Chance of severe wind over 30 yrs
- 1.0%
Air-quality risk 2/10 · Minimal
- Unhealthy air days now
- 1 days/yr
- Unhealthy air days in 30 yrs
- 1 days/yr
Risk factors via First Street. Map © Google.
Why this score? — see what drove the D- grade
The composite is a weighted blend of 9 inputs, each scored 0–100. Each bar is that input's sub-score; the figure is the points it added to the 100-point composite (weight × sub-score).
- Cash flow +10.6/30.0
- Schools +7.1/10.0
- Rent growth +4.8/5.0
- Livability +4.5/5.0
- 1% rule +3.1/10.0
- DSCR +3.1/10.0
- Condition / age +2.2/5.0
- ARV discount +1.8/15.0
- Appreciation +0.0/10.0
$295,000
🖨 Deal sheet (PDF) 📄 Offer letter ✓ Due diligence
Multi-family units
County records classify this as Multi-Family (2-4 Unit). Listing-text estimate: 2 units. confirmed
Listing remarks MLS
AFFORDABLE BEXLEY TWO FAMILY
Key facts
- Hardwood flooring
- Fully leased duplex
- Off-street parking
Tags
Property features AI
Finance
- Other: Annual tax amount approximately $4,831 (tax year 2025)
- Financial info: Two-unit property; Net operating income approximately $21,869; Operating expenses approximately $4,831
Exterior
- Utilities: Public sewer
- Home design: Duplex property; Built in 1950
- Construction: Built in 1950
- Exterior features: Lot approximately 0.11 acres; Located near E Livingston Ave
Interior
- Interior features: Duplex with two separate units
Neighborhood map
What this means for you Summary
Snapshot
- This is a 2 × 2-bed/1-bath units multifamily listed at $295k. Condition is rated fair.
Deal economics
- At list price, monthly cash flow is $-147 ($-2k/yr) — negative. Per door: $-73/mo.
- To cash-flow at today's rent, offer at most $274k (7.2% below list).
- To meet the 1% rule (rent ≥ 1% of price), the offer needs to be $240k (18.8% below list).
- Recommended offer: $240k (18.8% below list) — sets the bar for 1% rule.
- Cap rate 5.7% vs local median 1.1% in Bexley — top-decile yield for the area; either an underpriced asset or a hidden risk that comps aren't pricing in. Stress-test before assuming the spread holds.
Location & tenants
- Location reads 89/100 on livability (#10 in OH, #116 nationally) — a professional / high-income tenant draw. Strengths: commute A+, employment A+, housing A+; Watch: cost of living D-.
- Bexley City (suburban): math 77% / reading 81% proficiency, ranked #40 of 656 in OH (top 6%) — strong family-tenant draw, lease renewals of 3-5y typical; only 15% free/reduced lunch — higher-income household profile.
- Zoned schools: Montrose Elementary School (math 77% / reading 87%, grade A+, #116 of 1,584 statewide, top 9%, 335 students, 11% FRL); Bexley Middle School (math 70% / reading 77%, grade A, #99 of 654 statewide, top 16%, 602 students, 0% FRL); Bexley High School (math 87% / reading 87%, grade A, #4 of 781 statewide, top 1%, 736 students, 23% FRL) — zoned schools at 11% FRL track the district average.
- Market conditions: Rents rising fast (+9.4%/yr); 54 active listings in the ZIP; 26 comparable units currently listed for rent nearby; rentals at typical pace (median 19d on market — plan ~3-4 weeks tenant-placement turnaround); solid renter incomes; 8,139 units permitted in Franklin County in 2024 (5,940 in 5+ unit buildings).
- This rent runs 32% of the median local income ($90k/yr) — at the standard rent-burdened threshold; future hikes will face affordability resistance.
Forward outlook
- Local home prices are declining (-3.0%/yr); year-one equity from $2k of loan paydown is wiped out by about $9k of value loss. Plan a longer hold.
- Franklin County population projected at +34% by 2050 — long-run rental-demand tailwind backs the buy-and-hold thesis.
Negotiation context
- Only 6 days on market — expect competitive offers; lowballing is unlikely to land.
- 4 sale attempts since 25y ago with the ask held roughly flat each time — persistent listings suggest the price (not the market) is what's stuck; bring a comps-based counter.
Risks & watch-outs
- Watch-outs: built in 1950 — expect roof / HVAC / electrical / plumbing capex.
Questions for the listing agent
- What do current leases actually rent for vs. the listed asking? Can we see a recent rent roll and the last 12 months of T-12 income?
- Can we see the unit-by-unit rent roll, current vacancy, and any below-market leases? What's the average tenancy length?
- What capital expenditures (roof, boiler, parking lot, exteriors) have been made in the last 5 years, and what's planned in the next 2?
- Have any recent inspections been done? Can we get a copy of the seller's disclosures and any deferred-maintenance estimates?
- Built in 1950 — when were the roof, HVAC, electrical panel, plumbing, and water heater last replaced?
- Is there a deadline driving the sale (1031 exchange, divorce, estate, relocation)? That informs how much negotiation room exists.
- Schools are A-rated — typically a magnet for longer-tenancy family renters. What's the average tenant stay here, and is there a school-zone premium baked into asking?
- The area grade is low — what's the realistic commute time and amenity access for the typical tenant pool here? Any planned neighborhood developments (good or bad) we should know about?
- What's the average days-on-market for RENTAL listings here right now (not sales)? A rising rental-DOM trend means longer vacancies and softer asking-rent achievability than the comps imply.
- What's the recent tenant-quality profile in this submarket — average credit score on applications, eviction rate, late-payment / NSF rate, and stable-employment percentage? A property-management company in the area should have these aggregated.
- How much new apartment / multifamily construction is in the pipeline within 1–3 miles? Heavy new supply (>2% of stock underway) typically softens rents 12–24 months out; light construction supports rent growth.
Investment metrics
- 1% rule
- 0.81% ✗
- Cap rate
- 5.70%
- Cash-on-cash
- -2.13%
- DSCR
- 0.91
- GRM
- 10.3
CMA / ARV
- ARV (on-the-fly)
- $261,632
- Comps found
- 8
Show comp detail 8 sales within ~0.75 mi
| Address | Dist | Beds/Ba | Sqft | Sold | Price | $/sf | Match |
|---|---|---|---|---|---|---|---|
| 969 Sheridan Ave | 0.00mi | 4/— | 1,792 (0%) | 1mo | $295,000 | $165 | 100 |
| 940 Ferndale Pl | 0.05mi | 4/— | 1,782 (-1%) | 1mo | $206,000 | $116 | 96 |
| 960 Ferndale Pl | 0.03mi | 4/— | 1,537 (-14%) | 10mo | $225,000 | $146 | 66 |
| 651-653 Rhoads Ave | 0.68mi | 4/— | 1,844 (+3%) | 14mo | $270,000 | $146 | 52 |
| 1732-1734 E Whittier St | 0.70mi | 4/— | 1,568 (-12%) | 1mo | $195,000 | $124 | 46 |
| 1723-1725 E Whittier St | 0.72mi | 4/— | 1,624 (-9%) | 10mo | $193,315 | $119 | 42 |
| 1701 E Whittier St #1703 | 0.75mi | 4/— | 1,624 (-9%) | 9mo | $245,000 | $151 | 42 |
| 1710-1712 E Whittier St | 0.72mi | 4/— | 1,624 (-9%) | 24mo | $300,000 | $185 | 31 |
Match score weights: distance 35% · size 25% · config 20% · recency 20%. Top-matched comps best support the ARV.
Projected returns pro-forma
-3.0% appreciation · 8.0% rent growth · sell at horizon
- IRR
- -14.4%
- Equity multiple
- 0.46×
- Total profit
- $-44,448
- Equity at exit
- $43,985
- IRR
- 1.0%
- Equity multiple
- 1.09×
- Total profit
- $7,024
- Equity at exit
- $25,506
Cash invested: $82,600 (down + closing). Projections, not guarantees.
Landlord ↔ Tenant lean methodology
- Overall (STATE)
- 73 Landlord-Friendly
- State Ohio
- 73 Landlord-Friendly · R+6
- County
- — inherits STATE
- City
- — inherits STATE
ZIP-level market 43209
- Rents YoY
- 9.4%
- Active inventory
- 54
- Price-to-rent
- 20.5×
Monthly cashflow live
- Estimated rent
- $2,395 high interval (Pro) →
- Mortgage (P&I)
- −$1,547
- Tax est. 1.5%
- −$369 /mo · $4,425/yr
- Insurance
- −$123
- HOA
- −$0
- Vacancy / Maint / Mgmt
- −$503
- Net cashflow
- $-147
Break-even live
Sensitivity live
| Price | -10% $57 | -5% $-45 | +0% $-147 | +5% $-249 | +10% $-350 |
|---|---|---|---|---|---|
| Rent | -10% $-336 | -5% $-241 | +0% $-147 | +5% $-52 | +10% $43 |
| Rate | -1.0pp $2 | -0.5pp $-72 | base $-147 | +0.5pp $-223 | +1.0pp $-301 |
2-unit breakdown (identical units grouped — click to expand)
| Units | Beds | Baths | Est. rent |
|---|---|---|---|
| 2× units | 2 | 1 | $2,394 |
| #1 | 2 | 1 | $1,197 |
| #2 | 2 | 1 | $1,197 |
| Total (2 units) | $2,395 | ||
UW: 25.0% down · 7.5% · 30yr · 1.5% tax · 5.0% vac · 8.0% maint · 8.0% mgmt
Financing live
Cash to close
- Down payment
- $73,750
- Closing costs
- $8,850
- Reserves months
- —
- Total cash needed
- —
Loan-product check · same deal, 3 products live
Conventional
25% down · 7.5% · 30yr
- Down + closing
- —
- Monthly P&I
- —
- Monthly cashflow
- —
- DSCR
- —
- Eligible?
- —
Personal DTI + credit; lowest rate.
DSCR
20% down · 8.5% · 30yr
- Down + closing
- —
- Monthly P&I
- —
- Monthly cashflow
- —
- DSCR
- —
- Eligible?
- —
No personal income docs; deal must DSCR.
Hard money
10% down · 12.0% · 12mo
- Down + closing
- —
- Monthly P&I
- —
- Monthly cashflow
- —
- DSCR
- —
- Eligible?
- —
Short-term bridge; refi at stabilization.
Rent comps 26 comps
| Address | Beds | Baths | Sqft | Rent | $/sqft | DOM | Units | Dist |
|---|---|---|---|---|---|---|---|---|
| 1316 College Ave Columbus, OH | 4.0 | 3.0 | 2316 | $3,800 | $1.64 | 0d | 1 | 0.57mi |
| 2200 E Main St Bexley, OH | 3.0 | 1.0–3.0 | 1142 | $4,678 | $4.10 | 0d | 136 | 0.60mi |
| 1805 Kent St Columbus, OH | 4.0 | 1.5 | 1399 | $1,900 | $1.36 | 25d | 1 | 0.60mi |
| 841-843 Seymour Ave Columbus, OH | 3.0 | 1.5 | 1286 | $1,650 | $1.28 | 0d | 1 | 0.87mi |
| 533 Fairwood Ave Columbus, OH | 4.0 | 2.0 | 2410 | $2,475 | $1.03 | 45d | 1 | 0.91mi |
| 773-775 Berkeley Rd Columbus, OH | 3.0 | 1.0 | 1280 | $1,350 | $1.05 | 4d | 1 | 0.97mi |
| 773-775 Berkeley Rd Columbus, OH | 3.0 | 1.0 | 1280 | $1,400 | $1.09 | 23d | 1 | 0.97mi |
| 1683-1685 E Main St Columbus, OH | 3.0 | 2.0 | 1380 | $1,695 | $1.23 | 14d | 1 | 0.99mi |
| 614-616 Lilley Ave Columbus, OH | 3.0 | 1.5 | 1232 | $1,700 | $1.38 | 45d | 1 | 1.04mi |
| 558 Lilley Ave Columbus, OH | 3.0 | 1.0 | 1372 | $1,600 | $1.17 | 45d | 1 | 1.07mi |
| 382 Morrison Ave Columbus, OH | 4.0 | 1.5 | 2027 | $2,500 | $1.23 | 5d | 1 | 1.10mi |
| 1702 Bryden Rd #1704 Columbus, OH | 3.0 | 2.5 | 2000 | $2,300 | $1.15 | 19d | 1 | 1.13mi |
| 391 Berkeley Rd Columbus, OH | 3.0 | 1.5 | 1518 | $2,295 | $1.51 | 16d | 1 | 1.15mi |
| 1756 Oak St Columbus, OH | 4.0 | 2.0 | 2425 | $5,200 | $2.14 | 0d | 1 | 1.19mi |
| 1559 Frebis Ave Columbus, OH | 3.0 | 2.0 | 1744 | $2,100 | $1.20 | 45d | 1 | 1.31mi |
| 904 Studer Ave Columbus, OH | 3.0 | 1.5 | 1364 | $1,780 | $1.30 | 25d | 1 | 1.35mi |
| 1479-1481 Bryden Rd Columbus, OH | 4.0 | 1.5 | 2604 | $1,750 | $0.67 | 45d | 1 | 1.36mi |
| 555 Kimball Pl Columbus, OH | 3.0 | 2.5 | 1252 | $1,785 | $1.43 | 45d | 1 | 1.38mi |
| 883 Studer Ave Columbus, OH | 4.0 | 2.5 | 2217 | $2,500 | $1.13 | 0d | 1 | 1.38mi |
| 883 Studer Ave Columbus, OH | 4.0 | 2.5 | 2217 | $2,500 | $1.13 | 3d | 1 | 1.38mi |
| 932 Linwood Ave Columbus, OH | 4.0 | 1.5 | 1663 | $2,045 | $1.23 | 45d | 1 | 1.43mi |
| 988 Linwood Ave Columbus, OH | 4.0 | 3.0 | 1800 | $2,750 | $1.53 | 19d | 1 | 1.45mi |
| 1167 E Whittier St Columbus, OH | 3.0 | 1.5 | 1300 | $1,950 | $1.50 | 45d | 1 | 1.46mi |
| 1165-1167 E Whittier St Columbus, OH | 3.0 | 1.5 | 1300 | $1,950 | $1.50 | 45d | 1 | 1.46mi |
| 1776 Nason Ave Columbus, OH | 3.0 | 1.0 | 1300 | $1,500 | $1.15 | 5d | 1 | 1.47mi |
| 1776 Nason Ave Columbus, OH | 3.0 | 1.0 | 1300 | $1,500 | $1.15 | 9d | 1 | 1.47mi |
Listing history 7 events
-
2026-05-22$295,000 Active
-
2026-04-26$1,253
-
2003-06-02historical
-
2003-05-28$119,900
-
2001-12-14soldstatus $66,000 28-char remark
Show marketing remark (28 chars)
AFFORDABLE BEXLEY TWO FAMILY
-
2001-11-15historical 28-char remark
Show marketing remark (28 chars)
AFFORDABLE BEXLEY TWO FAMILY
-
2001-11-01$67,000 28-char remark
Show marketing remark (28 chars)
AFFORDABLE BEXLEY TWO FAMILY
ⓘ Source: listings_history table (triggers on properties + properties_extension) + one-shot
backfill from property_details.listing_events for pre-trigger history.
Climate risk First Street
- Flood 1/10 Low FEMA zone X (unshaded) · 0% chance over 30 yrs
- Wildfire 1/10 Low
- Heat 4/10 Moderate 7 d/yr ≥100°F today · 18 d/yr by 30 yrs out
- Wind 2/10 Low 100% chance of damaging wind over 30 yrs
- Air quality 2/10 Low 1 unhealthy d/yr today · 1 by 30 yrs out
Nearby sold comps map
Loading sold comps map…
Walkable amenities ~0.75 mi
Loading nearby amenities…
Taxation est. · year 1
- Rental income
- $28,740
- − Mortgage interest
- −$16,525
- − Property taxes
- −$4,425
- − Insurance
- −$1,475
- − Repairs & maintenance
- −$2,299
- − Management
- −$2,299
- − Depreciation
- −$8,582
- Taxable loss
- −$6,865
- Est. tax savings @ 24.0%
- +$1,648
- After-tax cash flow
- $-112/yr
For passive investors: Depreciation is non-cash, so a rental often shows a tax loss while cash-flowing — sheltering income. Rental losses are passive: they offset passive income freely, and up to $25,000/yr can offset ordinary (W-2) income if you actively participate and your MAGI is under $100k (phasing out to $0 by $150k); unused losses carry forward. On sale, claimed depreciation is recaptured at up to 25%, and gains may owe capital-gains tax (a 1031 exchange can defer both). Figures are a year-1 estimate at your 24.0% rate — not tax advice; consult a CPA.
Condition & rehab AI · 13 photos
A moderately rehabbed two-family home in Bexley, Ohio, with average condition and some minor repairs needed. Potential for significant value increase with updates.
Repairs flagged
- Minor kitchen cabinets — dated and slightly worn
- Minor bathroom fixtures — dated and slightly worn
- Minor paint — scuffing and minor discoloration
Value-add opportunities
- Resale new kitchen cabinets — modernizing the kitchen
- Resale new bathroom fixtures — modernizing the bathroom
- Both painting — enhances curb appeal and interior aesthetics
- Both HVAC upgrade — improves comfort and energy efficiency
Renovation cost estimate screening
| Repair item | Severity | Est. cost |
|---|---|---|
| kitchen cabinets · dated and slightly worn | Minor | $500–3,000 |
| bathroom fixtures · dated and slightly worn | Minor | $500–3,000 |
| paint · scuffing and minor discoloration | Minor | $500–3,000 |
| Total estimated repair cost · 3 items | $1,500–9,000 |
Value-add ROI direction
- Resale new kitchen cabinets — modernizing the kitchen ↑
- Resale new bathroom fixtures — modernizing the bathroom ↑
- Both painting — enhances curb appeal and interior aesthetics ↑
- Both HVAC upgrade — improves comfort and energy efficiency ↑
ⓘ Cost ranges are severity-bucket heuristics (US national rule-of-thumb). Get contractor quotes + a written scope before underwriting a rehab budget.
Schools (NCES district)
- District
- Bexley City
- NCES district ID
- 3904362
- Math proficiency
- 77% ▼ -5.00%
- Reading proficiency
- 81% ▼ -4.00%
- Median HH income
- $94,720
- Composite
- 71.09/100
- National rank
- #239
- State rank
- #40 of 656 in OH
Livability — Bexley
- Score
- 89/100
- State rank
- #10
- US rank
- #116
Category grades
Schools grade is shown separately in the Schools card above.
Census & demographics
- Census place
- Bexley, OH
- County
- Franklin County · 1,351,780 people
- City population
- 28,193
- Metro
- Columbus, OH
- Population (ZIP)
- 28,193
- Household income
- $89,713
- Rent vs Own
- Severe rent burden
- 1110.0
Population outlook (Franklin County) Hauer SSP2
- Today (2025)
- 1,456,139 people
- By 2030
- 1,556,890 · +6.9%
- By 2040
- 1,757,349 · +20.7%
- By 2050
- 1,950,539 · +34.0%
- By 2075
- 2,376,171 · +63.2%
- By 2100
- 2,636,796 · +81.1%
Race, ethnicity, and origin ACS 2023
- Neighborhood character
- Predominantly White (66%)
- Race & ethnicity
- White 66% Black 25% Two or more races 6% Hispanic / Latino 4% Asian 2%
- Common ancestry
- Romanian 4% Scotch-Irish 3% Lithuanian 2%
- Foreign-born
- 5% · Canada, China
- Languages at home
- 92% English-only · Spanish 2% Arabic 2% Russian/Polish/Slavic 1%
Political lean MEDSL · Franklin
- 2024 margin
- Strong D (+28.4) · D 63.7% · R 35.3% · Other 1.0%
- 2008→2024 swing
- +7.7pp toward D · 2008: 20.7pp · 2024: 28.4pp
- All cycles
- 2024: D+28.4 2020: D+31.4 2016: D+25.9 2012: D+21.7 2008: D+20.7
Not yet ingested
- Civics
- —
Market trends
- HPI YoY
- ▼ -405.11%
- Current HPI
- 287.281
- Rent YoY
- ▲ 9.36%
- Metro
- Columbus, OH
- State GDP YoY
- ▲ 1.98%
- F500 in state
- 48
Industry mix (Fortune 500 HQ in OH)
| Industry | F500 HQs | Revenue |
|---|---|---|
| Insurance | 3 | $145B |
|
||
| Industrial Machinery | 3 | $49B |
|
||
| Financial Services | 3 | $24B |
|
||
| Consumer Goods | 2 | $93B |
|
||
| Aerospace / Defense | 2 | $47B |
|
||
| Utilities | 2 | $33B |
|
||
Price history
+340.3% since first listed10 events — show timeline
- 2026-06-05 Sold (MLS) $295,000 CBRMLS
- 2026-05-28 Pending — CBRMLS
- 2026-05-25 Rental Removed $1,253 RENTLY
- 2026-05-22 Listed $295,000 CBRMLS
- 2026-04-26 Listed for Rent $1,253 RENTLY
- 2003-06-02 Listing Removed — CBRMLS
- 2003-05-28 Listed $119,900 CBRMLS
- 2001-12-14 Sold (MLS) $66,000 CBRMLS
- 2001-11-15 Listing Removed — CBRMLS
- 2001-11-01 Listed $67,000 CBRMLS
Cash-flow waterfall
monthlySold comps — $/sqft
last 12 mo · ≤1 miLoading sold comps…