322 N Milwaukee Ave · Wheeling, IL
Flood risk 1/10 · Minimal
- FEMA flood zone
- X (unshaded)
- Chance of flooding over 30 yrs
- 0.0%
- Est. flood insurance / yr
- $473 – $860
Fire risk 1/10 · Minimal
- Est. fire insurance / yr
- $804 – $1,492
Heat risk 3/10 · Minor
- Hot days now (above 99°F)
- 7 days/yr
- Hot days in 30 yrs
- 14 days/yr
Wind risk 2/10 · Minimal
- Chance of severe wind over 30 yrs
- —
Air-quality risk 4/10 · Minor
- Unhealthy air days now
- 4 days/yr
- Unhealthy air days in 30 yrs
- 4 days/yr
Risk factors via First Street. Map © Google.
Why this score? — see what drove the F grade
The composite is a weighted blend of 9 inputs, each scored 0–100. Each bar is that input's sub-score; the figure is the points it added to the 100-point composite (weight × sub-score).
- ARV discount +7.5/15.0
- Schools +3.9/10.0
- Livability +3.6/5.0
- Cash flow +3.3/30.0
- Rent growth +2.9/5.0
- Condition / age +2.5/5.0
- 1% rule +0.1/10.0
- DSCR +0.0/10.0
- Appreciation +0.0/10.0
$539,000
🖨 Deal sheet (PDF) 📄 Offer letter ✓ Due diligence
Listing remarks MLS
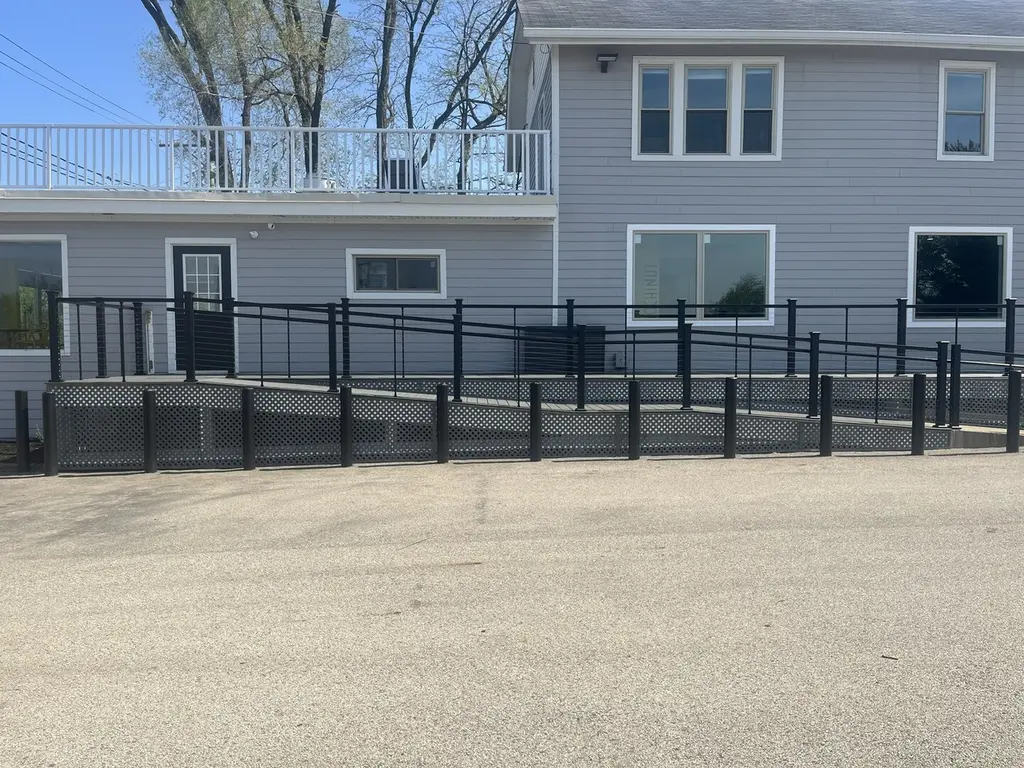
Rare opportunity on Milwaukee Ave. High visibility,3200 SF mixed-use building in the heart of Wheeling's vibrant corridor, currently operating as a professional real estate office. This meticulously renovated 2-story property offers ultimate versatility for office, retail, or restaurant use. Featuring a bright open-concept main floor with a fully equipped kitchen and service area. The second level provides additional residential space with three bedrooms and one full bathroom. Massive .31-acre lot includes 16 + dedicated parking spaces-a premium find on this high traffic thoroughfare. B-3 zoning allows for endless possibilities. Move your business here and command the attention your brand deserves!
Key facts
- B-3 zoning
- 0.31 acre lot
- Built 1926
Tags
Neighborhood map
What this means for you Summary
Snapshot
- This is a 4-bed/3.5-bath condo listed at $539k.
Deal economics
- At list price, monthly cash flow is $-2k ($-20k/yr) — negative.
- To cash-flow at today's rent, offer at most $244k (54.7% below list).
- To meet the 1% rule (rent ≥ 1% of price), the offer needs to be $277k (48.6% below list).
- Recommended offer: $244k (54.7% below list) — sets the bar for cash-flow.
- Cap rate 2.6% vs local median 3.8% in Wheeling — below-typical yield; the buyer is paying a premium for something (appreciation thesis, condition, location) that the cap rate doesn't capture.
Location & tenants
- Location reads 71/100 on livability (#335 in IL) — a middle-class / working-renter tenant base. Strengths: crime A+, commute A+, employment A+; Watch: amenities F, health & safety F.
- Township Hsd 214 (suburban): math 42% / reading 45% proficiency, ranked #103 of 620 in IL (top 17%) — families likely to look elsewhere, expect single-tenant / working-renter base with shorter leases.
- Zoned schools: Eugene Field Elem School (math 12% / reading 12%, grade F, #1,403 of 2,056 statewide, top 71%, 577 students, 0% FRL); Jack London Middle School (math 21% / reading 25%, grade F, #377 of 665 statewide, top 58%, 596 students, 0% FRL); Wheeling High School (math 25% / reading 30%, grade F, #215 of 693 statewide, top 31%, 1,760 students, 0% FRL).
- Zoned-school proficiency averages 21% at this address vs 44% district-wide (-23 pts) — the specific schools serving this property underperform the Township Hsd 214 average; the district grade overstates school quality for this exact location.
- Market conditions: Rents rising (+1.8%/yr); 61 active listings in the ZIP; solid renter incomes; 6,272 units permitted in Cook County in 2024 (4,658 in 5+ unit buildings).
- This rent runs 39% of the median local income ($85k/yr) — at the standard rent-burdened threshold; future hikes will face affordability resistance.
Forward outlook
- Local home prices are declining (-3.0%/yr); year-one equity from $4k of loan paydown is wiped out by about $16k of value loss. Plan a longer hold.
Negotiation context
- It's been on market 72 days — a 6% lower offer ($507k) is reasonable based on typical stale-listing flexibility.
- Current owner paid $450k; 20% above their basis — modest negotiation headroom, anchor on the comps not their cost.
Risks & watch-outs
- Watch-outs: built in 1926 — expect roof / HVAC / electrical / plumbing capex.
Questions for the listing agent
- What do current leases actually rent for vs. the listed asking? Can we see a recent rent roll and the last 12 months of T-12 income?
- It's been on market 72 days. Have you received any prior offers? Is the seller open to a 55% concession, seller financing, or rate buy-down credit?
- Built in 1926 — when were the roof, HVAC, electrical panel, plumbing, and water heater last replaced?
- Any open or pending special assessments — roof, HVAC, plumbing, elevator, façade? What's the per-unit balance and payoff schedule, and is the seller paying it off at close or rolling it to the buyer?
- Why hasn't it sold? Are there any deal-killer items the seller is aware of (foundation, flood, title, zoning, code violations)?
- Is there a deadline driving the sale (1031 exchange, divorce, estate, relocation)? That informs how much negotiation room exists.
- Schools are F-rated, which usually means shorter tenancies and higher turnover. Who's the typical renter profile here, and what's been the actual vacancy rate?
- The area grade is low — what's the realistic commute time and amenity access for the typical tenant pool here? Any planned neighborhood developments (good or bad) we should know about?
- What's the average days-on-market for RENTAL listings here right now (not sales)? A rising rental-DOM trend means longer vacancies and softer asking-rent achievability than the comps imply.
- What's the recent tenant-quality profile in this submarket — average credit score on applications, eviction rate, late-payment / NSF rate, and stable-employment percentage? A property-management company in the area should have these aggregated.
- How much new apartment / multifamily construction is in the pipeline within 1–3 miles? Heavy new supply (>2% of stock underway) typically softens rents 12–24 months out; light construction supports rent growth.
Investment metrics
- 1% rule
- 0.51% ✗
- Cap rate
- 2.57%
- Cash-on-cash
- -13.28%
- DSCR
- 0.41
- GRM
- 16.2
CMA / ARV
No comps found within radius.
Projected returns pro-forma
-3.0% appreciation · 1.75% rent growth · sell at horizon
- IRR
- -42.6%
- Equity multiple
- -0.31×
- Total profit
- $-197,020
- Equity at exit
- $80,367
- IRR
- -82.2%
- Equity multiple
- -1.13×
- Total profit
- $-321,780
- Equity at exit
- $46,603
Cash invested: $150,920 (down + closing). Projections, not guarantees.
Landlord ↔ Tenant lean methodology
- Overall (STATE)
- 43 Moderately Tenant-Leaning
- State Illinois
- 43 Moderately Tenant-Leaning · D+7
- County
- — inherits STATE
- City
- — inherits STATE
ZIP-level market 60090
- Rents YoY
- 1.8%
- Active inventory
- 61
- Price-to-rent
- 16.2×
Monthly cashflow live
- Estimated rent
- $2,768 medium interval (Pro) →
- Mortgage (P&I)
- −$2,827
- Tax from tax record
- −$805 /mo · $9,664/yr
- Insurance
- −$225
- HOA
- −$0
- Vacancy / Maint / Mgmt
- −$581
- Net cashflow
- $-1,670
Break-even live
Sensitivity live
| Price | -10% $-1,365 | -5% $-1,517 | +0% $-1,670 | +5% $-1,823 | +10% $-1,975 |
|---|---|---|---|---|---|
| Rent | -10% $-1,889 | -5% $-1,779 | +0% $-1,670 | +5% $-1,561 | +10% $-1,451 |
| Rate | -1.0pp $-1,399 | -0.5pp $-1,533 | base $-1,670 | +0.5pp $-1,810 | +1.0pp $-1,952 |
UW: 25.0% down · 7.5% · 30yr · 1.5% tax · 5.0% vac · 8.0% maint · 8.0% mgmt
Financing live
Cash to close
- Down payment
- $134,750
- Closing costs
- $16,170
- Reserves months
- —
- Total cash needed
- —
Loan-product check · same deal, 3 products live
Conventional
25% down · 7.5% · 30yr
- Down + closing
- —
- Monthly P&I
- —
- Monthly cashflow
- —
- DSCR
- —
- Eligible?
- —
Personal DTI + credit; lowest rate.
DSCR
20% down · 8.5% · 30yr
- Down + closing
- —
- Monthly P&I
- —
- Monthly cashflow
- —
- DSCR
- —
- Eligible?
- —
No personal income docs; deal must DSCR.
Hard money
10% down · 12.0% · 12mo
- Down + closing
- —
- Monthly P&I
- —
- Monthly cashflow
- —
- DSCR
- —
- Eligible?
- —
Short-term bridge; refi at stabilization.
HOA detail condo
- Monthly dues
- $0 · $0/yr
- Assessments
- None detected in remarks — confirm with the listing agent.
Listing history 19 events
-
2026-06-21days on market $539,000 Active 72 DOM
-
2026-06-18days on market $539,000 Active 69 DOM
-
2026-06-17days on market $539,000 Active 68 DOM
-
2026-06-16days on market $539,000 Active 67 DOM
-
2026-06-15days on market $539,000 Active 66 DOM
-
2026-06-13days on market $539,000 Active 64 DOM
-
2026-06-09days on market $539,000 Active 60 DOM
-
2026-06-08days on market $539,000 Active 59 DOM
-
2026-06-07days on market $539,000 Active 58 DOM
-
2026-06-04days on market $539,000 Active 55 DOM
-
2026-06-03days on market $539,000 Active 54 DOM
-
2026-06-02days on market $539,000 Active 53 DOM
-
2026-06-01days on market $539,000 Active 52 DOM
-
2026-05-31days on market $539,000 Active 51 DOM
-
2026-05-12price $539,000 714-char remark
Show marketing remark (714 chars)
Rare opportunity on Milwaukee Ave. High visibility,3200 SF mixed-use building in the heart of Wheeling's vibrant corridor, currently operating as a professional real estate office. This meticulously renovated 2-story property offers ultimate versatility for office, retail, or restaurant use. Featuring a bright open-concept main floor with a fully equipped kitchen and service area. The second level provides additional residential space with three bedrooms and one full bathroom. Massive .31-acre lot includes 16 + dedicated parking spaces-a premium find on this high traffic thoroughfare. B-3 zoning allows for endless possibilities. Move your business here and command the attention your brand deserves!
-
2026-04-10$569,900 Active 714-char remark
Show marketing remark (714 chars)
Rare opportunity on Milwaukee Ave. High visibility,3200 SF mixed-use building in the heart of Wheeling's vibrant corridor, currently operating as a professional real estate office. This meticulously renovated 2-story property offers ultimate versatility for office, retail, or restaurant use. Featuring a bright open-concept main floor with a fully equipped kitchen and service area. The second level provides additional residential space with three bedrooms and one full bathroom. Massive .31-acre lot includes 16 + dedicated parking spaces-a premium find on this high traffic thoroughfare. B-3 zoning allows for endless possibilities. Move your business here and command the attention your brand deserves!
-
2006-10-19soldstatus $450,000
-
1991-08-29soldstatus $210,000
-
1986-06-26soldstatus $115,000
ⓘ Source: listings_history table (triggers on properties + properties_extension) + one-shot
backfill from property_details.listing_events for pre-trigger history.
Tax reassessment forecast IL · Partial reset (capped growth)
- Current annual tax
- $9,664 · $805/mo
- Projected year-2 tax
- $10,950 · $912/mo
- Expected delta
- +$1,285/yr (+$107/mo · 13.3%)
ⓘ Screening estimate from a state-policy table — verify with the county assessor before closing.
Climate risk First Street
- Flood 1/10 Low FEMA zone X (unshaded) · 0% chance over 30 yrs
- Wildfire 1/10 Low
- Heat 3/10 Moderate 7 d/yr ≥99°F today · 14 d/yr by 30 yrs out
- Wind 2/10 Low
- Air quality 4/10 Moderate 4 unhealthy d/yr today · 4 by 30 yrs out
Nearby sold comps map
Loading sold comps map…
Walkable amenities ~0.75 mi
Loading nearby amenities…
Taxation est. · year 1
- Rental income
- $33,213
- − Mortgage interest
- −$30,192
- − Property taxes
- −$9,664
- − Insurance
- −$2,695
- − Repairs & maintenance
- −$2,657
- − Management
- −$2,657
- − Depreciation
- −$15,680
- Taxable loss
- −$30,333
- Est. tax savings @ 24.0%
- +$7,280
- After-tax cash flow
- $-12,760/yr
For passive investors: Depreciation is non-cash, so a rental often shows a tax loss while cash-flowing — sheltering income. Rental losses are passive: they offset passive income freely, and up to $25,000/yr can offset ordinary (W-2) income if you actively participate and your MAGI is under $100k (phasing out to $0 by $150k); unused losses carry forward. On sale, claimed depreciation is recaptured at up to 25%, and gains may owe capital-gains tax (a 1031 exchange can defer both). Figures are a year-1 estimate at your 24.0% rate — not tax advice; consult a CPA.
Schools (NCES district)
- District
- Township Hsd 214
- NCES district ID
- 1704170
- Math proficiency
- 42% ▼ -10.00%
- Reading proficiency
- 45% ▼ -4.00%
- Median HH income
- $68,267
- Composite
- 39.13/100
- National rank
- #4035
- State rank
- #103 of 620 in IL
Livability — Wheeling
- Score
- 71/100
- State rank
- #335
- US rank
- #6685
Category grades
Schools grade is shown separately in the Schools card above.
Census & demographics
- Census place
- Wheeling, IL
- County
- Cook County · 4,486,803 people
- City population
- 38,298
- Metro
- Chicago-Naperville-Elgin, IL-IN-WI
- Population (ZIP)
- 38,298
- Household income
- $85,355
- Rent vs Own
- Severe rent burden
- 1325.0
Population outlook (Cook County) Hauer SSP2
- Today (2025)
- 5,347,519 people
- By 2030
- 5,357,703 · +0.2%
- By 2040
- 5,324,924 · -0.4%
- By 2050
- 5,230,762 · -2.2%
- By 2075
- 4,785,735 · -10.5%
- By 2100
- 4,188,836 · -21.7%
Race, ethnicity, and origin ACS 2023
- Neighborhood character
- Diverse neighborhood (Simpson 0.65)
- Race & ethnicity
- White 47% Hispanic / Latino 32% Asian 16% Two or more races 9% Black 2% Native American 2%
- Hispanic origin (detail)
- Mexican 27%
- Common ancestry
- Romanian 6% Scotch-Irish 5% Subsaharan African 5%
- Foreign-born
- 45% · Canada, South Korea, China
- Languages at home
- 37% English-only · Spanish 29% Russian/Polish/Slavic 17% Other Indo-European 5%
Political lean MEDSL · Cook
- 2024 margin
- Solid D (+42.0) · D 70.4% · R 28.4% · Other 1.2%
- 2008→2024 swing
- -11.4pp toward R · 2008: 53.4pp · 2024: 42.0pp
- All cycles
- 2024: D+42.0 2020: D+50.3 2016: D+53.0 2012: D+49.4 2008: D+53.4
Not yet ingested
- Civics
- —
Market trends
- HPI YoY
- ▼ -238.28%
- Current HPI
- 209.9251
- Rent YoY
- ▲ 1.75%
- Metro
- Chicago-Naperville-Elgin, IL-IN-WI
- State GDP YoY
- ▲ 1.59%
- F500 in state
- 60
Industry mix (Fortune 500 HQ in IL)
| Industry | F500 HQs | Revenue |
|---|---|---|
| Insurance | 4 | $201B |
|
||
| Consumer Goods | 4 | $87B |
|
||
| Industrial Machinery | 3 | $64B |
|
||
| Healthcare | 2 | $55B |
|
||
| Retail / Pharmacy | 1 | $148B |
|
||
| Agriculture / Food | 1 | $86B |
|
||
Price history
+368.7% since first listed5 events — show timeline
- 2026-05-12 Price Changed $539,000 MRED as Distributed by MLS Grid
- 2026-04-10 Listed $569,900 MRED as Distributed by MLS Grid
- 2006-10-19 Sold (Public Records) $450,000 Public Records
- 1991-08-29 Sold (Public Records) $210,000 Public Records
- 1986-06-26 Sold (Public Records) $115,000 Public Records
Property tax history
-1.5%/yrLatest (2023): $9,664 · +4.9% YoY. Source: county tax records.
Cash-flow waterfall
monthlySold comps — $/sqft
last 12 mo · ≤1 miLoading sold comps…