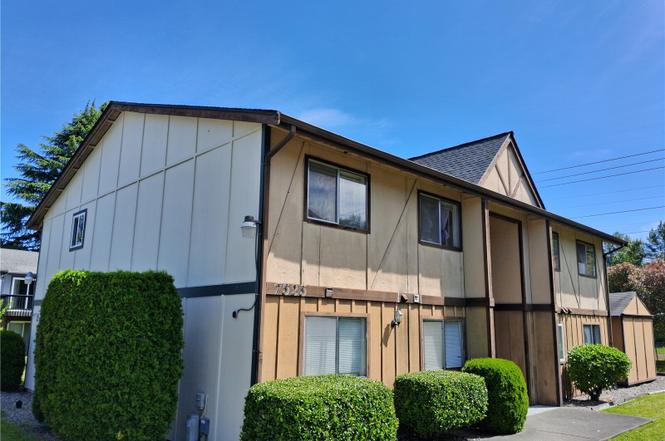
 Fourplex
7525 10th Avenue Ct E · Midland, WA
Flood risk 1/10 · Minimal
- FEMA flood zone
- X (unshaded)
- Chance of flooding over 30 yrs
- 0.0%
- Est. flood insurance / yr
- $507 – $1,088
Fire risk 1/10 · Minimal
- Est. fire insurance / yr
- $604 – $1,122
Heat risk 3/10 · Minor
- Hot days now (above 87°F)
- 7 days/yr
- Hot days in 30 yrs
- 13 days/yr
Wind risk 1/10 · Minimal
- Chance of severe wind over 30 yrs
- —
Air-quality risk 7/10 · Major
- Unhealthy air days now
- 10 days/yr
- Unhealthy air days in 30 yrs
- 12 days/yr
Risk factors via First Street. Map © Google.
Why this score? — see what drove the D- grade
The composite is a weighted blend of 9 inputs, each scored 0–100. Each bar is that input's sub-score; the figure is the points it added to the 100-point composite (weight × sub-score).
- Cash flow +14.4/30.0
- DSCR +4.4/10.0
- Schools +3.9/10.0
- 1% rule +3.7/10.0
- Livability +3.6/5.0
- ARV discount +3.2/15.0
- Rent growth +2.9/5.0
- Condition / age +2.5/5.0
- Appreciation +0.0/10.0
$749,950
🖨 Deal sheet (PDF) 📄 Offer letter ✓ Due diligence
Multi-family units
County records classify this as Multi-Family (2-4 Unit). Listing-text estimate: 4 units. confirmed
Listing remarks
Investor opportunity! Well-maintained 4-plex featuring four 2-bedroom, 1-bath units in a convenient Tacoma location. Strong value-add potential with long-term tenants and significantly below-market rents, offering investors the opportunity to increase cash flow over time. Current ownership has intentionally kept rents low for many years, creating substantial upside for future ownership. Recent major capital improvement includes a new roof installed in 2025. Each unit offers functional layouts, off-street parking, and strong rental demand in the area. Ideal for investors seeking stable occupancy today with the ability to enhance returns through future rent adjustments. Conveniently located n
Key facts
- Strong rental demand
- Convenient location
- Off-street parking
Tags
Property features AI
Finance
- Other: Calculated building area approximately 3,306 square feet; Lot approximately 0.2947 acres
- Financial info: Total of 4 units; Total monthly income reported as $3,325; Individual current rents listed: three units at $850 and one unit at $775; Acceptable financing: Cash, Conventional, FHA, VA
Exterior
- Parking: Four carport spaces; Five uncovered parking spaces
- Utilities: Public water; Sewer connected; Electric power
- Home design: Quadruplex (4-plex), 2-story building; Residential income / multi-family property; Electric energy source
- Construction: Wood construction; Composition (asphalt) roof; Effective year built 1986
- Exterior features: Wood products siding
Interior
- Kitchen: Each unit includes a range/oven; Each unit includes a refrigerator; Each unit includes a dishwasher
- Bedrooms: Each unit has 2 bedrooms
- Bathrooms: Each unit has 1 bathroom
- Heating & cooling: Baseboard heating; No central cooling
- Interior features: Fireplaces in each unit (one per unit)
- Laundry & utility: Each unit includes a washer and dryer
Neighborhood map
What this means for you Summary
Snapshot
- This is a 4 × 2-bed/1.0-bath units multifamily listed at $750k.
Deal economics
- At list price, monthly cash flow is $144 ($2k/yr) — positive. Per door: $36/mo.
- The deal already cash-flows at list — no discount required.
- To meet the 1% rule (rent ≥ 1% of price), the offer needs to be $655k (12.6% below list).
- Recommended offer: $655k (12.6% below list) — sets the bar for 1% rule.
- Cap rate 6.5% vs local median 3.2% in Midland — top-decile yield for the area; either an underpriced asset or a hidden risk that comps aren't pricing in. Stress-test before assuming the spread holds.
Location & tenants
- Location reads 72/100 on livability (#208 in WA) — a middle-class / working-renter tenant base. Strengths: housing A+, health & safety A+; Watch: crime D, amenities F.
- Franklin Pierce School District (suburban): math 35% / reading 51% proficiency, ranked #197 of 291 in WA (top 68%) — families likely to look elsewhere, expect single-tenant / working-renter base with shorter leases.
- Zoned schools: Harvard Elementary (408 students, 75% FRL); Morris Ford Middle School (882 students, 64% FRL); Franklin Pierce High School (1,141 students, 59% FRL).
- Market conditions: Rents rising (+1.6%/yr); 182 active listings in the ZIP; solid renter incomes; 3,209 units permitted in Pierce County in 2024 (1,269 in 5+ unit buildings).
- At $6,553/mo this rent would consume 96% of the median local household income ($82k/yr) (locally 989% of renters already pay >50% of income on rent) — very limited rent-growth headroom before tenants either downsize or default.
Forward outlook
- Local home prices are declining (-3.0%/yr); year-one equity from $5k of loan paydown is wiped out by about $22k of value loss. Plan a longer hold.
- Pierce County population projected at +26% by 2050 — long-run rental-demand tailwind backs the buy-and-hold thesis.
Negotiation context
- Only 4 days on market — expect competitive offers; lowballing is unlikely to land.
- 4 sale attempts since 24y ago with the ask held roughly flat each time — persistent listings suggest the price (not the market) is what's stuck; bring a comps-based counter.
- Current owner paid $285k; list at $750k implies a 163% gain — meaningful room to come down on a strong offer.
Questions for the listing agent
- Can we see the unit-by-unit rent roll, current vacancy, and any below-market leases? What's the average tenancy length?
- What capital expenditures (roof, boiler, parking lot, exteriors) have been made in the last 5 years, and what's planned in the next 2?
- Is there a deadline driving the sale (1031 exchange, divorce, estate, relocation)? That informs how much negotiation room exists.
- Schools are F-rated, which usually means shorter tenancies and higher turnover. Who's the typical renter profile here, and what's been the actual vacancy rate?
- Crime grade is D in this area — have there been break-ins, vandalism, or insurance claims at this property in the last 3 years? What carrier currently insures it and at what premium?
- The area grade is low — what's the realistic commute time and amenity access for the typical tenant pool here? Any planned neighborhood developments (good or bad) we should know about?
- What's the average days-on-market for RENTAL listings here right now (not sales)? A rising rental-DOM trend means longer vacancies and softer asking-rent achievability than the comps imply.
- What's the recent tenant-quality profile in this submarket — average credit score on applications, eviction rate, late-payment / NSF rate, and stable-employment percentage? A property-management company in the area should have these aggregated.
- How much new apartment / multifamily construction is in the pipeline within 1–3 miles? Heavy new supply (>2% of stock underway) typically softens rents 12–24 months out; light construction supports rent growth.
Investment metrics
- 1% rule
- 0.87% ✗
- Cap rate
- 6.52%
- Cash-on-cash
- 0.83%
- DSCR
- 1.04
- GRM
- 9.5
CMA / ARV
- ARV (on-the-fly)
- $684,342
- Comps found
- 1
Show comp detail 1 sale within ~0.75 mi
| Address | Dist | Beds/Ba | Sqft | Sold | Price | $/sf | Match |
|---|---|---|---|---|---|---|---|
| 7523 10 Avenue Ct E | 0.02mi | 8/4.0 | 3,606 (+9%) | 13mo | $744,950 | $207 | 73 |
Match score weights: distance 35% · size 25% · config 20% · recency 20%. Top-matched comps best support the ARV.
Projected returns pro-forma
-3.0% appreciation · 1.64% rent growth · sell at horizon
- IRR
- -16.5%
- Equity multiple
- 0.42×
- Total profit
- $-121,165
- Equity at exit
- $111,820
- IRR
- -10.8%
- Equity multiple
- 0.39×
- Total profit
- $-128,960
- Equity at exit
- $64,842
Cash invested: $209,986 (down + closing). Projections, not guarantees.
Landlord ↔ Tenant lean methodology
- Overall (STATE)
- 28 Tenant-Leaning
- State Washington
- 28 Tenant-Leaning · D+8
- County
- — inherits STATE
- City
- — inherits STATE
ZIP-level market 98404
- Rents YoY
- 1.6%
- Active inventory
- 182
- Price-to-rent
- 38.1×
Monthly cashflow live
- Estimated rent
- $6,553 high interval (Pro) →
- Mortgage (P&I)
- −$3,933
- Tax from tax record
- −$787 /mo · $9,445/yr
- Insurance
- −$312
- HOA
- −$0
- Vacancy / Maint / Mgmt
- −$1,376
- Net cashflow
- $144
Break-even live
Sensitivity live
| Price | -10% $569 | -5% $357 | +0% $144 | +5% $-68 | +10% $-280 |
|---|---|---|---|---|---|
| Rent | -10% $-373 | -5% $-114 | +0% $144 | +5% $403 | +10% $662 |
| Rate | -1.0pp $522 | -0.5pp $335 | base $144 | +0.5pp $-50 | +1.0pp $-248 |
4-unit breakdown (identical units grouped — click to expand)
| Units | Beds | Baths | Est. rent |
|---|---|---|---|
| 4× units | 2 | 1 | $6,552 |
| #1 | 2 | 1 | $1,638 |
| #2 | 2 | 1 | $1,638 |
| #3 | 2 | 1 | $1,638 |
| #4 | 2 | 1 | $1,638 |
| Total (4 units) | $6,553 | ||
UW: 25.0% down · 7.5% · 30yr · 1.5% tax · 5.0% vac · 8.0% maint · 8.0% mgmt
Financing live
Cash to close
- Down payment
- $187,488
- Closing costs
- $22,498
- Reserves months
- —
- Total cash needed
- —
Loan-product check · same deal, 3 products live
Conventional
25% down · 7.5% · 30yr
- Down + closing
- —
- Monthly P&I
- —
- Monthly cashflow
- —
- DSCR
- —
- Eligible?
- —
Personal DTI + credit; lowest rate.
DSCR
20% down · 8.5% · 30yr
- Down + closing
- —
- Monthly P&I
- —
- Monthly cashflow
- —
- DSCR
- —
- Eligible?
- —
No personal income docs; deal must DSCR.
Hard money
10% down · 12.0% · 12mo
- Down + closing
- —
- Monthly P&I
- —
- Monthly cashflow
- —
- DSCR
- —
- Eligible?
- —
Short-term bridge; refi at stabilization.
Listing history 3 events
-
2026-06-21days on market $749,950 Active 4 DOM
-
2026-06-17remarks 699-char remark
-
2026-06-17$749,950 Active 1 DOM
ⓘ Source: listings_history table (triggers on properties + properties_extension) + one-shot
backfill from property_details.listing_events for pre-trigger history.
Tax reassessment forecast WA · Resets to sale price
- Current annual tax
- $9,445 · $787/mo
- Projected year-2 tax
- $9,445 · $787/mo
- Expected delta
- $0/yr ($0/mo · 0.0%)
ⓘ Screening estimate from a state-policy table — verify with the county assessor before closing.
Climate risk First Street
- Flood 1/10 Low FEMA zone X (unshaded) · 0% chance over 30 yrs
- Wildfire 1/10 Low
- Heat 3/10 Moderate 7 d/yr ≥87°F today · 13 d/yr by 30 yrs out
- Wind 1/10 Low
- Air quality 7/10 Severe 10 unhealthy d/yr today · 12 by 30 yrs out
Nearby sold comps map
Loading sold comps map…
Walkable amenities ~0.75 mi
Loading nearby amenities…
Taxation est. · year 1
- Rental income
- $78,636
- − Mortgage interest
- −$42,009
- − Property taxes
- −$9,445
- − Insurance
- −$3,750
- − Repairs & maintenance
- −$6,291
- − Management
- −$6,291
- − Depreciation
- −$21,817
- Taxable loss
- −$10,967
- Est. tax savings @ 24.0%
- +$2,632
- After-tax cash flow
- $4,365/yr
For passive investors: Depreciation is non-cash, so a rental often shows a tax loss while cash-flowing — sheltering income. Rental losses are passive: they offset passive income freely, and up to $25,000/yr can offset ordinary (W-2) income if you actively participate and your MAGI is under $100k (phasing out to $0 by $150k); unused losses carry forward. On sale, claimed depreciation is recaptured at up to 25%, and gains may owe capital-gains tax (a 1031 exchange can defer both). Figures are a year-1 estimate at your 24.0% rate — not tax advice; consult a CPA.
Schools (NCES district)
- District
- Franklin Pierce School District
- NCES district ID
- 5302940
- Math proficiency
- 35% ▬ 0.00%
- Reading proficiency
- 51% ▲ 2.00%
- Median HH income
- $49,240
- Composite
- 39.18/100
- National rank
- #8227
- State rank
- #197 of 291 in WA
Livability — Midland
- Score
- 72/100
- State rank
- #208
- US rank
- #5731
Category grades
Schools grade is shown separately in the Schools card above.
Census & demographics
- Census place
- Midland, WA
- County
- Pierce County · 788,257 people
- Metro
- Seattle-Tacoma-Bellevue, WA
- Population (ZIP)
- 35,961
- Household income
- $82,191
- Rent vs Own
- Severe rent burden
- 989.0
Population outlook (Pierce County) Hauer SSP2
- Today (2025)
- 956,648 people
- By 2030
- 1,010,862 · +5.7%
- By 2040
- 1,113,170 · +16.4%
- By 2050
- 1,206,524 · +26.1%
- By 2075
- 1,436,425 · +50.2%
- By 2100
- 1,563,654 · +63.5%
Race, ethnicity, and origin ACS 2023
- Neighborhood character
- Highly diverse neighborhood (Simpson 0.77)
- Race & ethnicity
- White 38% Hispanic / Latino 20% Asian 17% Two or more races 16% Black 11% Native American 3% Pacific Islander 1%
- Hispanic origin (detail)
- Mexican 16% Puerto Rican 1%
- Common ancestry
- Italian 3% Portuguese 2% Slovak 1%
- Foreign-born
- 20% · Canada, Vietnam, South Korea
- Languages at home
- 68% English-only · Spanish 13% Other Asian/Pacific 7% Vietnamese 4%
Political lean MEDSL · Pierce
- 2024 margin
- D (+10.8) · D 53.9% · R 43.1% · Other 3.0%
- 2008→2024 swing
- -1.4pp toward R · 2008: 12.2pp · 2024: 10.8pp
- All cycles
- 2024: D+10.8 2020: D+11.2 2016: D+7.5 2012: D+11.0 2008: D+12.2
Not yet ingested
- Civics
- —
Market trends
- HPI YoY
- ▼ -462.09%
- Current HPI
- 360.0843
- Rent YoY
- ▲ 1.64%
- Metro
- Seattle-Tacoma-Bellevue, WA
- State GDP YoY
- ▲ 4.65%
- F500 in state
- 22
Industry mix (Fortune 500 HQ in WA)
| Industry | F500 HQs | Revenue |
|---|---|---|
| Retail | 2 | $269B |
|
||
| Technology / Retail | 1 | $638B |
|
||
| Technology | 1 | $245B |
|
||
| Telecommunications | 1 | $38B |
|
||
| Food / Beverage | 1 | $36B |
|
||
| Automotive / Trucks | 1 | $34B |
|
||
Price history
+275.0% since first listed14 events — show timeline
- 2026-06-17 Listed $749,950 NWMLS as Distributed by MLS Grid
- 2004-05-25 Sold (Public Records) $285,000 Public Records
- 2004-05-21 Sold (MLS) $285,000 NWMLS as Distributed by MLS Grid
- 2004-04-18 Listed $289,500 NWMLS as Distributed by MLS Grid
- 2003-04-09 Sold (Public Records) $260,000 Public Records
- 2003-04-08 Sold (MLS) $260,000 NWMLS as Distributed by MLS Grid
- 2003-01-07 Listed $295,000 NWMLS as Distributed by MLS Grid
- 2002-03-08 Sold (MLS) $162,000 NWMLS as Distributed by MLS Grid
- 2002-01-15 Listed $155,900 NWMLS as Distributed by MLS Grid
- 1998-03-30 Sold (Public Records) $146,900 Public Records
- 1998-03-30 Sold (Public Records) $146,900 Public Records
- 1994-11-08 Sold (Public Records) $145,000 Public Records
- 1991-10-07 Sold (Public Records) $133,000 Public Records
- 1985-11-07 Sold (Public Records) $200,000 Public Records
Property tax history
+5.1%/yrLatest (2026): $9,445 · +3.7% YoY. Source: county tax records.
Cash-flow waterfall
monthlySold comps — $/sqft
last 12 mo · ≤1 miLoading sold comps…