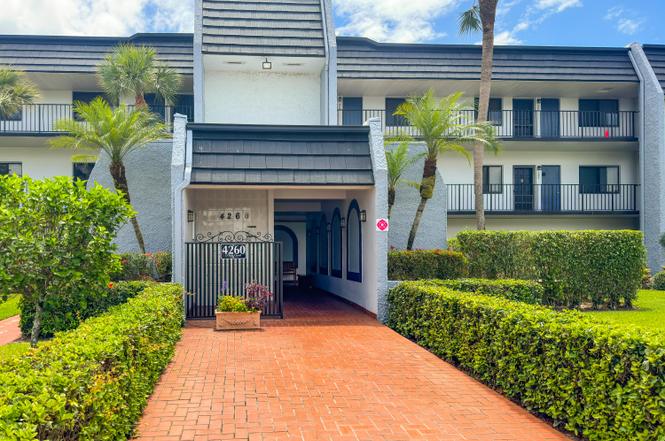
4260 Deste Ct #205 · Greenacres, FL
Flood risk 1/10 · Minimal
- FEMA flood zone
- X (unshaded)
- Chance of flooding over 30 yrs
- 0.0%
- Est. flood insurance / yr
- $507 – $1,088
Fire risk 1/10 · Minimal
- Est. fire insurance / yr
- $947 – $1,759
Heat risk 9/10 · Severe
- Hot days now (above 106°F)
- 6 days/yr
- Hot days in 30 yrs
- 22 days/yr
Wind risk 10/10 · Severe
- Chance of severe wind over 30 yrs
- 99.0%
Air-quality risk 2/10 · Minimal
- Unhealthy air days now
- 0 days/yr
- Unhealthy air days in 30 yrs
- 2 days/yr
Risk factors via First Street. Map © Google.
Why this score? — see what drove the C- grade
The composite is a weighted blend of 9 inputs, each scored 0–100. Each bar is that input's sub-score; the figure is the points it added to the 100-point composite (weight × sub-score).
- Cash flow +16.4/30.0
- 1% rule +9.4/10.0
- ARV discount +7.5/15.0
- DSCR +5.1/10.0
- Schools +4.3/10.0
- Condition / age +3.8/5.0
- Livability +3.5/5.0
- Rent growth +2.4/5.0
- Appreciation +0.0/10.0
$128,000
🖨 Deal sheet 📄 Offer letter ✓ Due diligence
Listing remarks
Well-maintained and furnished 1-bedroom condo featuring a private balcony with peaceful landscaped views. Enjoy resort-style living in a gated community with a community pool, beautifully maintained grounds, and 24/7 security patrol. The building features a newer roof, approximately 2 years old. HOA includes internet, cable, and water for added convenience. On-site laundry facilities are located on the first floor. Conveniently located near shopping, dining, and everyday amenities. Move-in ready and easy to show!
Key facts
- Gated community
- Community pool
- Private balcony
Tags
Property features AI
Finance
- Other: Association amenities include parking and pool
- Financial info: Pets not allowed
- HOA & community: Community association (GRS) with monthly fee; HOA fees cover cable TV, internet, grounds maintenance, structure maintenance, security, sewer, trash, water, common areas, common real estate tax, elevator, roof repairs, pool service, and parking; Monthly association fee
Exterior
- Parking: 2 parking spaces (common parking)
- Security: Association provides security
- Utilities: Public water; Public sewer; Sewer connected; Water connected; Cable available; Electric service (electric utilities available)
- Home design: Condominium; Resale condition; 3-story building; Faces north
- Construction: Built with CBS construction
- Exterior features: Not waterfront; Flat roof
Interior
- Kitchen: Electric range; Microwave; Dishwasher; Refrigerator; Electric water heater
- Bedrooms: 1 bedroom on main level
- Flooring: Tile
- Bathrooms: 1 full bathroom (main level)
- Heating & cooling: Central heating (electric); Central air; Ceiling fan(s)
- Interior features: Walk-in closet(s); Furnished
- Laundry & utility: Common area laundry
Neighborhood map
What this means for you Summary
Snapshot
- This is a 1-bed/1.0-bath condo listed at $128k. Condition is rated good.
Deal economics
- At list price, monthly cash flow is $72 ($859/yr) — positive.
- The deal already cash-flows at list — no discount required.
- Meets the 1% rule at list price ($2k rent vs $128k).
Location & tenants
- Location reads 69/100 on livability (#490 in FL) — a middle-class / working-renter tenant base. Strengths: cost of living A+, housing A+, health & safety A; Watch: employment D, amenities F, commute F.
- Palm Beach (suburban): math 46% / reading 53% proficiency, ranked #34 of 73 in FL (top 47%) — families likely to look elsewhere, expect single-tenant / working-renter base with shorter leases.
- Zoned schools: Heritage Elementary School (math 35% / reading 39%, grade F, #1,609 of 2,144 statewide, top 77%, 786 students, 75% FRL); Woodlands Middle School (math 51% / reading 58%, grade B-, #183 of 571 statewide, top 34%, 1,551 students, 40% FRL).
- Market conditions: Rents soft (-0.4%/yr); 651 active listings in the ZIP; 13 comparable units currently listed for rent nearby; rentals at typical pace (median 17d on market — plan ~3-4 weeks tenant-placement turnaround); solid renter incomes; 3,974 units permitted in Palm Beach County in 2024 (1,012 in 5+ unit buildings).
Forward outlook
- Local home prices are declining (-3.0%/yr); year-one equity from $885 of loan paydown is wiped out by about $4k of value loss. Plan a longer hold.
- Palm Beach County population projected at +30% by 2050 — long-run rental-demand tailwind backs the buy-and-hold thesis.
Negotiation context
- Only 7 days on market — expect competitive offers; lowballing is unlikely to land.
Risks & watch-outs
- Watch-outs: HOA is 27% of rent.
- Climate carrying-cost: severe wind risk, 99% chance of damaging wind over 30y; extreme-heat days projected 6→22/yr by 2055 (HVAC capex compounding) — expect insurance premiums to compound above CPI over the hold.
Questions for the listing agent
- Built in 1974 — when were the roof, HVAC, electrical panel, plumbing, and water heater last replaced?
- What does the HOA fee cover, when was the last increase, and are there any pending special assessments or reserve-fund shortfalls?
- Any open or pending special assessments — roof, HVAC, plumbing, elevator, façade? What's the per-unit balance and payoff schedule, and is the seller paying it off at close or rolling it to the buyer?
- Is there a deadline driving the sale (1031 exchange, divorce, estate, relocation)? That informs how much negotiation room exists.
- Schools are D-rated, which usually means shorter tenancies and higher turnover. Who's the typical renter profile here, and what's been the actual vacancy rate?
- What's the average days-on-market for RENTAL listings here right now (not sales)? A rising rental-DOM trend means longer vacancies and softer asking-rent achievability than the comps imply.
- What's the recent tenant-quality profile in this submarket — average credit score on applications, eviction rate, late-payment / NSF rate, and stable-employment percentage? A property-management company in the area should have these aggregated.
- How much new apartment / multifamily construction is in the pipeline within 1–3 miles? Heavy new supply (>2% of stock underway) typically softens rents 12–24 months out; light construction supports rent growth.
Investment metrics
- 1% rule
- 1.44% ✓
- Cap rate
- 6.96%
- Cash-on-cash
- 2.40%
- DSCR
- 1.11
- GRM
- 5.8
CMA / ARV
No comps found within radius.
Projected returns pro-forma
-3.0% appreciation · 0.0% rent growth · sell at horizon
- IRR
- -17.5%
- Equity multiple
- 0.41×
- Total profit
- $-21,266
- Equity at exit
- $19,085
- IRR
- -22.5%
- Equity multiple
- 0.10×
- Total profit
- $-32,223
- Equity at exit
- $11,067
Cash invested: $35,840 (down + closing). Projections, not guarantees.
Landlord ↔ Tenant lean methodology
- Overall (STATE)
- 87 Strongly Landlord-Friendly
- State Florida
- 87 Strongly Landlord-Friendly · R+3
- County
- — inherits STATE
- City
- — inherits STATE
ZIP-level market 33467
- Rents YoY
- -0.4%
- Active inventory
- 651
- Price-to-rent
- 5.8×
Monthly cashflow live
- Estimated rent
- $1,850 high interval (Pro) →
- Mortgage (P&I)
- −$671
- Tax est. 1.5%
- −$160 /mo · $1,920/yr
- Insurance
- −$53
- HOA
- −$505
- Vacancy / Maint / Mgmt
- −$388
- Net cashflow
- $72
Break-even live
UW: 25.0% down · 7.5% · 30yr · 1.5% tax · 5.0% vac · 8.0% maint · 8.0% mgmt
Financing live
Cash to close
- Down payment
- $32,000
- Closing costs
- $3,840
- Reserves months
- —
- Total cash needed
- —
Loan-product check · same deal, 3 products live
Conventional
25% down · 7.5% · 30yr
- Down + closing
- —
- Monthly P&I
- —
- Monthly cashflow
- —
- DSCR
- —
- Eligible?
- —
Personal DTI + credit; lowest rate.
DSCR
20% down · 8.5% · 30yr
- Down + closing
- —
- Monthly P&I
- —
- Monthly cashflow
- —
- DSCR
- —
- Eligible?
- —
No personal income docs; deal must DSCR.
Hard money
10% down · 12.0% · 12mo
- Down + closing
- —
- Monthly P&I
- —
- Monthly cashflow
- —
- DSCR
- —
- Eligible?
- —
Short-term bridge; refi at stabilization.
Rent comps 13 comps
| Address | Beds | Baths | Sqft | Rent | $/sqft | DOM | Units | Dist |
|---|---|---|---|---|---|---|---|---|
| 4254 Deste Ct #305 Greenacres, FL | 1.0 | 1.0 | 716 | $1,500 | $2.09 | 24d | 1 | 0.07mi |
| 4236 Deste Ct #108 Greenacres, FL | 1.0 | 1.0 | 716 | $1,800 | $2.51 | 17d | 1 | 0.20mi |
| 4284 Deste Ct #304 Greenacres, FL | 1.0 | 1.0 | 716 | $2,200 | $3.07 | 16d | 1 | 0.23mi |
| 4230 Deste Ct Unit 305 Greenacres, FL | 1.0 | 1.0 | 716 | $1,900 | $2.65 | 5d | 1 | 0.26mi |
| 446 Pine Glen Ln Unit A1 Greenacres, FL | 1.0 | 1.0 | 614 | $1,550 | $2.52 | 14d | 1 | 0.30mi |
| 4120 Tivoli Ct #305 Lake Worth, FL | 1.0 | 1.0 | 704 | $1,750 | $2.49 | 24d | 1 | 0.36mi |
| 7091 Golf Colony Ct #201 Lake Worth, FL | 2.0 | 2.0 | 735 | $1,850 | $2.52 | 13d | 1 | 0.58mi |
| 7137 Golf Colony Ct #202 Lake Worth, FL | 2.0 | 2.0 | 735 | $2,000 | $2.72 | 3d | 1 | 0.63mi |
| 7137 Golf Colony Ct #202 Lake Worth, FL | 2.0 | 2.0 | 735 | $1,995 | $2.71 | 14d | 1 | 0.63mi |
| 7178 Golf Colony Ct #101 Lake Worth, FL | 2.0 | 2.0 | 735 | $1,700 | $2.31 | 24d | 1 | 0.69mi |
| 133 Lake Pine Cir Unit B1 Greenacres, FL | 1.0 | 1.0 | 639 | $1,450 | $2.27 | 24d | 1 | 0.80mi |
| 133 Lake Pine Cir Greenacres, FL | 1.0 | 1.0 | 639 | $1,300 | $2.03 | 18d | 1 | 0.80mi |
| 5855 S 37th St Unit 5857 Greenacres, FL | 2.0 | 1.0 | 747 | $1,974 | $2.64 | 7d | 1 | 1.22mi |
HOA detail condo
- Monthly dues
- $505 · $6,060/yr
- Likely covers
- waterinternetcablelandscapingpoolsecurity
- Assessments
- None detected in remarks — confirm with the listing agent.
Listing history 6 events
-
2026-06-18days on market $128,000 Active 7 DOM
-
2026-06-17days on market $128,000 Active 6 DOM
-
2026-06-16days on market $128,000 Active 5 DOM
-
2026-06-15days on market $128,000 Active 4 DOM
-
2026-06-13remarks 518-char remark
-
2026-06-13$128,000 Active 2 DOM
ⓘ Source: listings_history table (triggers on properties + properties_extension) + one-shot
backfill from property_details.listing_events for pre-trigger history.
Climate risk First Street
- Flood 1/10 Low FEMA zone X (unshaded) · 0% chance over 30 yrs
- Wildfire 1/10 Low
- Heat 9/10 Extreme 6 d/yr ≥106°F today · 22 d/yr by 30 yrs out
- Wind 10/10 Extreme 99% chance of damaging wind over 30 yrs
- Air quality 2/10 Low 0 unhealthy d/yr today · 2 by 30 yrs out
Nearby sold comps map
Loading sold comps map…
Walkable amenities ~0.75 mi
Loading nearby amenities…
Taxation est. · year 1
- Rental income
- $22,194
- − Mortgage interest
- −$7,170
- − Property taxes
- −$1,920
- − Insurance
- −$640
- − Repairs & maintenance
- −$1,776
- − Management
- −$1,776
- − HOA
- −$6,060
- − Depreciation
- −$3,724
- Taxable loss
- −$870
- Est. tax savings @ 24.0%
- +$209
- After-tax cash flow
- $1,068/yr
For passive investors: Depreciation is non-cash, so a rental often shows a tax loss while cash-flowing — sheltering income. Rental losses are passive: they offset passive income freely, and up to $25,000/yr can offset ordinary (W-2) income if you actively participate and your MAGI is under $100k (phasing out to $0 by $150k); unused losses carry forward. On sale, claimed depreciation is recaptured at up to 25%, and gains may owe capital-gains tax (a 1031 exchange can defer both). Figures are a year-1 estimate at your 24.0% rate — not tax advice; consult a CPA.
Condition & rehab AI · 13 photos
This well-maintained and furnished 1-bedroom condo is move-in ready with a private balcony and resort-style living in a gated community. The newer roof and well-maintained landscaping add to its value.
Repairs flagged
- Minor Paint — Some wear on interior walls
- Minor Flooring — Tiled floors in common areas
Value-add opportunities
- Both Paint interior walls — Enhances curb appeal and interior aesthetics
- Both Replace flooring in common areas — Improves durability and appearance
Renovation cost estimate screening
| Repair item | Severity | Est. cost |
|---|---|---|
| Paint · Some wear on interior walls | Minor | $500–3,000 |
| Flooring · Tiled floors in common areas | Minor | $500–3,000 |
| Total estimated repair cost · 2 items | $1,000–6,000 |
Value-add ROI direction
- Both Paint interior walls — Enhances curb appeal and interior aesthetics ↑
- Both Replace flooring in common areas — Improves durability and appearance ↑
ⓘ Cost ranges are severity-bucket heuristics (US national rule-of-thumb). Get contractor quotes + a written scope before underwriting a rehab budget.
Schools (NCES district)
- District
- Palm Beach
- NCES district ID
- 1201500
- Math proficiency
- 46% ▼ -16.00%
- Reading proficiency
- 53% ▼ -4.00%
- Median HH income
- $53,943
- Composite
- 42.72/100
- National rank
- #3160
- State rank
- #34 of 73 in FL
Livability — Greenacres
- Score
- 69/100
- State rank
- #490
- US rank
- #9008
Category grades
Schools grade is shown separately in the Schools card above.
Census & demographics
- County
- Palm Beach County · 1,438,312 people
- City population
- 60,184
- Metro
- Miami-Fort Lauderdale-Pompano Beach, FL
- Population (ZIP)
- 58,411
- Household income
- $95,739
- Rent vs Own
- Severe rent burden
- 960.0
Population outlook (Palm Beach County) Hauer SSP2
- Today (2025)
- 1,637,487 people
- By 2030
- 1,743,255 · +6.5%
- By 2040
- 1,948,712 · +19.0%
- By 2050
- 2,132,979 · +30.3%
- By 2075
- 2,530,027 · +54.5%
- By 2100
- 2,706,979 · +65.3%
Race, ethnicity, and origin ACS 2023
- Neighborhood character
- Diverse neighborhood (Simpson 0.59)
- Race & ethnicity
- White 59% Hispanic / Latino 22% Two or more races 13% Black 10% Asian 4%
- Hispanic origin (detail)
- Mexican 2% Puerto Rican 4% Cuban 4% Dominican 2%
- Common ancestry
- Romanian 4% Scotch-Irish 3% Hispanic 3%
- Foreign-born
- 24% · Canada, Jamaica, Vietnam
- Languages at home
- 71% English-only · Spanish 17% French/Haitian/Cajun 5% Other Indo-European 3%
Political lean MEDSL · Palm Beach
- 2024 margin
- Toss-up / Even · D 50.0% · R 49.2%
- 2008→2024 swing
- -22.1pp toward R · 2008: 22.9pp · 2024: 0.8pp
- All cycles
- 2024: D+0.8 2020: D+12.8 2016: D+15.3 2012: D+17.0 2008: D+22.9
Not yet ingested
- Civics
- —
Market trends
- HPI YoY
- ▼ -288.94%
- Current HPI
- 343.7738
- Rent YoY
- ▼ -0.40%
- Metro
- Miami-Fort Lauderdale-Pompano Beach, FL
- State GDP YoY
- ▲ 3.28%
- F500 in state
- 36
Industry mix (Fortune 500 HQ in FL)
| Industry | F500 HQs | Revenue |
|---|---|---|
| Industrial Technology | 2 | $29B |
|
||
| Insurance | 2 | $17B |
|
||
| Retail | 1 | $60B |
|
||
| Technology Distribution | 1 | $58B |
|
||
| Homebuilding | 1 | $35B |
|
||
| Technology Manufacturing | 1 | $35B |
|
||
Price history
1 event — show timeline
- 2026-06-10 Listed $128,000 Beaches MLS
Cash-flow waterfall
monthlySold comps — $/sqft
last 12 mo · ≤1 miLoading sold comps…