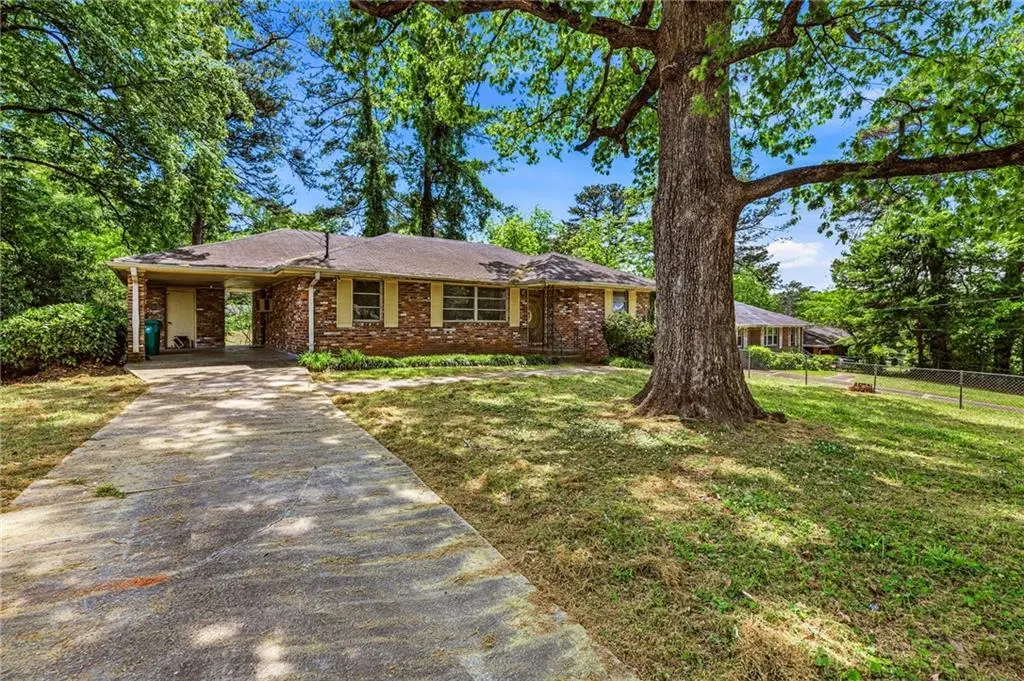
1949 Capri Dr · Candler-McAfee, GA
Flood risk 1/10 · Minimal
- FEMA flood zone
- X (unshaded)
- Chance of flooding over 30 yrs
- 0.0%
- Est. flood insurance / yr
- $507 – $1,088
Fire risk 1/10 · Minimal
- Est. fire insurance / yr
- $963 – $1,789
Heat risk 5/10 · Moderate
- Hot days now (above 104°F)
- 7 days/yr
- Hot days in 30 yrs
- 18 days/yr
Wind risk 5/10 · Moderate
- Chance of severe wind over 30 yrs
- 26.0%
Air-quality risk 5/10 · Moderate
- Unhealthy air days now
- 6 days/yr
- Unhealthy air days in 30 yrs
- 8 days/yr
Risk factors via First Street. Map © Google.
Why this score? — see what drove the D+ grade
The composite is a weighted blend of 9 inputs, each scored 0–100. Each bar is that input's sub-score; the figure is the points it added to the 100-point composite (weight × sub-score).
- ARV discount +15.0/15.0
- Cash flow +13.5/30.0
- DSCR +4.1/10.0
- Rent growth +2.8/5.0
- 1% rule +2.7/10.0
- Livability +2.5/5.0
- Condition / age +2.5/5.0
- Schools +2.1/10.0
- Appreciation +0.0/10.0
$275,000
🖨 Deal sheet (PDF) 📄 Offer letter ✓ Due diligence
Listing remarks
Welcome to 1949 Capri Drive- this beautiful 3-bedroom, 1.5-bathroom ranch-style home presents an incredible opportunity for investors, DIY enthusiasts, or anyone looking to create their dream home in Atlanta. Situated on a spacious lot, this property offers the perfect combination of classic charm and renovation potential. The home features a traditional layout with a large living area, ideal for cozy family gatherings or entertaining. The kitchen and bathrooms are ready for a transformation, allowing you to update and personalize the space to fit your style. The bedrooms are generously sized, providing plenty of room to make each one your own. One of the standout features of this home is t
Key facts
- Spacious lot
- Expansive backyard
- Renovation potential
Tags
Property features AI
Exterior
- Parking: Covered carport (1 space); Driveway parking; Open parking available
- Utilities: Public water; Public sewer; Electric service available; Natural gas available; Cable available
- Home design: One-level home; Brick on all sides; Fixer condition; Crawl space foundation; Shingle roof
- Construction: Brick construction; Pillar/post/pier foundation; Shingle roof; Built with four-sided brick
- Exterior features: Private entrance; Private yard
Interior
- Kitchen: Cabinets; Laminate countertops; Dishwasher
- Bedrooms: Three main-level bedrooms; Roommate floor plan and split bedroom plan
- Flooring: Hardwood floors
- Bathrooms: One full bathroom; One half bathroom (main level)
- Heating & cooling: Central air; Attic fan
- Interior features: Bay windows and decorative shutters; No shared/common walls; Other interior features
- Laundry & utility: Main-level laundry
Neighborhood map
What this means for you Summary
Snapshot
- This is a 3-bed/1.5-bath single-family listed at $275k.
Deal economics
- At list price, monthly cash flow is $12 ($146/yr) — positive.
- The deal already cash-flows at list — no discount required.
- To meet the 1% rule (rent ≥ 1% of price), the offer needs to be $211k (23.4% below list).
- Recommended offer: $211k (23.4% below list) — sets the bar for 1% rule.
- Cap rate 6.3% vs local median 4.2% in Candler-McAfee — top-decile yield for the area; either an underpriced asset or a hidden risk that comps aren't pricing in. Stress-test before assuming the spread holds.
Location & tenants
- Location reads: area grade D — affects rentability + tenant quality, not the cash-flow math above.
- Dekalb County (suburban): math 19% / reading 28% proficiency, ranked #125 of 174 in GA (top 72%) — low school quality limits family demand, transient renter base, plan for 1-2y turnover; 68% free/reduced lunch — lower-income household profile, screen leases tightly.
- Zoned schools: Ronald E Mcnair Discover Learning Academy Elementary School (math 2% / reading 8%, grade F, #1,160 of 1,228 statewide, top 98%, 568 students, 100% FRL); Mcnair Middle School (math 5% / reading 8%, grade F, #457 of 470 statewide, top 98%, 857 students, 100% FRL); Mcnair High School (math 2% / reading 5%, grade F, #413 of 424 statewide, top 99%, 768 students, 100% FRL) — zoned schools average 100% FRL vs 68% district-wide (32 pts higher); higher-poverty schools than district average — tighter screening recommended.
- Zoned-school proficiency averages 5% at this address vs 24% district-wide (-18 pts) — the specific schools serving this property underperform the Dekalb County average; the district grade overstates school quality for this exact location.
- Market conditions: Rents rising (+1.3%/yr); 431 active listings in the ZIP; 40 comparable units currently listed for rent nearby; rentals lingering (median 46d on market — plan ~5-8 weeks vacancy on turnover, expect pricing pressure); 50% of comp listings sitting > 30 days — soft ceiling on asking rent; 1,240 units permitted in DeKalb County in 2024 (385 in 5+ unit buildings).
- This rent runs 40% of the median local income ($63k/yr) — at the standard rent-burdened threshold; future hikes will face affordability resistance.
Forward outlook
- Local home prices are declining (-3.0%/yr); year-one equity from $2k of loan paydown is wiped out by about $8k of value loss. Plan a longer hold.
- DeKalb County population projected at +28% by 2050 — long-run rental-demand tailwind backs the buy-and-hold thesis.
Negotiation context
- Only 13 days on market — expect competitive offers; lowballing is unlikely to land.
Risks & watch-outs
- Watch-outs: built in 1956 — expect roof / HVAC / electrical / plumbing capex.
- Climate carrying-cost: moderate wind risk, 26% chance of damaging wind over 30y; extreme-heat days projected 7→18/yr by 2055 (HVAC capex compounding) — expect insurance premiums to compound above CPI over the hold.
Questions for the listing agent
- Built in 1956 — when were the roof, HVAC, electrical panel, plumbing, and water heater last replaced?
- Is there a deadline driving the sale (1031 exchange, divorce, estate, relocation)? That informs how much negotiation room exists.
- The area grade is low — what's the realistic commute time and amenity access for the typical tenant pool here? Any planned neighborhood developments (good or bad) we should know about?
- What's the average days-on-market for RENTAL listings here right now (not sales)? A rising rental-DOM trend means longer vacancies and softer asking-rent achievability than the comps imply.
- What's the recent tenant-quality profile in this submarket — average credit score on applications, eviction rate, late-payment / NSF rate, and stable-employment percentage? A property-management company in the area should have these aggregated.
- How much new for-sale + rental construction is in the pipeline within 1–3 miles? Heavy new supply typically softens prices + rents 12–24 months out; constrained supply supports both.
Investment metrics
- 1% rule
- 0.77% ✗
- Cap rate
- 6.35%
- Cash-on-cash
- 0.19%
- DSCR
- 1.01
- GRM
- 10.9
CMA / ARV
- ARV (median comp)
- $354,373
- List price
- $275,000
- Delta
- -22.40%
- Verdict
- UNDERPRICED
- Comps
- 20 within 1.0 mi
Show comp detail 12 sales within ~0.75 mi
| Address | Dist | Beds/Ba | Sqft | Sold | Price | $/sf | Match |
|---|---|---|---|---|---|---|---|
| 1949 Capri Dr | 0.00mi | 3/1.5 | 1,307 (0%) | 0mo | $265,000 | $203 | 100 |
| 1933 Camellia Dr | 0.27mi | 3/2.0 | 1,302 (-0%) | 2mo | $285,000 | $219 | 83 |
| 2283 Scotty Cir | 0.46mi | 3/2.0 | 1,298 (-1%) | 2mo | $309,000 | $238 | 74 |
| 2107 Second Ave | 0.33mi | 4/2.0 (+1) | 1,350 (+3%) | 1mo | $330,000 | $244 | 71 |
| 2112 Juanita St | 0.47mi | 2/2.0 (-1) | 1,344 (+3%) | 3mo | $312,000 | $232 | 64 |
| 2139 Trailwood Rd | 0.47mi | 4/2.0 (+1) | 1,357 (+4%) | 2mo | $231,000 | $170 | 64 |
| 2093 Wildrose | 0.71mi | 4/2.0 (+1) | 1,306 (-0%) | 2mo | $350,000 | $268 | 58 |
| 2134 Tilson Rd | 0.53mi | 3/2.0 | 1,200 (-8%) | 2mo | $268,500 | $224 | 58 |
| 1979 Bencal Dr SE | 0.73mi | 3/2.0 | 1,269 (-3%) | 2mo | $350,000 | $276 | 57 |
| 1978 Terry Mill Rd SE | 0.59mi | 3/2.0 | 1,425 (+9%) | 1mo | $385,000 | $270 | 55 |
| 2063 Juanita St | 0.44mi | 3/1.5 | 1,501 (+15%) | 1mo | $165,000 | $110 | 54 |
| 2177 Mark Trl | 0.54mi | 3/2.0 | 1,500 (+15%) | 2mo | $358,500 | $239 | 47 |
Match score weights: distance 35% · size 25% · config 20% · recency 20%. Top-matched comps best support the ARV.
Projected returns pro-forma
-3.0% appreciation · 1.34% rent growth · sell at horizon
- IRR
- -17.7%
- Equity multiple
- 0.38×
- Total profit
- $-47,367
- Equity at exit
- $41,003
- IRR
- -12.9%
- Equity multiple
- 0.29×
- Total profit
- $-54,476
- Equity at exit
- $23,777
Cash invested: $77,000 (down + closing). Projections, not guarantees.
Landlord ↔ Tenant lean methodology
- Overall (STATE)
- 90 Strongly Landlord-Friendly
- State Georgia
- 90 Strongly Landlord-Friendly · R+3
- County
- — inherits STATE
- City
- — inherits STATE
ZIP-level market 30032
- Rents YoY
- 1.3%
- Active inventory
- 431
- Price-to-rent
- 10.9×
Monthly cashflow live
- Estimated rent
- $2,107 high interval (Pro) →
- Mortgage (P&I)
- −$1,442
- Tax from tax record
- −$96 /mo · $1,146/yr
- Insurance
- −$115
- HOA
- −$0
- Vacancy / Maint / Mgmt
- −$442
- Net cashflow
- $12
Break-even live
Sensitivity live
| Price | -10% $168 | -5% $90 | +0% $12 | +5% $-66 | +10% $-143 |
|---|---|---|---|---|---|
| Rent | -10% $-154 | -5% $-71 | +0% $12 | +5% $95 | +10% $179 |
| Rate | -1.0pp $151 | -0.5pp $82 | base $12 | +0.5pp $-59 | +1.0pp $-132 |
UW: 25.0% down · 7.5% · 30yr · 1.5% tax · 5.0% vac · 8.0% maint · 8.0% mgmt
Financing live
Cash to close
- Down payment
- $68,750
- Closing costs
- $8,250
- Reserves months
- —
- Total cash needed
- —
Loan-product check · same deal, 3 products live
Conventional
25% down · 7.5% · 30yr
- Down + closing
- —
- Monthly P&I
- —
- Monthly cashflow
- —
- DSCR
- —
- Eligible?
- —
Personal DTI + credit; lowest rate.
DSCR
20% down · 8.5% · 30yr
- Down + closing
- —
- Monthly P&I
- —
- Monthly cashflow
- —
- DSCR
- —
- Eligible?
- —
No personal income docs; deal must DSCR.
Hard money
10% down · 12.0% · 12mo
- Down + closing
- —
- Monthly P&I
- —
- Monthly cashflow
- —
- DSCR
- —
- Eligible?
- —
Short-term bridge; refi at stabilization.
Rent comps 40 comps
| Address | Beds | Baths | Sqft | Rent | $/sqft | DOM | Units | Dist |
|---|---|---|---|---|---|---|---|---|
| 1916 Longdale Dr Decatur, GA | 3.0 | 2.0 | 1176 | $2,395 | $2.04 | 45d | 1 | 0.20mi |
| 2176 Lilac Ln Decatur, GA | 3.0 | 2.0 | 1800 | $1,395 | $0.78 | 26d | 1 | 0.27mi |
| 2163 Lilac Ln Decatur, GA | 3.0 | 2.0 | 1107 | $2,150 | $1.94 | 45d | 1 | 0.28mi |
| 2123 Second Ave Decatur, GA | 4.0 | 2.0 | 1302 | $2,075 | $1.59 | 20d | 1 | 0.32mi |
| 2181 Juanita St Decatur, GA | 4.0 | 3.0 | 1595 | $3,500 | $2.19 | 26d | 1 | 0.39mi |
| 1840 Camellia Dr Decatur, GA | 3.0 | 2.0 | 1394 | $2,100 | $1.51 | 45d | 1 | 0.40mi |
| 1840 Camellia Dr Decatur, GA | 3.0 | 2.0 | 1340 | $1,950 | $1.46 | 24d | 1 | 0.40mi |
| 2078 E Lilac Ln Decatur, GA | 3.0 | 1.0 | 1160 | $1,600 | $1.38 | 45d | 1 | 0.42mi |
| 2570 Castellan Dr Atlanta, GA | 3.0 | 2.5 | 1576 | $2,700 | $1.71 | 26d | 1 | 0.44mi |
| 2043 Juanita St Decatur, GA | 3.0 | 2.0 | 1500 | $3,000 | $2.00 | 45d | 1 | 0.45mi |
| 2283 Scotty Cir Decatur, GA | 3.0 | 2.0 | 1298 | $2,150 | $1.66 | 45d | 1 | 0.47mi |
| 2335 Scotty Cir Decatur, GA | 3.0 | 1.0 | 1010 | $1,495 | $1.48 | 45d | 1 | 0.51mi |
| 2480 Flat Shoals Rd Decatur, GA | 1.0–3.0 | 1.0–2.0 | 1017 | $2,149 | $2.11 | 3d | 23 | 0.54mi |
| 2062 Bencal Dr SE Atlanta, GA | 3.0 | 2.0 | 1260 | $1,650 | $1.31 | 26d | 1 | 0.68mi |
| 2378 Charleston Pointe SE Atlanta, GA | 3.0 | 3.0 | 1604 | $2,100 | $1.31 | 24d | 1 | 0.69mi |
| 2000 Bencal Dr SE Atlanta, GA | 3.0 | 2.0 | 1500 | $1,850 | $1.23 | 26d | 1 | 0.73mi |
| 2435 Bouldercliff Way SE Unit B Atlanta, GA | 2.0 | 1.0 | 1236 | $1,600 | $1.29 | 45d | 1 | 0.78mi |
| 2435 Bouldercliff Way SE Atlanta, GA | 3.0 | 2.0 | 1236 | $1,950 | $1.58 | 45d | 1 | 0.78mi |
| 2434 Rockcliff Rd SE Atlanta, GA | 3.0 | 2.0 | 1400 | $2,499 | $1.78 | 45d | 1 | 0.78mi |
| 2006 McAfee Pl Decatur, GA | 3.0 | 2.0 | 1128 | $2,295 | $2.03 | 26d | 1 | 0.78mi |
| 773 Fayetteville Rd SE Atlanta, GA | 3.0 | 2.0 | 1085 | $2,100 | $1.94 | 45d | 1 | 0.80mi |
| 2126 Rexford Dr Decatur, GA | 3.0 | 1.5 | 1092 | $1,400 | $1.28 | 45d | 1 | 0.80mi |
| 2297 Charleston Pointe SE Atlanta, GA | 3.0 | 2.0 | 1604 | $2,200 | $1.37 | 45d | 1 | 0.82mi |
| 1930 Flat Shoals Rd SE Atlanta, GA | 1.0–2.0 | 1.0–1.5 | 1045 | $1,479 | $1.42 | 1d | 19 | 0.85mi |
| 1881 2nd Ave Decatur, GA | 3.0 | 1.0–2.5 | 1010 | $3,761 | $3.72 | 4d | 60 | 0.89mi |
| 1761 Terry Mill Rd SE Atlanta, GA | 3.0 | 1.5 | 1296 | $1,900 | $1.47 | 18d | 1 | 0.91mi |
| 1670 Cecilia Dr SE Atlanta, GA | 3.0 | 2.0 | 1032 | $2,350 | $2.28 | 45d | 1 | 0.93mi |
| 1757 Flintwood Dr SE Atlanta, GA | 3.0 | 2.0 | 1150 | $1,750 | $1.52 | 45d | 1 | 1.05mi |
| 2201 Glenwood Ave SE Atlanta, GA | 2.0 | 1.0–2.0 | 819 | $2,699 | $3.30 | 22d | 5 | 1.07mi |
| 2386 Cresta Dr Decatur, GA | 3.0 | 2.5 | 1107 | $2,000 | $1.81 | 45d | 1 | 1.07mi |
| 2692 Rockcliff Rd SE Atlanta, GA | 3.0 | 2.0 | 1239 | $2,000 | $1.61 | 45d | 1 | 1.16mi |
| 460 E Lake Blvd SE Atlanta, GA | 1.0–2.0 | 1.0–2.0 | 1104 | $1,699 | $1.54 | 4d | 6 | 1.16mi |
| 2731 Larkspur Dr SE Atlanta, GA | 4.0 | 3.0 | 1492 | $2,000 | $1.34 | 45d | 1 | 1.16mi |
| 1438 E Bouldercrest Rd Atlanta, GA | 1.0–3.0 | 1.0–2.0 | 967 | $1,707 | $1.76 | 0d | 18 | 1.17mi |
| 2407 Summerland Dr Decatur, GA | 3.0 | 2.0 | 1515 | $1,800 | $1.19 | 3d | 1 | 1.19mi |
| 2679 Sherlock Dr Decatur, GA | 3.0 | 1.5 | 1173 | $1,650 | $1.41 | 45d | 1 | 1.20mi |
| 2191 Greystone Way Decatur, GA | 3.0 | 1.0 | 1053 | $1,800 | $1.71 | 45d | 1 | 1.22mi |
| 2078 Parker Ranch Rd SE Atlanta, GA | 3.0 | 1.0 | 1014 | $1,650 | $1.63 | 26d | 1 | 1.23mi |
| 2401 Dawn Ct Decatur, GA | 3.0 | 2.0 | 1350 | $1,950 | $1.44 | 17d | 1 | 1.24mi |
| 2461 Fontaine Cir Decatur, GA | 3.0 | 2.0 | 1193 | $1,795 | $1.50 | 26d | 1 | 1.24mi |
Listing history 3 events
-
2026-05-07status Pending 1003-char remark
-
2026-05-04historical Active Under Contract 1003-char remark
-
2026-04-23$275,000 Active 1003-char remark
ⓘ Source: listings_history table (triggers on properties + properties_extension) + one-shot
backfill from property_details.listing_events for pre-trigger history.
Tax reassessment forecast GA · Resets to sale price
- Current annual tax
- $1,146 · $96/mo
- Projected year-2 tax
- $2,530 · $211/mo
- Expected delta
- +$1,384/yr (+$115/mo · 120.7%)
ⓘ Screening estimate from a state-policy table — verify with the county assessor before closing.
Climate risk First Street
- Flood 1/10 Low FEMA zone X (unshaded) · 0% chance over 30 yrs
- Wildfire 1/10 Low
- Heat 5/10 Major 7 d/yr ≥104°F today · 18 d/yr by 30 yrs out
- Wind 5/10 Major 26% chance of damaging wind over 30 yrs
- Air quality 5/10 Major 6 unhealthy d/yr today · 8 by 30 yrs out
Nearby sold comps map
Loading sold comps map…
Walkable amenities ~0.75 mi
Loading nearby amenities…
Taxation est. · year 1
- Rental income
- $25,282
- − Mortgage interest
- −$15,404
- − Property taxes
- −$1,146
- − Insurance
- −$1,375
- − Repairs & maintenance
- −$2,023
- − Management
- −$2,023
- − Depreciation
- −$8,000
- Taxable loss
- −$4,688
- Est. tax savings @ 24.0%
- +$1,125
- After-tax cash flow
- $1,272/yr
For passive investors: Depreciation is non-cash, so a rental often shows a tax loss while cash-flowing — sheltering income. Rental losses are passive: they offset passive income freely, and up to $25,000/yr can offset ordinary (W-2) income if you actively participate and your MAGI is under $100k (phasing out to $0 by $150k); unused losses carry forward. On sale, claimed depreciation is recaptured at up to 25%, and gains may owe capital-gains tax (a 1031 exchange can defer both). Figures are a year-1 estimate at your 24.0% rate — not tax advice; consult a CPA.
Schools (NCES district)
- District
- Dekalb County
- NCES district ID
- 1301740
- Math proficiency
- 19% ▼ -12.00%
- Reading proficiency
- 28% ▼ -7.00%
- Median HH income
- $51,448
- Composite
- 20.92/100
- National rank
- #8482
- State rank
- #125 of 174 in GA
Livability — Candler-McAfee
No livability data for this city. (Only ~50 U.S. cities are tracked.)
Census & demographics
- County
- Dekalb County · 782,738 people
- Metro
- Atlanta-Sandy Springs-Alpharetta, GA
- Population (ZIP)
- 42,948
- Household income
- $62,765
- Rent vs Own
- Severe rent burden
- 2097.0
Population outlook (DeKalb County) Hauer SSP2
- Today (2025)
- 839,977 people
- By 2030
- 891,768 · +6.2%
- By 2040
- 988,894 · +17.7%
- By 2050
- 1,074,583 · +27.9%
- By 2075
- 1,245,026 · +48.2%
- By 2100
- 1,303,135 · +55.1%
Race, ethnicity, and origin ACS 2023
- Neighborhood character
- Predominantly Black (70%)
- Race & ethnicity
- Black 70% White 18% Two or more races 6% Hispanic / Latino 5% Asian 2%
- Hispanic origin (detail)
- Mexican 2%
- Common ancestry
- Slovak 1% Italian 1% Serbian 1%
- Foreign-born
- 7% · Canada, China, Guatemala
- Languages at home
- 91% English-only · Spanish 4% Arabic 1% Other Indo-European 0%
Political lean MEDSL · DeKalb
- 2024 margin
- Solid D (+64.8) · D 81.9% · R 17.1% · Other 1.0%
- 2008→2024 swing
- +6.1pp toward D · 2008: 58.6pp · 2024: 64.8pp
- All cycles
- 2024: D+64.8 2020: D+67.4 2016: D+64.8 2012: D+56.8 2008: D+58.6
Not yet ingested
- Civics
- —
Market trends
- HPI YoY
- ▼ -203.83%
- Current HPI
- 221.0467
- Rent YoY
- ▲ 1.34%
- Metro
- Atlanta-Sandy Springs-Alpharetta, GA
- State GDP YoY
- ▲ 2.66%
- F500 in state
- 28
Industry mix (Fortune 500 HQ in GA)
| Industry | F500 HQs | Revenue |
|---|---|---|
| Paper / Packaging | 2 | $29B |
|
||
| Retail | 1 | $160B |
|
||
| Transportation / Logistics | 1 | $91B |
|
||
| Airlines | 1 | $62B |
|
||
| Consumer Goods | 1 | $47B |
|
||
| Utilities | 1 | $25B |
|
||
Price history
-3.6% since first listed4 events — show timeline
- 2026-06-12 Sold (MLS) $265,000 FMLS
- 2026-05-07 Pending — FMLS
- 2026-05-04 Contingent — FMLS
- 2026-04-23 Listed $275,000 FMLS
Property tax history
+3.5%/yrLatest (2025): $1,146 · -11.2% YoY. Source: county tax records.
Cash-flow waterfall
monthlySold comps — $/sqft
last 12 mo · ≤1 miLoading sold comps…