 🏷️ Likely Rental
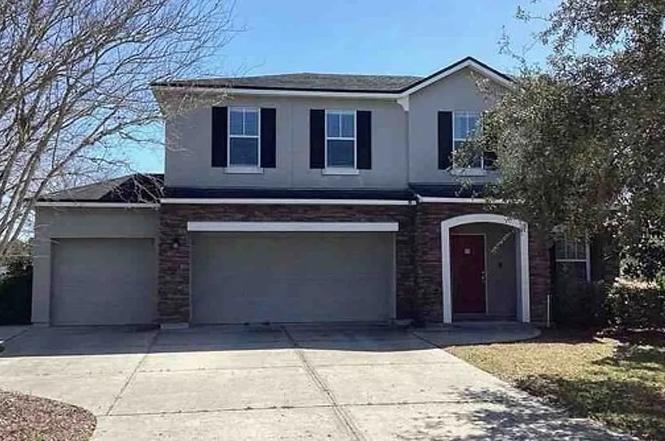
2017 N Sorrento Hills Rd · World Golf Village, FL
Flood risk 1/10 · Minimal
- FEMA flood zone
- X (unshaded)
- Chance of flooding over 30 yrs
- 0.0%
- Est. flood insurance / yr
- $507 – $1,088
Fire risk 4/10 · Minor
- Est. fire insurance / yr
- $947 – $1,759
Heat risk 9/10 · Severe
- Hot days now (above 107°F)
- 7 days/yr
- Hot days in 30 yrs
- 21 days/yr
Wind risk 9/10 · Severe
- Chance of severe wind over 30 yrs
- 99.0%
Air-quality risk 3/10 · Minor
- Unhealthy air days now
- 3 days/yr
- Unhealthy air days in 30 yrs
- 3 days/yr
Risk factors via First Street. Map © Google.
Why this score? — see what drove the D+ grade
The composite is a weighted blend of 9 inputs, each scored 0–100. Each bar is that input's sub-score; the figure is the points it added to the 100-point composite (weight × sub-score).
- Cash flow +15.0/30.0
- ARV discount +7.5/15.0
- Schools +6.4/10.0
- 1% rule +5.0/10.0
- DSCR +5.0/10.0
- Livability +3.9/5.0
- Rent growth +2.5/5.0
- Condition / age +2.5/5.0
- Appreciation +0.0/10.0
$5,000
🖨 Deal sheet 📄 Offer letter ✓ Due diligence
Listing remarks MLS
This Custom Built Colonial Style Stunning 4/2.5 Home with Office and Bonus Room, 3 car garage on over a 1/2 acre lot in the heart of Murabella! As you enter the home you will walk into a spacious formal Dining area With Gorgeous Wood Floors to office/Guest Room with French Doors, to an open Gathering Room with Fireplace, Eat-in-space area, Kitchen has lots of cabinets, Stainless Appliances, Granite counters, and Breakfast Bar overlooks an amazing backyard with true outdoor living! Beautiful newly installed Pavers with fire pit area, plenty of room to expand the home and build a pool on this over 1/2 lot! Back inside you walk up a private staircase to a Bonus/game room, three Guest Rooms and Master Bedroom. The Master is large with a Garden Tub and separate shower. This is the Only Custom Home by this Builder in Murabella which makes this Home so unique! A New A/C system, hot water heater, and garbage disposal is a plus! Home has been Freshly painted inside and out!
Key facts
- 3 garage spots
- Listed 8 days
Property features AI
Exterior
- Parking: 3-car garage
- Home design: Residential property; 2 stories total
- Exterior features: Planned Unit Development (PUD)
Interior
- Bathrooms: Two full bathrooms; One half bathroom
- Interior features: Two-story layout
Neighborhood map
What this means for you Summary
Snapshot
- This is a 5-bed/3.0-bath single-family listed at $5k.
Deal economics
- At list price, monthly cash flow is $3k ($31k/yr) — positive.
- The deal already cash-flows at list — no discount required.
- Meets the 1% rule at list price ($3k rent vs $5k).
- Cap rate 626.5% vs local median 3.0% in World Golf Village — top-decile yield for the area; either an underpriced asset or a hidden risk that comps aren't pricing in. Stress-test before assuming the spread holds.
Location & tenants
- Location reads 78/100 on livability (#168 in FL, #2,512 nationally) — a middle-class / working-renter tenant base. Strengths: schools A+, crime A+, employment A+; Watch: amenities F, commute F.
- St. Johns (rural): math 75% / reading 73% proficiency, ranked #2 of 73 in FL (top 3%) — strong family-tenant draw, lease renewals of 3-5y typical; only 20% free/reduced lunch — higher-income household profile.
- Market conditions: Rents flat; 1323 active listings in the ZIP; 4 comparable units currently listed for rent nearby; rentals at typical pace (median 24d on market — plan ~3-4 weeks tenant-placement turnaround); high-income renter base; 5,575 units permitted in St. Johns County in 2024 (584 in 5+ unit buildings).
- This rent runs 30% of the median local income ($131k/yr) — at the standard rent-burdened threshold; future hikes will face affordability resistance.
Forward outlook
- Local home prices are declining (-3.0%/yr); year-one equity from $35 of loan paydown is wiped out by about $150 of value loss. Plan a longer hold.
- St. Johns County population projected at +60% by 2050 — long-run rental-demand tailwind backs the buy-and-hold thesis.
- At projected returns (-3.0% appreciation + 0.1% rent growth), your $1k cash investment doubles in ~1 year — after that, you're playing with house money.
Negotiation context
- Only 8 days on market — expect competitive offers; lowballing is unlikely to land.
- 7 sale attempts since 17y ago with the ask held roughly flat each time — persistent listings suggest the price (not the market) is what's stuck; bring a comps-based counter.
Risks & watch-outs
- Climate carrying-cost: severe wind risk, 99% chance of damaging wind over 30y; extreme-heat days projected 7→21/yr by 2055 (HVAC capex compounding) — expect insurance premiums to compound above CPI over the hold.
Questions for the listing agent
- Is there a deadline driving the sale (1031 exchange, divorce, estate, relocation)? That informs how much negotiation room exists.
- Schools are A-rated — typically a magnet for longer-tenancy family renters. What's the average tenant stay here, and is there a school-zone premium baked into asking?
- The area grade is low — what's the realistic commute time and amenity access for the typical tenant pool here? Any planned neighborhood developments (good or bad) we should know about?
- What's the average days-on-market for RENTAL listings here right now (not sales)? A rising rental-DOM trend means longer vacancies and softer asking-rent achievability than the comps imply.
- What's the recent tenant-quality profile in this submarket — average credit score on applications, eviction rate, late-payment / NSF rate, and stable-employment percentage? A property-management company in the area should have these aggregated.
- How much new for-sale + rental construction is in the pipeline within 1–3 miles? Heavy new supply typically softens prices + rents 12–24 months out; constrained supply supports both.
Investment metrics
- 1% rule
- 66.30% ✓
- Cap rate
- 626.51%
- Cash-on-cash
- 2215.07%
- DSCR
- 99.56
- GRM
- 0.1
CMA / ARV
- ARV (on-the-fly)
- $545,493
- Comps found
- 12
Show comp detail 12 sales within ~0.75 mi
| Address | Dist | Beds/Ba | Sqft | Sold | Price | $/sf | Match |
|---|---|---|---|---|---|---|---|
| 180 E Positano Ave | 0.09mi | 5/4.0 | 2,601 (+2%) | 0mo | $585,000 | $225 | 89 |
| 436 Porta Rosa Cir | 0.09mi | 4/3.0 (-1) | 2,632 (+3%) | 1mo | $515,000 | $196 | 86 |
| 2724 N Portofino Rd | 0.17mi | 4/3.0 (-1) | 2,556 (-0%) | 2mo | $574,900 | $225 | 85 |
| 486 Porta Rosa Cir | 0.15mi | 5/3.0 | 2,708 (+6%) | 2mo | $490,000 | $181 | 82 |
| 232 Porta Rosa Cir | 0.44mi | 4/3.0 (-1) | 2,539 (-1%) | 2mo | $540,000 | $213 | 71 |
| 2270 Cascadia Ct | 0.47mi | 4/3.0 (-1) | 2,518 (-2%) | 5mo | $630,000 | $250 | 66 |
| 249 Porta Rosa Cir | 0.41mi | 4/2.0 (-1) | 2,646 (+3%) | 0mo | $635,000 | $240 | 66 |
| 405 Porta Rosa Cir | 0.13mi | 4/2.0 (-1) | 2,260 (-12%) | 4mo | $480,000 | $212 | 62 |
| 3528 Garibaldi Way | 0.60mi | 4/3.0 (-1) | 2,634 (+3%) | 0mo | $499,000 | $189 | 62 |
| 937 E Terranova Way | 0.38mi | 4/3.0 (-1) | 2,258 (-12%) | 0mo | $439,900 | $195 | 57 |
| 157 Toscana Ln | 0.64mi | 4/3.0 (-1) | 2,701 (+6%) | 5mo | $585,000 | $217 | 52 |
| 205 S Bellagio Dr | 0.56mi | 5/4.0 | 2,790 (+9%) | 5mo | $470,000 | $168 | 51 |
Match score weights: distance 35% · size 25% · config 20% · recency 20%. Top-matched comps best support the ARV.
Projected returns pro-forma
-3.0% appreciation · 0.08% rent growth · sell at horizon
- IRR
- —
- Equity multiple
- 111.26×
- Total profit
- $154,369
- Equity at exit
- $746
- IRR
- —
- Equity multiple
- 222.38×
- Total profit
- $309,934
- Equity at exit
- $432
Cash invested: $1,400 (down + closing). Projections, not guarantees.
Landlord ↔ Tenant lean methodology
- Overall (STATE)
- 87 Strongly Landlord-Friendly
- State Florida
- 87 Strongly Landlord-Friendly · R+3
- County
- — inherits STATE
- City
- — inherits STATE
ZIP-level market 32092
- Home prices YoY
- -32.2%
- Rents YoY
- 0.1%
- Active inventory
- 1323
- Price-to-rent
- 0.1×
Monthly cashflow live
- Estimated rent
- $3,315 medium interval (Pro) →
- Mortgage (P&I)
- −$26
- Tax est. 1.5%
- −$6 /mo · $75/yr
- Insurance
- −$2
- HOA
- −$0
- Vacancy / Maint / Mgmt
- −$696
- Net cashflow
- $2,584
Break-even live
UW: 25.0% down · 7.5% · 30yr · 1.5% tax · 5.0% vac · 8.0% maint · 8.0% mgmt
Financing live
Cash to close
- Down payment
- $1,250
- Closing costs
- $150
- Reserves months
- —
- Total cash needed
- —
Loan-product check · same deal, 3 products live
Conventional
25% down · 7.5% · 30yr
- Down + closing
- —
- Monthly P&I
- —
- Monthly cashflow
- —
- DSCR
- —
- Eligible?
- —
Personal DTI + credit; lowest rate.
DSCR
20% down · 8.5% · 30yr
- Down + closing
- —
- Monthly P&I
- —
- Monthly cashflow
- —
- DSCR
- —
- Eligible?
- —
No personal income docs; deal must DSCR.
Hard money
10% down · 12.0% · 12mo
- Down + closing
- —
- Monthly P&I
- —
- Monthly cashflow
- —
- DSCR
- —
- Eligible?
- —
Short-term bridge; refi at stabilization.
Rent comps 4 comps
| Address | Beds | Baths | Sqft | Rent | $/sqft | DOM | Units | Dist |
|---|---|---|---|---|---|---|---|---|
| 660 Porta Rosa Cir Saint Augustine, FL | 4.0 | 3.0 | 2591 | $3,450 | $1.33 | 23d | 1 | 0.40mi |
| 249 Palazzo Cir Saint Augustine, FL | 5.0 | 3.0 | 2690 | $2,824 | $1.05 | 23d | 1 | 0.55mi |
| 138 Colorado Springs Way Saint Augustine, FL | 4.0 | 2.0 | 1930 | $2,350 | $1.22 | 23d | 1 | 0.84mi |
| 3098 Pacetti Rd St. Augustine, FL | 4.0 | 3.0 | 2776 | $3,300 | $1.19 | 23d | 1 | 1.37mi |
Listing history 7 events
-
2026-06-18days on market $5,000 Active 8 DOM
-
2026-06-17days on market $5,000 Active 7 DOM
-
2026-06-16days on market $5,000 Active 6 DOM
-
2026-06-15days on market $5,000 Active 5 DOM
-
2026-06-13days on market $5,000 Active 3 DOM
-
2026-06-13remarks 295-char remark
-
2026-06-13$5,000 Active 2 DOM
ⓘ Source: listings_history table (triggers on properties + properties_extension) + one-shot
backfill from property_details.listing_events for pre-trigger history.
Climate risk First Street
- Flood 1/10 Low FEMA zone X (unshaded) · 0% chance over 30 yrs
- Wildfire 4/10 Moderate
- Heat 9/10 Extreme 7 d/yr ≥107°F today · 21 d/yr by 30 yrs out
- Wind 9/10 Extreme 99% chance of damaging wind over 30 yrs
- Air quality 3/10 Moderate 3 unhealthy d/yr today · 3 by 30 yrs out
Nearby sold comps map
Loading sold comps map…
Walkable amenities ~0.75 mi
Loading nearby amenities…
Taxation est. · year 1
- Rental income
- $39,779
- − Mortgage interest
- −$280
- − Property taxes
- −$75
- − Insurance
- −$25
- − Repairs & maintenance
- −$3,182
- − Management
- −$3,182
- − Depreciation
- −$145
- Taxable income
- $32,889
- Est. tax owed @ 24.0%
- −$7,893
- After-tax cash flow
- $23,118/yr
For passive investors: Depreciation is non-cash, so a rental often shows a tax loss while cash-flowing — sheltering income. Rental losses are passive: they offset passive income freely, and up to $25,000/yr can offset ordinary (W-2) income if you actively participate and your MAGI is under $100k (phasing out to $0 by $150k); unused losses carry forward. On sale, claimed depreciation is recaptured at up to 25%, and gains may owe capital-gains tax (a 1031 exchange can defer both). Figures are a year-1 estimate at your 24.0% rate — not tax advice; consult a CPA.
Schools (NCES district)
- District
- St. Johns
- NCES district ID
- 1201740
- Math proficiency
- 75% ▼ -5.00%
- Reading proficiency
- 73% ▼ -2.00%
- Median HH income
- $66,842
- Composite
- 64.31/100
- National rank
- #556
- State rank
- #2 of 73 in FL
Livability — World Golf Village
- Score
- 78/100
- State rank
- #168
- US rank
- #2512
Category grades
Schools grade is shown separately in the Schools card above.
Census & demographics
- Census place
- World Golf Village, FL
- County
- Saint Johns County · 301,599 people
- City population
- 48,288
- Metro
- Jacksonville, FL
- Population (ZIP)
- 53,071
- Household income
- $131,020
- Rent vs Own
- Severe rent burden
- 706.0
Population outlook (St. Johns County) Hauer SSP2
- Today (2025)
- 303,941 people
- By 2030
- 342,590 · +12.7%
- By 2040
- 417,328 · +37.3%
- By 2050
- 487,011 · +60.2%
- By 2075
- 635,395 · +109.1%
- By 2100
- 717,469 · +136.1%
Race, ethnicity, and origin ACS 2023
- Neighborhood character
- Predominantly White (75%)
- Race & ethnicity
- White 75% Two or more races 11% Hispanic / Latino 9% Black 6% Asian 3%
- Hispanic origin (detail)
- Mexican 1% Puerto Rican 2% Cuban 2%
- Common ancestry
- Lithuanian 3% Scotch-Irish 3% Slovak 3%
- Foreign-born
- 10% · Canada, Vietnam
- Languages at home
- 87% English-only · Spanish 6% Russian/Polish/Slavic 2% Other Indo-European 2%
Political lean MEDSL · St. Johns
- 2024 margin
- Solid R (+31.4) · D 33.9% · R 65.2%
- 2008→2024 swing
- +0.2pp no change · 2008: -31.6pp · 2024: -31.4pp
- All cycles
- 2024: R+31.4 2020: R+26.7 2016: R+33.4 2012: R+37.8 2008: R+31.6
Not yet ingested
- Civics
- —
Market trends
- HPI YoY
- ▼ -123.26%
- Current HPI
- 259.732
- Rent YoY
- ▲ 0.08%
- Metro
- Jacksonville, FL
- State GDP YoY
- ▲ 3.28%
- F500 in state
- 36
Industry mix (Fortune 500 HQ in FL)
| Industry | F500 HQs | Revenue |
|---|---|---|
| Industrial Technology | 2 | $29B |
|
||
| Insurance | 2 | $17B |
|
||
| Retail | 1 | $60B |
|
||
| Technology Distribution | 1 | $58B |
|
||
| Homebuilding | 1 | $35B |
|
||
| Technology Manufacturing | 1 | $35B |
|
||
Price history
-84.8% since first listed22 events — show timeline
- 2026-06-10 Listed $5,000 NFMLS
- 2019-05-14 Sold (Public Records) $324,000 Public Records
- 2019-05-10 Sold (MLS) $324,000 St. Augustine and St. Johns County Board of REALTORS®
- 2019-05-10 Sold (MLS) $324,000 realMLS
- 2019-04-25 Pending — realMLS
- 2019-04-22 Contingent — St. Augustine and St. Johns County Board of REALTORS®
- 2019-03-25 Contingent — realMLS
- 2019-03-15 Listed $324,000 St. Augustine and St. Johns County Board of REALTORS®
- 2019-03-15 Listed $324,900 realMLS
- 2018-09-28 Listing Removed — realMLS
- 2018-08-07 Price Changed $325,000 realMLS
- 2018-06-17 Price Changed $339,000 realMLS
- 2018-05-17 Price Changed $345,000 realMLS
- 2018-02-02 Listed $349,000 realMLS
- 2015-09-29 Listing Removed — realMLS
- 2015-09-02 Listed $299,900 realMLS
- 2011-06-24 Listing Removed — realMLS
- 2011-06-03 Sold (MLS) $205,000 realMLS
- 2010-07-02 Listed $219,990 realMLS
- 2010-06-30 Listing Removed — realMLS
- 2009-10-01 Listed $249,990 realMLS
- 2009-09-24 Sold (Public Records) $33,000 Public Records
Property tax history
+3.4%/yrLatest (2025): $6,976 · +8.0% YoY. Source: county tax records.
Cash-flow waterfall
monthlySold comps — $/sqft
last 12 mo · ≤1 miLoading sold comps…