130 Padre Blvd #502 · South Padre Island, TX
Flood risk 8/10 · Major
- FEMA flood zone
- X (shaded)
- Chance of flooding over 30 yrs
- 0.99%
- Est. flood insurance / yr
- $507 – $1,088
Fire risk 1/10 · Minimal
- Est. fire insurance / yr
- $1,222 – $2,270
Heat risk 10/10 · Severe
- Hot days now (above 105°F)
- 8 days/yr
- Hot days in 30 yrs
- 31 days/yr
Wind risk 9/10 · Severe
- Chance of severe wind over 30 yrs
- 99.0%
Air-quality risk 2/10 · Minimal
- Unhealthy air days now
- 0 days/yr
- Unhealthy air days in 30 yrs
- 1 days/yr
Risk factors via First Street. Map © Google.
Why this score? — see what drove the D grade
The composite is a weighted blend of 9 inputs, each scored 0–100. Each bar is that input's sub-score; the figure is the points it added to the 100-point composite (weight × sub-score).
- ARV discount +15.0/15.0
- Cash flow +9.6/30.0
- 1% rule +5.3/10.0
- Condition / age +3.8/5.0
- Livability +3.0/5.0
- DSCR +2.7/10.0
- Rent growth +2.5/5.0
- Schools +1.9/10.0
- Appreciation +0.0/10.0
$265,000
🖨 Deal sheet 📄 Offer letter ✓ Due diligence
Listing remarks MLS
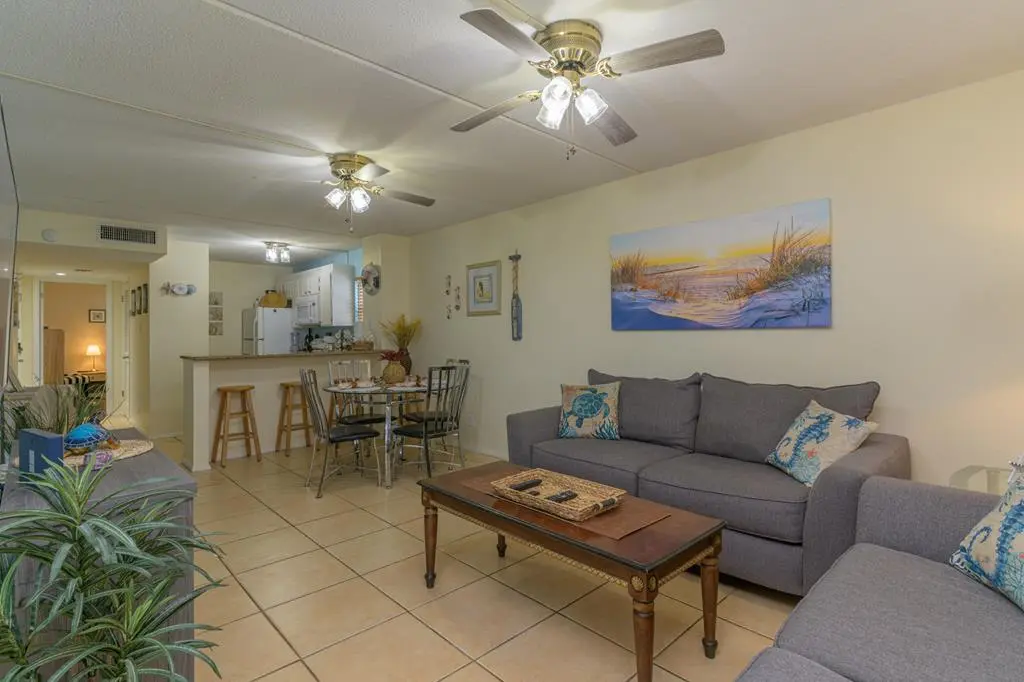
Schedule a showing for this 2 bed/1 bath unit on the 5th floor with views of the causeway, bay, gulf, and space X. Fully furnished and in pristine condition. Tile throughout except the bedrooms. Granite counter tops in the kitchen and a fresh coat of paint throughout. Pet friendly, laundry room on site, and plenty of parking. Huge pool, hot tub, tennis courts, and a walk way to the beach across the parking lot. Close to Beach Park Waterpark, Isla Blanca Park, restaurants, and shopping. Short term rentals allowed. This unit is not a rental but you can rent out short term. AC unit is approx 1 yr old
Key facts
- Views of the bay
- Views of the gulf
- Views of space x
Tags
Neighborhood map
What this means for you Summary
Snapshot
- This is a 2-bed/1.0-bath condo listed at $265k. Condition is rated good.
Deal economics
- At list price, monthly cash flow is $-244 ($-3k/yr) — negative.
- To cash-flow at today's rent, offer at most $230k (13.3% below list).
- Meets the 1% rule at list price ($3k rent vs $265k).
- Recommended offer: $230k (13.3% below list) — sets the bar for cash-flow.
- Cap rate 5.5% vs local median 1.8% in South Padre Island — top-decile yield for the area; either an underpriced asset or a hidden risk that comps aren't pricing in. Stress-test before assuming the spread holds.
Location & tenants
- Location reads 60/100 on livability (#1,077 in TX) — a middle-class / working-renter tenant base. Strengths: housing B; Watch: amenities C-, schools F, crime F.
- Point Isabel ISD (town): math 14% / reading 31% proficiency, ranked #756 of 826 in TX (top 92%) — low school quality limits family demand, transient renter base, plan for 1-2y turnover.
- Market conditions: 522 active listings in the ZIP; 4 comparable units currently listed for rent nearby; rentals leasing fast (median 14d on market — plan ~1-2 weeks tenant-placement turnaround); 2,326 units permitted in Cameron County in 2024 (503 in 5+ unit buildings).
- At $2,722/mo this rent would consume 48% of the median local household income ($68k/yr) (locally 96% of renters already pay >50% of income on rent) — very limited rent-growth headroom before tenants either downsize or default.
Forward outlook
- Local home prices are declining (-3.0%/yr); year-one equity from $2k of loan paydown is wiped out by about $8k of value loss. Plan a longer hold.
- Cameron County population projected at +3% by 2050 — modest demand growth; plan on rents tracking national, not racing it.
Negotiation context
- It's been on market 99 days — a 9% lower offer ($241k) is reasonable based on typical stale-listing flexibility.
- 3 sale attempts since 4y ago with the ask held roughly flat each time — persistent listings suggest the price (not the market) is what's stuck; bring a comps-based counter.
Risks & watch-outs
- Watch-outs: flood insurance adds $66/mo.
- Climate carrying-cost: severe flood risk; severe wind risk, 99% chance of damaging wind over 30y; extreme-heat days projected 8→31/yr by 2055 (HVAC capex compounding) — expect insurance premiums to compound above CPI over the hold.
Questions for the listing agent
- What do current leases actually rent for vs. the listed asking? Can we see a recent rent roll and the last 12 months of T-12 income?
- It's been on market 99 days. Have you received any prior offers? Is the seller open to a 13% concession, seller financing, or rate buy-down credit?
- What's the actual annual flood-insurance premium (NFIP or private), and is the property in a SFHA with mandatory coverage?
- What does the HOA fee cover, when was the last increase, and are there any pending special assessments or reserve-fund shortfalls?
- Any open or pending special assessments — roof, HVAC, plumbing, elevator, façade? What's the per-unit balance and payoff schedule, and is the seller paying it off at close or rolling it to the buyer?
- Why hasn't it sold? Are there any deal-killer items the seller is aware of (foundation, flood, title, zoning, code violations)?
- Is there a deadline driving the sale (1031 exchange, divorce, estate, relocation)? That informs how much negotiation room exists.
- Schools are F-rated, which usually means shorter tenancies and higher turnover. Who's the typical renter profile here, and what's been the actual vacancy rate?
- Crime grade is F in this area — have there been break-ins, vandalism, or insurance claims at this property in the last 3 years? What carrier currently insures it and at what premium?
- The area grade is low — what's the realistic commute time and amenity access for the typical tenant pool here? Any planned neighborhood developments (good or bad) we should know about?
- What's the average days-on-market for RENTAL listings here right now (not sales)? A rising rental-DOM trend means longer vacancies and softer asking-rent achievability than the comps imply.
- What's the recent tenant-quality profile in this submarket — average credit score on applications, eviction rate, late-payment / NSF rate, and stable-employment percentage? A property-management company in the area should have these aggregated.
- How much new apartment / multifamily construction is in the pipeline within 1–3 miles? Heavy new supply (>2% of stock underway) typically softens rents 12–24 months out; light construction supports rent growth.
Investment metrics
- 1% rule
- 1.03% ✓
- Cap rate
- 5.49%
- Cash-on-cash
- -2.87%
- DSCR
- 0.87
- GRM
- 8.1
CMA / ARV
- ARV (median comp)
- $324,120
- List price
- $265,000
- Delta
- -18.24%
- Verdict
- UNDERPRICED
- Comps
- 19 within 1.0 mi
Projected returns pro-forma
-3.0% appreciation · 3.0% rent growth · sell at horizon
- IRR
- -22.7%
- Equity multiple
- 0.22×
- Total profit
- $-58,107
- Equity at exit
- $39,512
- IRR
- -16.6%
- Equity multiple
- 0.07×
- Total profit
- $-69,051
- Equity at exit
- $22,912
Cash invested: $74,200 (down + closing). Projections, not guarantees.
Landlord ↔ Tenant lean methodology
- Overall (STATE)
- 87 Strongly Landlord-Friendly
- State Texas
- 87 Strongly Landlord-Friendly · R+5
- County
- — inherits STATE
- City
- — inherits STATE
ZIP-level market 78597
- Home prices YoY
- -13.5%
- Active inventory
- 522
- Price-to-rent
- 8.1×
Monthly cashflow live
- Estimated rent
- $2,722 medium interval (Pro) →
- Mortgage (P&I)
- −$1,390
- Tax est. 1.5%
- −$331 /mo · $3,975/yr
- Insurance
- −$110
- Flood insurance flood zone
- −$66 /mo · $798/yr
- HOA
- −$497
- Vacancy / Maint / Mgmt
- −$572
- Net cashflow
- $-244
Break-even live
UW: 25.0% down · 7.5% · 30yr · 1.5% tax · 5.0% vac · 8.0% maint · 8.0% mgmt
Financing live
Cash to close
- Down payment
- $66,250
- Closing costs
- $7,950
- Reserves months
- —
- Total cash needed
- —
Loan-product check · same deal, 3 products live
Conventional
25% down · 7.5% · 30yr
- Down + closing
- —
- Monthly P&I
- —
- Monthly cashflow
- —
- DSCR
- —
- Eligible?
- —
Personal DTI + credit; lowest rate.
DSCR
20% down · 8.5% · 30yr
- Down + closing
- —
- Monthly P&I
- —
- Monthly cashflow
- —
- DSCR
- —
- Eligible?
- —
No personal income docs; deal must DSCR.
Hard money
10% down · 12.0% · 12mo
- Down + closing
- —
- Monthly P&I
- —
- Monthly cashflow
- —
- DSCR
- —
- Eligible?
- —
Short-term bridge; refi at stabilization.
Rent comps 4 comps
| Address | Beds | Baths | Sqft | Rent | $/sqft | DOM | Units | Dist |
|---|---|---|---|---|---|---|---|---|
| 200 Padre Blvd #1208 South Padre Island, TX | 1.0 | 2.0 | 781 | $3,000 | $3.84 | 43d | 1 | 0.09mi |
| 404 Padre Blvd Unit 1507754P South Padre Island, TX | 1.0 | 2.0 | 667 | $3,382 | $5.07 | 13d | 1 | 0.41mi |
| 113 W Sunny Isle Dr Unit 2 South Padre Island, TX | 2.0 | 1.0 | 750 | $2,300 | $3.07 | 13d | 1 | 1.05mi |
| 111 W Sunny Isle Dr Unit 201 South Padre Island, TX | 2.0 | 2.0 | 928 | $2,500 | $2.69 | 13d | 1 | 1.06mi |
HOA detail condo
- Monthly dues
- $497 · $5,964/yr
- Likely covers
- waterpool
- Assessments
- None detected in remarks — confirm with the listing agent.
Listing history 25 events
-
2026-06-18days on market $265,000 Active 99 DOM
-
2026-06-17days on market $265,000 Active 98 DOM
-
2026-06-16days on market $265,000 Active 97 DOM
-
2026-06-15days on market $265,000 Active 96 DOM
-
2026-06-14days on market $265,000 Active 94 DOM
-
2026-06-13days on market $265,000 Active 93 DOM
-
2026-06-10days on market $265,000 Active 91 DOM
-
2026-06-09days on market $265,000 Active 90 DOM
-
2026-06-09days on market $265,000 Active 89 DOM
-
2026-06-07days on market $265,000 Active 88 DOM
-
2026-06-03days on market $265,000 Active 84 DOM
-
2026-06-02days on market $265,000 Active 83 DOM
-
2026-06-01days on market $265,000 Active 82 DOM
-
2026-05-31days on market $265,000 Active 81 DOM
-
2026-05-30days on market $265,000 Active 80 DOM
-
2026-03-11$265,000 Active 604-char remark
Show marketing remark (604 chars)
Schedule a showing for this 2 bed/1 bath unit on the 5th floor with views of the causeway, bay, gulf, and space X. Fully furnished and in pristine condition. Tile throughout except the bedrooms. Granite counter tops in the kitchen and a fresh coat of paint throughout. Pet friendly, laundry room on site, and plenty of parking. Huge pool, hot tub, tennis courts, and a walk way to the beach across the parking lot. Close to Beach Park Waterpark, Isla Blanca Park, restaurants, and shopping. Short term rentals allowed. This unit is not a rental but you can rent out short term. AC unit is approx 1 yr old
-
2025-04-24price $279,000
-
2025-03-05price $289,000
-
2025-01-15$299,000 Active
-
2023-02-21soldstatus Closed
-
2023-02-02historical Active Under Contract
-
2023-01-25historical
-
2023-01-11price $259,000
-
2022-12-06price $285,000
-
2022-11-18$299,000 Active
ⓘ Source: listings_history table (triggers on properties + properties_extension) + one-shot
backfill from property_details.listing_events for pre-trigger history.
Climate risk First Street
- Flood 8/10 Severe FEMA zone X (shaded) · 99% chance over 30 yrs
- Wildfire 1/10 Low
- Heat 10/10 Extreme 8 d/yr ≥105°F today · 31 d/yr by 30 yrs out
- Wind 9/10 Extreme 99% chance of damaging wind over 30 yrs
- Air quality 2/10 Low 0 unhealthy d/yr today · 1 by 30 yrs out
Nearby sold comps map
Loading sold comps map…
Walkable amenities ~0.75 mi
Loading nearby amenities…
Taxation est. · year 1
- Rental income
- $32,668
- − Mortgage interest
- −$14,844
- − Property taxes
- −$3,975
- − Insurance
- −$2,122
- − Repairs & maintenance
- −$2,613
- − Management
- −$2,613
- − HOA
- −$5,964
- − Depreciation
- −$7,709
- Taxable loss
- −$7,174
- Est. tax savings @ 24.0%
- +$1,722
- After-tax cash flow
- $-1,209/yr
For passive investors: Depreciation is non-cash, so a rental often shows a tax loss while cash-flowing — sheltering income. Rental losses are passive: they offset passive income freely, and up to $25,000/yr can offset ordinary (W-2) income if you actively participate and your MAGI is under $100k (phasing out to $0 by $150k); unused losses carry forward. On sale, claimed depreciation is recaptured at up to 25%, and gains may owe capital-gains tax (a 1031 exchange can defer both). Figures are a year-1 estimate at your 24.0% rate — not tax advice; consult a CPA.
Condition & rehab AI · 13 photos
This 2-bedroom/1-bathroom unit is in good condition with a good roof and exterior. It has a tiled floor and average walls and paint. The kitchen and bathroom may need minor repairs and maintenance. Upgrading the interior walls, countertops, and bathroom fixtures can significantly increase its value.
Repairs flagged
- Minor Kitchen Countertops — The countertops appear to be in good condition, but a thorough inspection is recommended.
- Minor Bathroom Fixtures — The condition of the sink and tub is not clear from the photos, but they may need a fresh coat of paint or minor repairs.
Value-add opportunities
- Both Paint the interior walls — Painting the interior walls can refresh the look of the property and make it more appealing to potential buyers or renters.
- Both Replace the kitchen countertops — Replacing the kitchen countertops can improve the functionality and aesthetic appeal of the kitchen, making it more attractive to potential buyers or renters.
- Both Upgrade the bathroom fixtures — Upgrading the bathroom fixtures can improve the functionality and aesthetic appeal of the bathroom, making it more attractive to potential buyers or renters.
Renovation cost estimate screening
| Repair item | Severity | Est. cost |
|---|---|---|
| Kitchen Countertops · The countertops appear to be in good condition, but a thorough inspection is recommended. | Minor | $500–3,000 |
| Bathroom Fixtures · The condition of the sink and tub is not clear from the photos, but they may need a fresh coat of paint or minor repairs. | Minor | $500–3,000 |
| Total estimated repair cost · 2 items | $1,000–6,000 |
Value-add ROI direction
- Both Paint the interior walls — Painting the interior walls can refresh the look of the property and make it more appealing to potential buyers or renters. ↑
- Both Replace the kitchen countertops — Replacing the kitchen countertops can improve the functionality and aesthetic appeal of the kitchen, making it more attractive to potential buyers or renters. ↑
- Both Upgrade the bathroom fixtures — Upgrading the bathroom fixtures can improve the functionality and aesthetic appeal of the bathroom, making it more attractive to potential buyers or renters. ↑
ⓘ Cost ranges are severity-bucket heuristics (US national rule-of-thumb). Get contractor quotes + a written scope before underwriting a rehab budget.
Schools (NCES district)
- District
- Point Isabel ISD
- NCES district ID
- 4835250
- Math proficiency
- 14% ▼ -24.00%
- Reading proficiency
- 31% ▼ -10.00%
- Median HH income
- $38,115
- Composite
- 18.78/100
- National rank
- #8871
- State rank
- #756 of 826 in TX
Livability — South Padre Island
- Score
- 60/100
- State rank
- #1077
- US rank
- #19107
Category grades
Schools grade is shown separately in the Schools card above.
Census & demographics
- Census place
- South Padre Island, TX
- County
- Cameron County · 310,734 people
- Metro
- Brownsville-Harlingen, TX
- Population (ZIP)
- 2,935
- Household income
- $68,421
- Rent vs Own
- Severe rent burden
- 96.0
Population outlook (Cameron County) Hauer SSP2
- Today (2025)
- 441,603 people
- By 2030
- 448,113 · +1.5%
- By 2040
- 456,385 · +3.3%
- By 2050
- 456,294 · +3.3%
- By 2075
- 423,851 · -4.0%
- By 2100
- 342,787 · -22.4%
Race, ethnicity, and origin ACS 2023
- Neighborhood character
- Predominantly White (76%)
- Race & ethnicity
- White 76% Hispanic / Latino 15% Two or more races 7% Black 6% Asian 2%
- Hispanic origin (detail)
- Mexican 14%
- Common ancestry
- Slovak 5% Lithuanian 4% German 2%
- Foreign-born
- 13% · Canada
- Languages at home
- 88% English-only · Spanish 11% Other Indo-European 1%
Political lean MEDSL · Cameron
- 2024 margin
- Lean R (+5.8) · D 46.7% · R 52.5%
- 2008→2024 swing
- -34.6pp toward R · 2008: 28.8pp · 2024: -5.8pp
- All cycles
- 2024: R+5.8 2020: D+13.2 2016: D+32.5 2012: D+32.4 2008: D+28.8
Not yet ingested
- Civics
- —
Market trends
- HPI YoY
- ▼ -66.59%
- Current HPI
- 425.29
- Rent YoY
- —
- Metro
- Brownsville-Harlingen, TX
- State GDP YoY
- ▲ 3.95%
- F500 in state
- 110
Industry mix (Fortune 500 HQ in TX)
| Industry | F500 HQs | Revenue |
|---|---|---|
| Energy | 16 | $1,198B |
|
||
| Technology | 5 | $198B |
|
||
| Engineering / Construction | 4 | $72B |
|
||
| Energy Services | 3 | $60B |
|
||
| Utilities | 3 | $41B |
|
||
| Healthcare | 2 | $330B |
|
||
Price history
-11.4% since first listed10 events — show timeline
- 2026-03-11 Listed $265,000 SPIBOR
- 2025-04-24 Price Changed $279,000 SPIBOR
- 2025-03-05 Price Changed $289,000 SPIBOR
- 2025-01-15 Listed $299,000 SPIBOR
- 2023-02-21 Sold (MLS) — SPIBOR
- 2023-02-02 Contingent — SPIBOR
- 2023-01-25 Delisted — SPIBOR
- 2023-01-11 Price Changed $259,000 SPIBOR
- 2022-12-06 Price Changed $285,000 SPIBOR
- 2022-11-18 Listed $299,000 SPIBOR
Cash-flow waterfall
monthlySold comps — $/sqft
last 12 mo · ≤1 miLoading sold comps…