4875 W Mcelroy Ave Unit G208 · Tampa, FL
Flood risk 10/10 · Severe
- FEMA flood zone
- AE
- Chance of flooding over 30 yrs
- 0.99%
- Est. flood insurance / yr
- $1,737 – $8,500
Fire risk 1/10 · Minimal
- Est. fire insurance / yr
- $947 – $1,759
Heat risk 10/10 · Severe
- Hot days now (above 107°F)
- 7 days/yr
- Hot days in 30 yrs
- 30 days/yr
Wind risk 10/10 · Severe
- Chance of severe wind over 30 yrs
- 99.0%
Air-quality risk 4/10 · Minor
- Unhealthy air days now
- 4 days/yr
- Unhealthy air days in 30 yrs
- 4 days/yr
Risk factors via First Street. Map © Google.
Why this score? — see what drove the C grade
The composite is a weighted blend of 9 inputs, each scored 0–100. Each bar is that input's sub-score; the figure is the points it added to the 100-point composite (weight × sub-score).
- Cash flow +22.3/30.0
- 1% rule +8.1/10.0
- ARV discount +7.5/15.0
- DSCR +7.1/10.0
- Schools +4.2/10.0
- Livability +4.0/5.0
- Rent growth +2.7/5.0
- Condition / age +2.5/5.0
- Appreciation +0.0/10.0
$199,900
🖨 Deal sheet (PDF) 📄 Offer letter ✓ Due diligence
Listing remarks
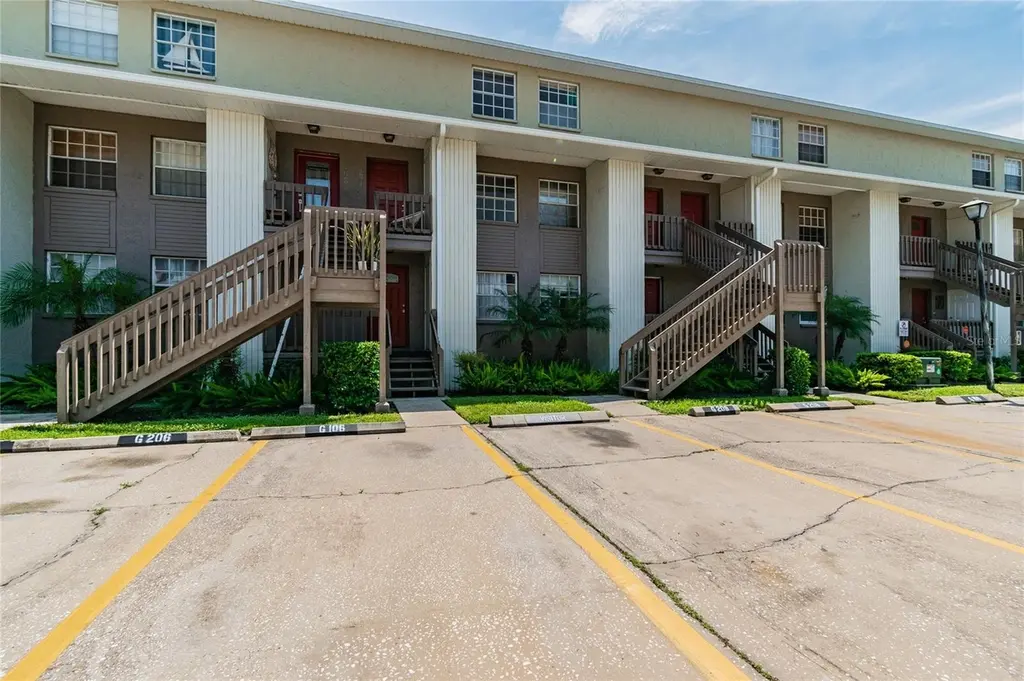
Very well maintained 2 bedrooms, 1.5 bath, two-story townhome in South Tampa. The combination of laminate on the ground floor and carpet upstairs mixed with the neutral color of the walls make you feel cozy and invite you to stay home. The outside balcony is good for relaxing while drinking your morning coffee surrounded by mature landscaping and old trees. This community also features a recreational pool and club house. You should not miss the opportunity to live in one of the fastest growing areas on the south side of Tampa where half million dollar condominiums, an exclusive yacht club, and marina are under construction at walking distance from this unit. It is also conveniently located
Key facts
- Outside balcony
- Exclusive yacht club
- Club house
Tags
Property features AI
Finance
- Other: No lease restrictions reported
- Financial info: Total monthly fees: $360.55; Total annual fees: $4,326.60
- HOA & community: Monthly HOA fee of $360.55; HOA includes pool, clubhouse, maintenance (structure and grounds), sewer, water, trash, insurance and escrow reserves; Association approval required; Pets allowed: cats and dogs; Association: Bay Ridge Properties in Tampa
Exterior
- Utilities: Public water; Public sewer; Electricity connected; Cable available; Sewer available; Water connected
- Home design: Condominium; Residential property; Faces west; Two levels; Total of 3 stories; Entry on mid-level (unit in multi-story building)
- Construction: Block, metal frame and stucco construction; Shingle roof; Crawlspace foundation; Built as part of building at 4875 W McElroy
- Exterior features: Balcony; Rain gutters; Storage
Interior
- Kitchen: Dishwasher; Range; Range hood; Disposal; Refrigerator; Exhaust fan
- Bedrooms: 2 bedrooms
- Flooring: Carpet; Ceramic tile; Laminate
- Bathrooms: 1 full bath; 1 half bath
- Heating & cooling: Central heating (electric); Central air conditioning
- Interior features: Open floorplan with living room/dining room combo; Programmable thermostat; Window treatments
- Laundry & utility: Laundry closet; Electric water heater
Neighborhood map
What this means for you Summary
Snapshot
- This is a 2-bed/2.0-bath condo listed at $200k.
Deal economics
- At list price, monthly cash flow is $-99 ($-1k/yr) — negative.
- To cash-flow at today's rent, offer at most $182k (8.7% below list).
- Meets the 1% rule at list price ($3k rent vs $200k).
- Recommended offer: $182k (8.7% below list) — sets the bar for cash-flow.
Location & tenants
- Location reads 79/100 on livability (#142 in FL, #2,135 nationally) — a middle-class / working-renter tenant base. Strengths: commute A+, housing A+, health & safety A+; Watch: crime D+.
- Hillsborough (suburban): math 47% / reading 50% proficiency, ranked #41 of 73 in FL (top 56%) — families likely to look elsewhere, expect single-tenant / working-renter base with shorter leases.
- Zoned schools: Anderson Elementary School (math 52% / reading 52%, grade C-, #990 of 2,144 statewide, top 48%, 304 students, 46% FRL); Madison Middle School (math 43% / reading 46%, grade D, #320 of 571 statewide, top 57%, 563 students, 65% FRL); Robinson High School (math 43% / reading 63%, grade C-, #148 of 667 statewide, top 23%, 1,354 students, 41% FRL) — zoned schools at 51% FRL track the district average.
- Market conditions: Rents flat; 423 active listings in the ZIP; 40 comparable units currently listed for rent nearby; rentals leasing fast (median 7d on market — plan ~1-2 weeks tenant-placement turnaround); solid renter incomes; 9,053 units permitted in Hillsborough County in 2024 (4,555 in 5+ unit buildings).
- This rent runs 35% of the median local income ($91k/yr) — at the standard rent-burdened threshold; future hikes will face affordability resistance.
Forward outlook
- Local home prices are declining (-3.0%/yr); year-one equity from $1k of loan paydown is wiped out by about $6k of value loss. Plan a longer hold.
- Hillsborough County population projected at +37% by 2050 — long-run rental-demand tailwind backs the buy-and-hold thesis.
Negotiation context
- It's been on market 45 days — a 3% lower offer ($194k) is reasonable based on typical stale-listing flexibility.
- 3 sale attempts since 7y ago with the ask held roughly flat each time — persistent listings suggest the price (not the market) is what's stuck; bring a comps-based counter.
- Current owner paid $39k; list at $200k implies a 413% gain — meaningful room to come down on a strong offer.
Risks & watch-outs
- Watch-outs: flood insurance adds $427/mo.
- Climate carrying-cost: in FEMA flood zone AE (mandatory federal flood insurance); severe wind risk, 99% chance of damaging wind over 30y; extreme-heat days projected 7→30/yr by 2055 (HVAC capex compounding) — expect insurance premiums to compound above CPI over the hold.
Questions for the listing agent
- What do current leases actually rent for vs. the listed asking? Can we see a recent rent roll and the last 12 months of T-12 income?
- It's been on market 45 days. Have you received any prior offers? Is the seller open to a 9% concession, seller financing, or rate buy-down credit?
- What's the actual annual flood-insurance premium (NFIP or private), and is the property in a SFHA with mandatory coverage?
- What does the HOA fee cover, when was the last increase, and are there any pending special assessments or reserve-fund shortfalls?
- Any open or pending special assessments — roof, HVAC, plumbing, elevator, façade? What's the per-unit balance and payoff schedule, and is the seller paying it off at close or rolling it to the buyer?
- Is there a deadline driving the sale (1031 exchange, divorce, estate, relocation)? That informs how much negotiation room exists.
- Crime grade is D in this area — have there been break-ins, vandalism, or insurance claims at this property in the last 3 years? What carrier currently insures it and at what premium?
- What's the average days-on-market for RENTAL listings here right now (not sales)? A rising rental-DOM trend means longer vacancies and softer asking-rent achievability than the comps imply.
- What's the recent tenant-quality profile in this submarket — average credit score on applications, eviction rate, late-payment / NSF rate, and stable-employment percentage? A property-management company in the area should have these aggregated.
- How much new apartment / multifamily construction is in the pipeline within 1–3 miles? Heavy new supply (>2% of stock underway) typically softens rents 12–24 months out; light construction supports rent growth.
Investment metrics
- 1% rule
- 1.31% ✓
- Cap rate
- 8.26%
- Cash-on-cash
- 7.03%
- DSCR
- 1.31
- GRM
- 6.4
CMA / ARV
No comps found within radius.
Projected returns pro-forma
-3.0% appreciation · 0.69% rent growth · sell at horizon
- IRR
- -23.7%
- Equity multiple
- 0.21×
- Total profit
- $-44,108
- Equity at exit
- $29,806
- IRR
- -33.5%
- Equity multiple
- -0.21×
- Total profit
- $-67,704
- Equity at exit
- $17,284
Cash invested: $55,972 (down + closing). Projections, not guarantees.
Landlord ↔ Tenant lean methodology
- Overall (STATE)
- 87 Strongly Landlord-Friendly
- State Florida
- 87 Strongly Landlord-Friendly · R+3
- County
- — inherits STATE
- City
- — inherits STATE
ZIP-level market 33611
- Rents YoY
- 0.7%
- Active inventory
- 423
- Price-to-rent
- 6.4×
Monthly cashflow live
- Estimated rent
- $2,622 high interval (Pro) →
- Mortgage (P&I)
- −$1,048
- Tax from tax record
- −$252 /mo · $3,019/yr
- Insurance
- −$83
- Flood insurance flood zone
- −$427 /mo · $5,118/yr
- HOA
- −$360
- Vacancy / Maint / Mgmt
- −$551
- Net cashflow
- $-99
Break-even live
Sensitivity live
| Price | -10% $15 | -5% $-42 | +0% $-99 | +5% $-155 | +10% $-212 |
|---|---|---|---|---|---|
| Rent | -10% $-306 | -5% $-202 | +0% $-99 | +5% $5 | +10% $108 |
| Rate | -1.0pp $2 | -0.5pp $-48 | base $-99 | +0.5pp $-150 | +1.0pp $-203 |
UW: 25.0% down · 7.5% · 30yr · 1.5% tax · 5.0% vac · 8.0% maint · 8.0% mgmt
Financing live
Cash to close
- Down payment
- $49,975
- Closing costs
- $5,997
- Reserves months
- —
- Total cash needed
- —
Loan-product check · same deal, 3 products live
Conventional
25% down · 7.5% · 30yr
- Down + closing
- —
- Monthly P&I
- —
- Monthly cashflow
- —
- DSCR
- —
- Eligible?
- —
Personal DTI + credit; lowest rate.
DSCR
20% down · 8.5% · 30yr
- Down + closing
- —
- Monthly P&I
- —
- Monthly cashflow
- —
- DSCR
- —
- Eligible?
- —
No personal income docs; deal must DSCR.
Hard money
10% down · 12.0% · 12mo
- Down + closing
- —
- Monthly P&I
- —
- Monthly cashflow
- —
- DSCR
- —
- Eligible?
- —
Short-term bridge; refi at stabilization.
Rent comps 40 comps
| Address | Beds | Baths | Sqft | Rent | $/sqft | DOM | Units | Dist |
|---|---|---|---|---|---|---|---|---|
| 4821 W McElroy Ave Unit 4821 Tampa, FL | 2.0 | 2.5 | 1190 | $2,349 | $1.97 | 1d | 1 | 0.02mi |
| 4851 W Gandy Blvd Tampa, FL | 1.0–2.0 | 1.0–2.0 | 910 | $2,500 | $2.75 | 0d | 2 | 0.07mi |
| 5000 Culbreath Key Way Tampa, FL | 1.0–2.0 | 1.0–2.0 | 847 | $2,995 | $3.54 | 4d | 3 | 0.17mi |
| 4800 S West Shore Blvd Tampa, FL | 1.0–2.0 | 1.0–2.0 | 801 | $2,256 | $2.82 | 0d | 18 | 0.18mi |
| 4851 W Gandy Blvd Unit 5 Tampa, FL | 2.0 | 2.0 | 1250 | $2,500 | $2.00 | 19d | 1 | 0.20mi |
| 5001 Bridge St Tampa, FL | 2.0 | 1.0–2.0 | 913 | $3,422 | $3.75 | 1d | 9 | 0.28mi |
| 4715 W Coachman Ave Tampa, FL | 3.0 | 2.0 | 1275 | $2,900 | $2.27 | 0d | 1 | 0.35mi |
| 4706 Gurnet Ct Tampa, FL | 2.0 | 2.5 | 1261 | $2,600 | $2.06 | 7d | 1 | 0.37mi |
| 5350 Bridge St Tampa, FL | 1.0–3.0 | 1.0–2.0 | 1092 | $3,009 | $2.76 | 0d | 11 | 0.39mi |
| 5320 S West Shore Blvd Tampa, FL | 2.0 | 1.0–2.0 | 865 | $3,110 | $3.60 | 1d | 20 | 0.43mi |
| 5125 W Tyson Ave Tampa, FL | 2.0 | 2.0 | 1135 | $3,154 | $2.78 | 1d | 1 | 0.48mi |
| 5127 W Tyson Ave Tampa, FL | 3.0 | 1.0–2.5 | 1078 | $4,469 | $4.14 | 0d | 29 | 0.49mi |
| 4505 S Gaines Rd Tampa, FL | 3.0 | 2.0 | 1410 | $2,600 | $1.84 | 14d | 1 | 0.61mi |
| 5301 W Tyson Ave Tampa, FL | 1.0–3.0 | 1.0–2.0 | 1176 | $4,052 | $3.44 | 1d | 189 | 0.61mi |
| 4720 W Leila Ave Tampa, FL | 3.0 | 1.0 | 864 | $1,850 | $2.14 | 12d | 1 | 0.62mi |
| 4720 W Leila Ave Tampa, FL | 3.0 | 1.0 | 864 | $1,850 | $2.14 | 26d | 1 | 0.62mi |
| 4720 W Leila Ave Tampa, FL | 3.0 | 1.0 | 864 | $1,850 | $2.14 | 7d | 1 | 0.62mi |
| 5215 W Tyson Ave Tampa, FL | 2.0 | 2.0 | 1087 | $3,570 | $3.28 | 1d | 1 | 0.64mi |
| 4413 W Rogers Ave Tampa, FL | 3.0 | 2.0 | 1488 | $2,900 | $1.95 | 1d | 1 | 0.65mi |
| 4708 W Oklahoma Ave Tampa, FL | 3.0 | 2.0 | 1472 | $3,500 | $2.38 | 26d | 1 | 0.69mi |
| 5215 Olmstead Bay Pl Tampa, FL | 2.0 | 2.5 | 1292 | $2,400 | $1.86 | 18d | 1 | 0.70mi |
| 4325 Aegean Dr Unit 250B Tampa, FL | 2.0 | 2.0 | 1150 | $2,100 | $1.83 | 26d | 1 | 0.71mi |
| 5110 S Manhattan Ave Tampa, FL | 1.0–3.0 | 1.0–2.0 | 997 | $2,686 | $2.69 | 1d | 23 | 0.72mi |
| 4315 Aegean Dr Unit 102C Tampa, FL | 2.0 | 1.0 | 1000 | $1,849 | $1.85 | 23d | 1 | 0.75mi |
| 4304 La Riviera Ct Tampa, FL | 2.0 | 1.5 | 1044 | $3,275 | $3.14 | 26d | 1 | 0.79mi |
| 4521 W La Villa Ln Tampa, FL | 2.0 | 1.5 | 1044 | $1,875 | $1.80 | 26d | 1 | 0.81mi |
| 4233 La Sorrento Ct Tampa, FL | 2.0 | 1.5 | 1044 | $2,200 | $2.11 | 5d | 1 | 0.82mi |
| 4716 W Wisconsin Ave Tampa, FL | 3.0 | 1.0 | 980 | $3,200 | $3.27 | 26d | 1 | 0.82mi |
| 5430 W Tyson Ave Unit 2 Tampa, FL | 2.0 | 2.0 | 1165 | $3,508 | $3.01 | 26d | 1 | 0.83mi |
| 4220 La Dega Ct Unit 1 Tampa, FL | 2.0 | 1.5 | 1044 | $1,899 | $1.82 | 26d | 1 | 0.85mi |
| 4220 La Dega Ct Tampa, FL | 2.0 | 2.0 | 1044 | $1,899 | $1.82 | 26d | 1 | 0.85mi |
| 5608 S Manhattan Ave Unit A Tampa, FL | 2.0 | 1.0 | 800 | $500 | $0.62 | 19d | 1 | 0.86mi |
| 5442 W Tyson Ave Tampa, FL | 2.0 | 2.0 | 1165 | $3,458 | $2.97 | 1d | 1 | 0.87mi |
| 5432 W Tyson Ave Tampa, FL | 2.0 | 1.0–2.0 | 866 | $3,668 | $4.24 | 0d | 52 | 0.88mi |
| 4003 S West Shore Blvd Tampa, FL | 2.0 | 1.0–2.0 | 690 | $1,950 | $2.82 | 0d | 303 | 0.89mi |
| 4201 La Dega Ct Tampa, FL | 3.0 | 1.5 | 1164 | $2,500 | $2.15 | 16d | 1 | 0.89mi |
| 4325 S Coolidge Ave Tampa, FL | 3.0 | 1.0 | 1351 | $2,700 | $2.00 | 16d | 1 | 0.91mi |
| 4325 S Coolidge Ave Tampa, FL | 3.0 | 1.0 | 1351 | $2,700 | $2.00 | 22d | 1 | 0.91mi |
| 6207 S West Shore Blvd Tampa, FL | 3.0 | 1.0–2.0 | 1076 | $3,930 | $3.65 | 0d | 38 | 0.97mi |
| 4109 W Wallace Ave Tampa, FL | 3.0 | 1.5 | 1345 | $2,500 | $1.86 | 26d | 1 | 1.03mi |
HOA detail condo
- Monthly dues
- $360 · $4,320/yr
- Likely covers
- landscapingpool
- Assessments
- None detected in remarks — confirm with the listing agent.
Listing history 28 events
-
2026-06-21days on market $199,900 Active 45 DOM
-
2026-06-18days on market $199,900 Active 42 DOM
-
2026-06-17days on market $199,900 Active 41 DOM
-
2026-06-16days on market $199,900 Active 40 DOM
-
2026-06-15days on market $199,900 Active 39 DOM
-
2026-06-13days on market $199,900 Active 37 DOM
-
2026-06-13days on market $199,900 Active 36 DOM
-
2026-06-09days on market $199,900 Active 33 DOM
-
2026-06-08days on market $199,900 Active 32 DOM
-
2026-06-07days on market $199,900 Active 31 DOM
-
2026-06-04days on market $199,900 Active 28 DOM
-
2026-06-03days on market $199,900 Active 27 DOM
-
2026-06-02days on market $199,900 Active 26 DOM
-
2026-06-01days on market $199,900 Active 25 DOM
-
2026-05-31days on market $199,900 Active 24 DOM
-
2026-05-07$199,900 Active 790-char remark
-
2025-01-21historical
-
2024-12-02$240,000 Active
-
2019-09-13status Pending
-
2019-09-13historical
-
2019-09-04price $124,900
-
2019-07-10price $129,000
-
2019-06-22price $145,000
-
2019-06-13price $165,000
-
2019-06-03$177,000 Active
-
2013-02-21soldstatus $39,000
-
2001-08-16soldstatus $52,000
-
1987-07-01soldstatus $400,000
ⓘ Source: listings_history table (triggers on properties + properties_extension) + one-shot
backfill from property_details.listing_events for pre-trigger history.
Tax reassessment forecast FL · Resets to sale price
- Current annual tax
- $3,019 · $252/mo
- Projected year-2 tax
- $3,019 · $252/mo
- Expected delta
- $0/yr ($0/mo · 0.0%)
ⓘ Screening estimate from a state-policy table — verify with the county assessor before closing.
Climate risk First Street
- Flood 10/10 Extreme FEMA zone AE · 99% chance over 30 yrs
- Wildfire 1/10 Low
- Heat 10/10 Extreme 7 d/yr ≥107°F today · 30 d/yr by 30 yrs out
- Wind 10/10 Extreme 99% chance of damaging wind over 30 yrs
- Air quality 4/10 Moderate 4 unhealthy d/yr today · 4 by 30 yrs out
Nearby sold comps map
Loading sold comps map…
Walkable amenities ~0.75 mi
Loading nearby amenities…
Taxation est. · year 1
- Rental income
- $31,460
- − Mortgage interest
- −$11,198
- − Property taxes
- −$3,019
- − Insurance
- −$6,118
- − Repairs & maintenance
- −$2,517
- − Management
- −$2,517
- − HOA
- −$4,320
- − Depreciation
- −$5,815
- Taxable loss
- −$4,044
- Est. tax savings @ 24.0%
- +$971
- After-tax cash flow
- $-213/yr
For passive investors: Depreciation is non-cash, so a rental often shows a tax loss while cash-flowing — sheltering income. Rental losses are passive: they offset passive income freely, and up to $25,000/yr can offset ordinary (W-2) income if you actively participate and your MAGI is under $100k (phasing out to $0 by $150k); unused losses carry forward. On sale, claimed depreciation is recaptured at up to 25%, and gains may owe capital-gains tax (a 1031 exchange can defer both). Figures are a year-1 estimate at your 24.0% rate — not tax advice; consult a CPA.
Schools (NCES district)
- District
- Hillsborough
- NCES district ID
- 1200870
- Math proficiency
- 47% ▼ -8.00%
- Reading proficiency
- 50% ▼ -4.00%
- Median HH income
- $50,622
- Composite
- 41.6/100
- National rank
- #3435
- State rank
- #41 of 73 in FL
Livability — Tampa
- Score
- 79/100
- State rank
- #142
- US rank
- #2135
Category grades
Schools grade is shown separately in the Schools card above.
Census & demographics
- Census place
- Tampa, FL
- County
- Hillsborough County · 1,540,968 people
- City population
- 523,346
- Metro
- Tampa-St. Petersburg-Clearwater, FL
- Population (ZIP)
- 36,810
- Household income
- $90,910
- Rent vs Own
- Severe rent burden
- 1761.0
Population outlook (Hillsborough County) Hauer SSP2
- Today (2025)
- 1,607,022 people
- By 2030
- 1,733,968 · +7.9%
- By 2040
- 1,979,565 · +23.2%
- By 2050
- 2,203,427 · +37.1%
- By 2075
- 2,667,893 · +66.0%
- By 2100
- 2,891,558 · +79.9%
Race, ethnicity, and origin ACS 2023
- Neighborhood character
- Predominantly White (70%)
- Race & ethnicity
- White 70% Hispanic / Latino 14% Two or more races 12% Black 5% Asian 5%
- Hispanic origin (detail)
- Mexican 2% Puerto Rican 3% Cuban 4%
- Common ancestry
- Romanian 3% Slovak 2% Lithuanian 2%
- Foreign-born
- 12% · Canada, Vietnam, Jamaica
- Languages at home
- 85% English-only · Spanish 7% Other Indo-European 2% Vietnamese 1%
Political lean MEDSL · Hillsborough
- 2024 margin
- Toss-up / Even · D 47.8% · R 50.9% · Other 1.3%
- 2008→2024 swing
- -10.2pp toward R · 2008: 7.1pp · 2024: -3.1pp
- All cycles
- 2024: R+3.1 2020: D+6.9 2016: D+6.8 2012: D+6.7 2008: D+7.1
Not yet ingested
- Civics
- —
Market trends
- HPI YoY
- ▼ -328.23%
- Current HPI
- 374.7996
- Rent YoY
- ▲ 0.69%
- Metro
- Tampa-St. Petersburg-Clearwater, FL
- State GDP YoY
- ▲ 3.28%
- F500 in state
- 36
Industry mix (Fortune 500 HQ in FL)
| Industry | F500 HQs | Revenue |
|---|---|---|
| Industrial Technology | 2 | $29B |
|
||
| Insurance | 2 | $17B |
|
||
| Retail | 1 | $60B |
|
||
| Technology Distribution | 1 | $58B |
|
||
| Homebuilding | 1 | $35B |
|
||
| Technology Manufacturing | 1 | $35B |
|
||
Price history
-50.0% since first listed13 events — show timeline
- 2026-05-07 Listed $199,900 Stellar MLS as Distributed by MLS Grid
- 2025-01-21 Listing Removed — Stellar MLS as Distributed by MLS Grid
- 2024-12-02 Listed $240,000 Stellar MLS as Distributed by MLS Grid
- 2019-09-13 Pending — Stellar MLS as Distributed by MLS Grid
- 2019-09-13 Listing Removed — Stellar MLS as Distributed by MLS Grid
- 2019-09-04 Price Changed $124,900 Stellar MLS as Distributed by MLS Grid
- 2019-07-10 Price Changed $129,000 Stellar MLS as Distributed by MLS Grid
- 2019-06-22 Price Changed $145,000 Stellar MLS as Distributed by MLS Grid
- 2019-06-13 Price Changed $165,000 Stellar MLS as Distributed by MLS Grid
- 2019-06-03 Listed $177,000 Stellar MLS as Distributed by MLS Grid
- 2013-02-21 Sold (Public Records) $39,000 Public Records
- 2001-08-16 Sold (Public Records) $52,000 Public Records
- 1987-07-01 Sold (Public Records) $400,000 Public Records
Property tax history
+19.6%/yrLatest (2025): $3,019 · +9.6% YoY. Source: county tax records.
Cash-flow waterfall
monthlySold comps — $/sqft
last 12 mo · ≤1 miLoading sold comps…