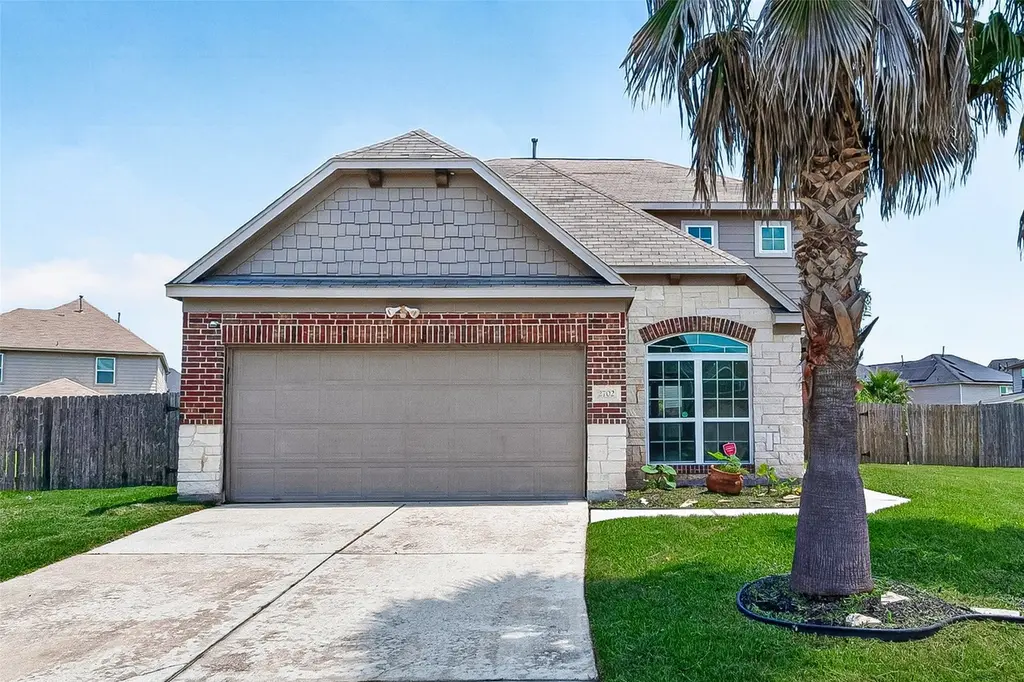
2702 Modano Ct · Fresno, TX
Flood risk 1/10 · Minimal
- FEMA flood zone
- X (unshaded)
- Chance of flooding over 30 yrs
- 0.0%
- Est. flood insurance / yr
- $507 – $1,088
Fire risk 4/10 · Minor
- Est. fire insurance / yr
- $1,222 – $2,270
Heat risk 9/10 · Severe
- Hot days now (above 110°F)
- 7 days/yr
- Hot days in 30 yrs
- 23 days/yr
Wind risk 9/10 · Severe
- Chance of severe wind over 30 yrs
- 99.0%
Air-quality risk 2/10 · Minimal
- Unhealthy air days now
- 2 days/yr
- Unhealthy air days in 30 yrs
- 2 days/yr
Risk factors via First Street. Map © Google.
Why this score? — see what drove the D+ grade
The composite is a weighted blend of 9 inputs, each scored 0–100. Each bar is that input's sub-score; the figure is the points it added to the 100-point composite (weight × sub-score).
- ARV discount +11.4/15.0
- Cash flow +11.0/30.0
- 1% rule +5.0/10.0
- Schools +4.5/10.0
- Appreciation +4.0/10.0
- DSCR +3.2/10.0
- Livability +3.1/5.0
- Condition / age +2.5/5.0
- Rent growth +2.3/5.0
$299,000
🖨 Deal sheet (PDF) 📄 Offer letter ✓ Due diligence
Listing remarks
This well-appointed Fresno home delivers a warm and connected layout perfect for everyday living. The spacious living room flows naturally into the kitchen, which shines with bar seating and connects to the formal dining space. The primary suite is a true retreat with an ensuite bath featuring dual sinks, a soaking tub, a walk-in shower, and a walk-in closet. Upstairs, a loft and three additional bedrooms, all with walk-in closets, provide exceptional space and flexibility. Outside, the fully fenced yard is a standout with a covered patio, a separately fenced garden area, and generous greenspace. Big Belly Hibachi and Tacos y Tamales Rossy bring great local dining close to home for any occa
Key facts
- Fenced yard
- Soaking tub
- Walk-in closet
Tags
Property features AI
Finance
- Other: Located on approximately 0.283-acre lot
- HOA & community: Homeowners association managed by Principal Management Group of Hou; Annual association fee of $515
Exterior
- Parking: Attached 2-car garage
- Utilities: Public water; Public sewer
- Home design: Residential property; Full ownership; Slab foundation; Built in 2014; Composition roof
- Construction: Brick and stone construction
- Exterior features: Fenced private yard; Backs to greenbelt/park; Subdivision setting
Interior
- Kitchen: Dishwasher; Gas oven; Gas range; Microwave; Pantry; Breakfast bar; Open to family room
- Bedrooms: 4 total rooms (includes bedrooms and other living spaces)
- Flooring: Carpet; Tile
- Bathrooms: 2 full bathrooms; 1 half bathroom
- Heating & cooling: Central heating (gas); Central air conditioning (gas)
- Interior features: Breakfast bar; Double vanity; Kitchen/family room combo; Primary bedroom with private bath; Pantry; Soaking tub; Separate shower; Tub/shower; Window treatments; Ceiling fans; Loft
- Laundry & utility: Washer hookup
Neighborhood map
What this means for you Summary
Snapshot
- This is a 4-bed/3.0-bath single-family listed at $299k.
Deal economics
- At list price, monthly cash flow is $-127 ($-2k/yr) — negative.
- To cash-flow at today's rent, offer at most $277k (7.5% below list).
- To meet the 1% rule (rent ≥ 1% of price), the offer needs to be $299k (0.1% below list).
- Recommended offer: $277k (7.5% below list) — sets the bar for cash-flow.
Location & tenants
- Location reads 62/100 on livability (#943 in TX) — a middle-class / working-renter tenant base. Strengths: employment A+, housing A+, cost of living A; Watch: crime C-, amenities F, commute F.
- Fort Bend ISD (suburban): math 44% / reading 53% proficiency, ranked #140 of 826 in TX (top 17%) — families likely to look elsewhere, expect single-tenant / working-renter base with shorter leases.
- Zoned schools: Rosa Parks El (math 16% / reading 27%, grade F, #3,470 of 4,322 statewide, top 81%, 651 students, 76% FRL); Lake Olympia Middle (math 18% / reading 31%, grade F, #1,279 of 1,662 statewide, top 78%, 1,170 students, 71% FRL); Fort Bend Co Alter (26 students, 0% FRL).
- Zoned-school proficiency averages 23% at this address vs 48% district-wide (-26 pts) — the specific schools serving this property underperform the Fort Bend ISD average; the district grade overstates school quality for this exact location.
- Market conditions: Rents soft (-0.9%/yr); 177 active listings in the ZIP; 12 comparable units currently listed for rent nearby; rentals at typical pace (median 23d on market — plan ~3-4 weeks tenant-placement turnaround); solid renter incomes; 12,093 units permitted in Fort Bend County in 2024 (815 in 5+ unit buildings).
- This rent runs 38% of the median local income ($94k/yr) — at the standard rent-burdened threshold; future hikes will face affordability resistance.
Forward outlook
- Local home prices are declining (-2.0%/yr); year-one equity from $2k of loan paydown is wiped out by about $6k of value loss. Plan a longer hold.
- Fort Bend County population projected at +75% by 2050 — long-run rental-demand tailwind backs the buy-and-hold thesis.
Negotiation context
- It's been on market 17 days — a 2% lower offer ($295k) is reasonable based on typical stale-listing flexibility.
- 5 sale attempts since 3y ago with the ask held roughly flat each time — persistent listings suggest the price (not the market) is what's stuck; bring a comps-based counter.
Risks & watch-outs
- Watch-outs: property tax is 3.0% of price.
- Climate carrying-cost: severe wind risk, 99% chance of damaging wind over 30y; extreme-heat days projected 7→23/yr by 2055 (HVAC capex compounding) — expect insurance premiums to compound above CPI over the hold.
Questions for the listing agent
- What do current leases actually rent for vs. the listed asking? Can we see a recent rent roll and the last 12 months of T-12 income?
- Property tax is high relative to price — has the assessment been appealed recently, and will the sale trigger a re-assessment?
- What does the HOA fee cover, when was the last increase, and are there any pending special assessments or reserve-fund shortfalls?
- Is there a deadline driving the sale (1031 exchange, divorce, estate, relocation)? That informs how much negotiation room exists.
- Schools are D-rated, which usually means shorter tenancies and higher turnover. Who's the typical renter profile here, and what's been the actual vacancy rate?
- The area grade is low — what's the realistic commute time and amenity access for the typical tenant pool here? Any planned neighborhood developments (good or bad) we should know about?
- What's the average days-on-market for RENTAL listings here right now (not sales)? A rising rental-DOM trend means longer vacancies and softer asking-rent achievability than the comps imply.
- What's the recent tenant-quality profile in this submarket — average credit score on applications, eviction rate, late-payment / NSF rate, and stable-employment percentage? A property-management company in the area should have these aggregated.
- How much new for-sale + rental construction is in the pipeline within 1–3 miles? Heavy new supply typically softens prices + rents 12–24 months out; constrained supply supports both.
Investment metrics
- 1% rule
- 1.00% ✗
- Cap rate
- 5.78%
- Cash-on-cash
- -1.82%
- DSCR
- 0.92
- GRM
- 8.3
CMA / ARV
- ARV (on-the-fly)
- $327,704
- Comps found
- 12
Show comp detail 12 sales within ~0.75 mi
| Address | Dist | Beds/Ba | Sqft | Sold | Price | $/sf | Match |
|---|---|---|---|---|---|---|---|
| 2543 Tucker Creek Dr | 0.09mi | 4/3.0 | 2,323 (-3%) | 1mo | $300,000 | $129 | 90 |
| 2611 Cottage Step Trl Trl | 0.17mi | 4/2.5 | 2,392 (0%) | 2mo | $295,000 | $123 | 89 |
| 3007 Acacia Fair Ln | 0.38mi | 4/2.5 | 2,351 (-2%) | 2mo | $310,000 | $132 | 76 |
| 2406 Grove View Trl | 0.24mi | 4/2.0 | 2,165 (-10%) | 2mo | $297,500 | $137 | 67 |
| 2403 Tall Sequoia Dr | 0.67mi | 4/2.5 | 2,340 (-2%) | 1mo | $332,500 | $142 | 62 |
| 1931 Acorn Glen Trl | 0.69mi | 4/2.5 | 2,480 (+4%) | 1mo | $279,900 | $113 | 59 |
| 2703 Coyote Trail Dr | 0.74mi | 4/2.0 | 2,311 (-3%) | 1mo | $322,900 | $140 | 55 |
| 2050 Bravos Manor Ln | 0.53mi | 4/2.5 | 2,658 (+11%) | 3mo | $369,990 | $139 | 52 |
| 1927 Vermillion View St | 0.70mi | 4/2.5 | 2,215 (-7%) | 1mo | $277,500 | $125 | 52 |
| 2019 Damasi Ln | 0.69mi | 4/2.5 | 2,615 (+9%) | 0mo | $319,000 | $122 | 50 |
| 2923 Vales Point Dr | 0.52mi | 4/2.0 | 2,079 (-13%) | 1mo | $306,900 | $148 | 49 |
| 2022 Wellfleet Xing | 0.66mi | 4/2.0 | 2,098 (-12%) | 0mo | $290,000 | $138 | 45 |
Match score weights: distance 35% · size 25% · config 20% · recency 20%. Top-matched comps best support the ARV.
Projected returns pro-forma
-1.98% appreciation · 0.0% rent growth · sell at horizon
- IRR
- -16.4%
- Equity multiple
- 0.38×
- Total profit
- $-52,046
- Equity at exit
- $58,337
- IRR
- -14.4%
- Equity multiple
- 0.08×
- Total profit
- $-76,779
- Equity at exit
- $50,109
Cash invested: $83,720 (down + closing). Projections, not guarantees.
Landlord ↔ Tenant lean methodology
- Overall (STATE)
- 87 Strongly Landlord-Friendly
- State Texas
- 87 Strongly Landlord-Friendly · R+5
- County
- — inherits STATE
- City
- — inherits STATE
ZIP-level market 77545
- Home prices YoY
- -0.8%
- Rents YoY
- -0.9%
- Active inventory
- 177
- Price-to-rent
- 8.3×
Monthly cashflow live
- Estimated rent
- $2,988 high interval (Pro) →
- Mortgage (P&I)
- −$1,568
- Tax from tax record
- −$752 /mo · $9,018/yr
- Insurance
- −$125
- HOA
- −$43
- Vacancy / Maint / Mgmt
- −$627
- Net cashflow
- $-127
Break-even live
Sensitivity live
| Price | -10% $43 | -5% $-42 | +0% $-127 | +5% $-211 | +10% $-296 |
|---|---|---|---|---|---|
| Rent | -10% $-363 | -5% $-245 | +0% $-127 | +5% $-9 | +10% $109 |
| Rate | -1.0pp $24 | -0.5pp $-51 | base $-127 | +0.5pp $-204 | +1.0pp $-283 |
UW: 25.0% down · 7.5% · 30yr · 1.5% tax · 5.0% vac · 8.0% maint · 8.0% mgmt
Financing live
Cash to close
- Down payment
- $74,750
- Closing costs
- $8,970
- Reserves months
- —
- Total cash needed
- —
Loan-product check · same deal, 3 products live
Conventional
25% down · 7.5% · 30yr
- Down + closing
- —
- Monthly P&I
- —
- Monthly cashflow
- —
- DSCR
- —
- Eligible?
- —
Personal DTI + credit; lowest rate.
DSCR
20% down · 8.5% · 30yr
- Down + closing
- —
- Monthly P&I
- —
- Monthly cashflow
- —
- DSCR
- —
- Eligible?
- —
No personal income docs; deal must DSCR.
Hard money
10% down · 12.0% · 12mo
- Down + closing
- —
- Monthly P&I
- —
- Monthly cashflow
- —
- DSCR
- —
- Eligible?
- —
Short-term bridge; refi at stabilization.
Rent comps 12 comps
| Address | Beds | Baths | Sqft | Rent | $/sqft | DOM | Units | Dist |
|---|---|---|---|---|---|---|---|---|
| 2642 Sunlit Meadow Trl Fresno, TX | 5.0 | 3.5 | 2785 | $4,000 | $1.44 | 45d | 1 | 0.41mi |
| 3106 Presley Jane Ct Missouri City, TX | 3.0 | 2.0 | 2109 | $2,271 | $1.08 | 7d | 1 | 0.71mi |
| 2123 Witham Park Ln Fresno, TX | 4.0 | 4.0 | 3026 | $2,850 | $0.94 | 45d | 1 | 0.74mi |
| 3314 Dry Creek Dr Missouri City, TX | 4.0 | 3.0 | 2600 | $4,200 | $1.62 | 45d | 1 | 0.76mi |
| 3526 Cambridge Falls Dr Fresno, TX | 4.0 | 3.0 | 3136 | $2,624 | $0.84 | 22d | 1 | 0.79mi |
| 3218 Clayton Terrace Dr Missouri City, TX | 4.0 | 3.0 | 2278 | $2,395 | $1.05 | 21d | 1 | 0.82mi |
| 3211 Breckinridge Ct Missouri City, TX | 4.0 | 2.5 | 2920 | $2,550 | $0.87 | 22d | 1 | 0.97mi |
| 2709 Troy Dr Missouri City, TX | 3.0 | 2.5 | 2082 | $2,245 | $1.08 | 22d | 1 | 0.98mi |
| 2707 Troy Dr Missouri City, TX | 3.0 | 2.5 | 2082 | $2,245 | $1.08 | 3d | 1 | 0.98mi |
| 3212 Aldridge Dr Missouri City, TX | 4.0 | 2.5 | 2489 | $2,650 | $1.06 | 22d | 1 | 0.99mi |
| 2235 Argos Dr Missouri City, TX | 4.0 | 3.5 | 2838 | $2,550 | $0.90 | 22d | 1 | 1.33mi |
| 3932 Teal Run Place Ct Fresno, TX | 4.0 | 2.0 | 1914 | $2,150 | $1.12 | 45d | 1 | 1.48mi |
HOA detail
- Monthly dues
- $43 · $516/yr
Listing history 10 events
-
2026-06-21days on market $299,000 Active 17 DOM
-
2026-06-18days on market $299,000 Active 14 DOM
-
2026-06-17days on market $299,000 Active 13 DOM
-
2026-06-16days on market $299,000 Active 12 DOM
-
2026-06-15days on market $299,000 Active 11 DOM
-
2026-06-13days on market $299,000 Active 9 DOM
-
2026-06-09days on market $299,000 Active 5 DOM
-
2026-06-08days on market $299,000 Active 4 DOM
-
2026-06-07remarks 699-char remark
-
2026-06-07$299,000 Active 3 DOM
ⓘ Source: listings_history table (triggers on properties + properties_extension) + one-shot
backfill from property_details.listing_events for pre-trigger history.
Tax reassessment forecast TX · Resets to sale price
- Current annual tax
- $9,018 · $752/mo
- Projected year-2 tax
- $9,018 · $752/mo
- Expected delta
- $0/yr ($0/mo · 0.0%)
ⓘ Screening estimate from a state-policy table — verify with the county assessor before closing.
Climate risk First Street
- Flood 1/10 Low FEMA zone X (unshaded) · 0% chance over 30 yrs
- Wildfire 4/10 Moderate
- Heat 9/10 Extreme 7 d/yr ≥110°F today · 23 d/yr by 30 yrs out
- Wind 9/10 Extreme 99% chance of damaging wind over 30 yrs
- Air quality 2/10 Low 2 unhealthy d/yr today · 2 by 30 yrs out
Nearby sold comps map
Loading sold comps map…
Walkable amenities ~0.75 mi
Loading nearby amenities…
Taxation est. · year 1
- Rental income
- $35,853
- − Mortgage interest
- −$16,749
- − Property taxes
- −$9,018
- − Insurance
- −$1,495
- − Repairs & maintenance
- −$2,868
- − Management
- −$2,868
- − HOA
- −$516
- − Depreciation
- −$8,698
- Taxable loss
- −$6,359
- Est. tax savings @ 24.0%
- +$1,526
- After-tax cash flow
- $5/yr
For passive investors: Depreciation is non-cash, so a rental often shows a tax loss while cash-flowing — sheltering income. Rental losses are passive: they offset passive income freely, and up to $25,000/yr can offset ordinary (W-2) income if you actively participate and your MAGI is under $100k (phasing out to $0 by $150k); unused losses carry forward. On sale, claimed depreciation is recaptured at up to 25%, and gains may owe capital-gains tax (a 1031 exchange can defer both). Figures are a year-1 estimate at your 24.0% rate — not tax advice; consult a CPA.
Schools (NCES district)
- District
- Fort Bend ISD
- NCES district ID
- 4819650
- Math proficiency
- 44% ▼ -15.00%
- Reading proficiency
- 53% ▼ -4.00%
- Median HH income
- $82,360
- Composite
- 44.61/100
- National rank
- #2779
- State rank
- #140 of 826 in TX
Livability — Fresno
- Score
- 62/100
- State rank
- #943
- US rank
- #16815
Category grades
Schools grade is shown separately in the Schools card above.
Census & demographics
- Census place
- Fresno, TX
- County
- Fort Bend County · 836,777 people
- City population
- 26,236
- Metro
- Houston-The Woodlands-Sugar Land, TX
- Population (ZIP)
- 26,236
- Household income
- $94,474
- Rent vs Own
- Severe rent burden
- 360.0
Population outlook (Fort Bend County) Hauer SSP2
- Today (2025)
- 1,004,526 people
- By 2030
- 1,153,104 · +14.8%
- By 2040
- 1,453,718 · +44.7%
- By 2050
- 1,753,781 · +74.6%
- By 2075
- 2,455,772 · +144.5%
- By 2100
- 2,930,528 · +191.7%
Race, ethnicity, and origin ACS 2023
- Neighborhood character
- Diverse neighborhood (Simpson 0.61)
- Race & ethnicity
- Black 51% Hispanic / Latino 34% Two or more races 12% White 8% Asian 2%
- Hispanic origin (detail)
- Mexican 29%
- Common ancestry
- Portuguese 1%
- Foreign-born
- 18% · Canada
- Languages at home
- 67% English-only · Spanish 29% Other Asian/Pacific 1% Other Indo-European 1%
Political lean MEDSL · Fort Bend
- 2024 margin
- Toss-up / Even · D 49.5% · R 47.9% · Other 2.6%
- 2008→2024 swing
- +4.0pp toward D · 2008: -2.4pp · 2024: 1.6pp
- All cycles
- 2024: D+1.6 2020: D+10.6 2016: D+6.6 2012: R+6.8 2008: R+2.4
Not yet ingested
- Civics
- —
Market trends
- HPI YoY
- ▼ -1.98%
- Current HPI
- 231.3921
- Rent YoY
- ▼ -0.95%
- Metro
- Houston-The Woodlands-Sugar Land, TX
- State GDP YoY
- ▲ 3.95%
- F500 in state
- 110
Industry mix (Fortune 500 HQ in TX)
| Industry | F500 HQs | Revenue |
|---|---|---|
| Energy | 16 | $1,198B |
|
||
| Technology | 5 | $198B |
|
||
| Engineering / Construction | 4 | $72B |
|
||
| Energy Services | 3 | $60B |
|
||
| Utilities | 3 | $41B |
|
||
| Healthcare | 2 | $330B |
|
||
Price history
+11400.0% since first listed13 events — show timeline
- 2026-06-04 Listed $299,000 HARMLS
- 2025-10-24 Listing Removed — HARMLS
- 2025-10-12 Relisted — HARMLS
- 2025-10-12 Listing Removed — HARMLS
- 2025-09-13 Price Changed $339,800 HARMLS
- 2025-07-24 Listed $340,000 HARMLS
- 2023-10-06 Rental Removed $2,300 RENT.
- 2023-09-21 Price Changed $2,300 RENT.
- 2023-08-23 Price Changed $2,400 RENT.
- 2023-08-02 Price Changed $2,500 RENT.
- 2023-07-26 Listed for Rent $2,600 RENT.
- 2023-05-20 Listing Removed — HARMLS
- 2023-05-19 Listed $2,600 HARMLS
Property tax history
+29.7%/yrLatest (2025): $9,018 · +1.4% YoY. Source: county tax records.
Cash-flow waterfall
monthlySold comps — $/sqft
last 12 mo · ≤1 miLoading sold comps…