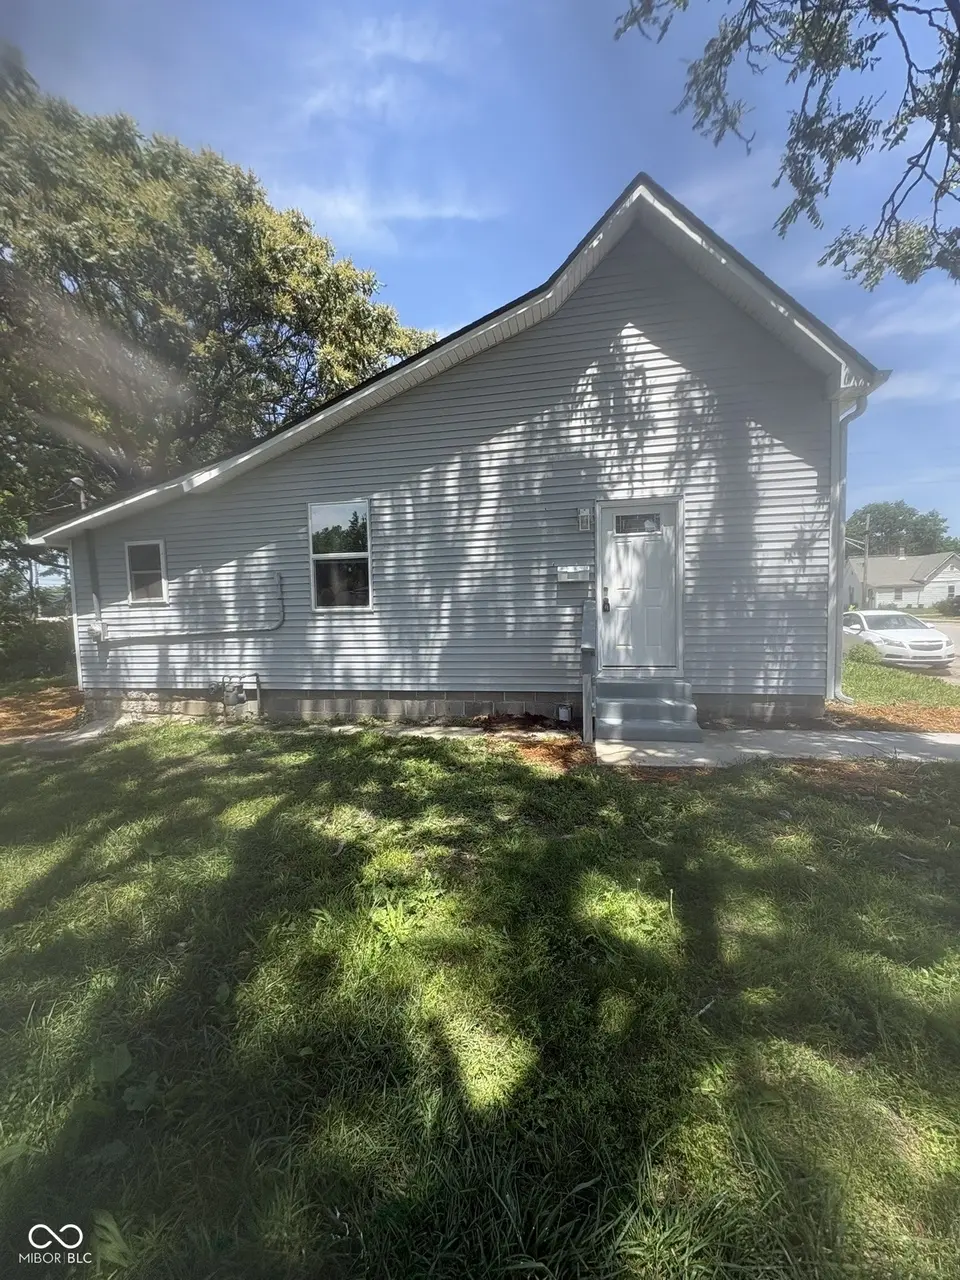
1314 S Pershing Ave · Indianapolis city (balance), IN
Flood risk 1/10 · Minimal
- FEMA flood zone
- X (unshaded)
- Chance of flooding over 30 yrs
- 0.0%
- Est. flood insurance / yr
- $473 – $860
Fire risk 1/10 · Minimal
- Est. fire insurance / yr
- $717 – $1,331
Heat risk 4/10 · Minor
- Hot days now (above 102°F)
- 7 days/yr
- Hot days in 30 yrs
- 19 days/yr
Wind risk 2/10 · Minimal
- Chance of severe wind over 30 yrs
- 0.0%
Air-quality risk 3/10 · Minor
- Unhealthy air days now
- 2 days/yr
- Unhealthy air days in 30 yrs
- 3 days/yr
Risk factors via First Street. Map © Google.
Why this score? — see what drove the D grade
The composite is a weighted blend of 9 inputs, each scored 0–100. Each bar is that input's sub-score; the figure is the points it added to the 100-point composite (weight × sub-score).
- Cash flow +15.3/30.0
- ARV discount +7.5/15.0
- DSCR +4.7/10.0
- 1% rule +4.1/10.0
- Rent growth +2.9/5.0
- Livability +2.5/5.0
- Condition / age +2.5/5.0
- Schools +1.4/10.0
- Appreciation +0.0/10.0
$138,500
🖨 Deal sheet 📄 Offer letter ✓ Due diligence
Listing remarks
Completely Renovated & Move-in Ready! This beautifully updated home features modern finishes and quality craftsmanship throughout. With soaring 10-foot ceilings, the home feels open, bright, and spacious from the moment you walk in. The fully renovated kitchen includes quartz countertops, stainless steel appliances, updated cabinetry, and a modern lighting package. Waterproof luxury vinyl plank flooring runs throughout the home, combining durability with style. The bathroom features a beautifully tiled tub surround with ceramic tiles extending to the ceiling for a clean, upscale finish. Major upgrades include all new plumbing, electrical, furnace, central air system, doors, and reces
Key facts
- Quartz countertops
- Ceramic tiles
- Updated cabinetry
Tags
Property features AI
Exterior
- Utilities: Public water; Municipal sewer connected
- Home design: Single-family residence; One story
- Construction: Vinyl siding; Block foundation
- Exterior features: Less than 1/4 acre lot (approximately 0.13 acres); Partial basement
Interior
- Kitchen: Dishwasher; Microwave; Electric oven; Refrigerator; Garbage disposal
- Bedrooms: 2 bedrooms on the main level
- Bathrooms: 1 full bathroom with tub and shower
- Heating & cooling: Natural gas heating; Central air conditioning
- Interior features: Attic access; Eat-in kitchen; Pantry; Walk-in closet(s)
- Laundry & utility: Main-level laundry
Neighborhood map
What this means for you Summary
Snapshot
- This is a 2-bed/1.0-bath single-family listed at $138k.
Deal economics
- At list price, monthly cash flow is $51 ($610/yr) — positive.
- The deal already cash-flows at list — no discount required.
- To meet the 1% rule (rent ≥ 1% of price), the offer needs to be $126k (9.4% below list).
- Recommended offer: $126k (9.4% below list) — sets the bar for 1% rule.
- Cap rate 6.7% vs local median 4.4% in Indianapolis city (balance) — top-decile yield for the area; either an underpriced asset or a hidden risk that comps aren't pricing in. Stress-test before assuming the spread holds.
Location & tenants
- Location reads: area grade D — affects rentability + tenant quality, not the cash-flow math above.
- Indianapolis Public Schools (urban): math 14% / reading 20% proficiency, ranked #286 of 301 in IN (top 95%) — low school quality limits family demand, transient renter base, plan for 1-2y turnover; 77% free/reduced lunch — lower-income household profile, screen leases tightly.
- Market conditions: Rents rising (+1.8%/yr); 43 active listings in the ZIP; 7 comparable units currently listed for rent nearby; rentals at typical pace (median 22d on market — plan ~3-4 weeks tenant-placement turnaround); 1,906 units permitted in Marion County in 2024 (621 in 5+ unit buildings).
Forward outlook
- Local home prices are declining (-3.0%/yr); year-one equity from $958 of loan paydown is wiped out by about $4k of value loss. Plan a longer hold.
- Marion County population projected at +18% by 2050 — long-run rental-demand tailwind backs the buy-and-hold thesis.
Negotiation context
- It's been on market 21 days — a 2% lower offer ($136k) is reasonable based on typical stale-listing flexibility.
Risks & watch-outs
- Watch-outs: built in 1910 — expect roof / HVAC / electrical / plumbing capex.
Questions for the listing agent
- Built in 1910 — when were the roof, HVAC, electrical panel, plumbing, and water heater last replaced?
- Is there a deadline driving the sale (1031 exchange, divorce, estate, relocation)? That informs how much negotiation room exists.
- The area grade is low — what's the realistic commute time and amenity access for the typical tenant pool here? Any planned neighborhood developments (good or bad) we should know about?
- What's the average days-on-market for RENTAL listings here right now (not sales)? A rising rental-DOM trend means longer vacancies and softer asking-rent achievability than the comps imply.
- What's the recent tenant-quality profile in this submarket — average credit score on applications, eviction rate, late-payment / NSF rate, and stable-employment percentage? A property-management company in the area should have these aggregated.
- How much new for-sale + rental construction is in the pipeline within 1–3 miles? Heavy new supply typically softens prices + rents 12–24 months out; constrained supply supports both.
Investment metrics
- 1% rule
- 0.91% ✗
- Cap rate
- 6.73%
- Cash-on-cash
- 1.57%
- DSCR
- 1.07
- GRM
- 9.2
CMA / ARV
- ARV (on-the-fly)
- $70,980
- Comps found
- 5
Show comp detail 5 sales within ~0.75 mi
| Address | Dist | Beds/Ba | Sqft | Sold | Price | $/sf | Match |
|---|---|---|---|---|---|---|---|
| 841 S Addison St | 0.49mi | 2/1.0 | 720 (+6%) | 0mo | $113,000 | $157 | 66 |
| 1909 and 1901 S Pershing Ave | 0.53mi | 2/1.0 | 728 (+8%) | 15mo | $68,000 | $93 | 50 |
| 2513 W Ray St | 0.41mi | 1/1.0 (-1) | 620 (-8%) | 15mo | $64,900 | $105 | 49 |
| 2110 W Mccarty St | 0.56mi | 2/1.0 | 768 (+14%) | 7mo | $61,000 | $79 | 45 |
| 733 S Holmes Ave | 0.62mi | 2/1.0 | 579 (-14%) | 10mo | $120,000 | $207 | 38 |
Match score weights: distance 35% · size 25% · config 20% · recency 20%. Top-matched comps best support the ARV.
Projected returns pro-forma
-3.0% appreciation · 1.79% rent growth · sell at horizon
- IRR
- -15.1%
- Equity multiple
- 0.47×
- Total profit
- $-20,707
- Equity at exit
- $20,651
- IRR
- -8.7%
- Equity multiple
- 0.49×
- Total profit
- $-19,874
- Equity at exit
- $11,975
Cash invested: $38,780 (down + closing). Projections, not guarantees.
Landlord ↔ Tenant lean methodology
- Overall (STATE)
- 90 Strongly Landlord-Friendly
- State Indiana
- 90 Strongly Landlord-Friendly · R+11
- County
- — inherits STATE
- City
- — inherits STATE
ZIP-level market 46221
- Home prices YoY
- -23.7%
- Rents YoY
- 1.8%
- Active inventory
- 43
- Price-to-rent
- 9.2×
Monthly cashflow live
- Estimated rent
- $1,256 high interval (Pro) →
- Mortgage (P&I)
- −$726
- Tax from tax record
- −$157 /mo · $1,884/yr
- Insurance
- −$58
- HOA
- −$0
- Vacancy / Maint / Mgmt
- −$264
- Net cashflow
- $51
Break-even live
UW: 25.0% down · 7.5% · 30yr · 1.5% tax · 5.0% vac · 8.0% maint · 8.0% mgmt
Financing live
Cash to close
- Down payment
- $34,625
- Closing costs
- $4,155
- Reserves months
- —
- Total cash needed
- —
Loan-product check · same deal, 3 products live
Conventional
25% down · 7.5% · 30yr
- Down + closing
- —
- Monthly P&I
- —
- Monthly cashflow
- —
- DSCR
- —
- Eligible?
- —
Personal DTI + credit; lowest rate.
DSCR
20% down · 8.5% · 30yr
- Down + closing
- —
- Monthly P&I
- —
- Monthly cashflow
- —
- DSCR
- —
- Eligible?
- —
No personal income docs; deal must DSCR.
Hard money
10% down · 12.0% · 12mo
- Down + closing
- —
- Monthly P&I
- —
- Monthly cashflow
- —
- DSCR
- —
- Eligible?
- —
Short-term bridge; refi at stabilization.
Rent comps 7 comps
| Address | Beds | Baths | Sqft | Rent | $/sqft | DOM | Units | Dist |
|---|---|---|---|---|---|---|---|---|
| 1925 Westview Dr Indianapolis, IN | 1.0 | 1.0 | 600 | $900 | $1.50 | 14d | 2 | 0.32mi |
| 1925 Westview Dr Unit 212 Indianapolis, IN | 1.0 | 1.0 | 600 | $900 | $1.50 | 7d | 1 | 0.32mi |
| 1925 Westview Dr Unit 100 Indianapolis, IN | 1.0 | 1.0 | 600 | $900 | $1.50 | 21d | 1 | 0.33mi |
| 841 S Addison St Indianapolis, IN | 2.0 | 1.0 | 750 | $1,295 | $1.73 | 43d | 1 | 0.46mi |
| 1909 S Pershing Ave Indianapolis, IN | 3.0 | 1.5 | 728 | $1,750 | $2.40 | 3d | 1 | 0.56mi |
| 1105 Blaine Ave Indianapolis, IN | 1.0–2.0 | 1.0–2.5 | 1157 | $1,795 | $1.55 | 23d | 1 | 0.68mi |
| 1918 W Washington St Unit 12 Indianapolis, IN | 1.0 | 1.0 | 600 | $950 | $1.58 | 43d | 1 | 1.24mi |
Listing history 14 events
-
2026-06-18days on market $138,500 Active 21 DOM
-
2026-06-17days on market $138,500 Active 20 DOM
-
2026-06-16days on market $138,500 Active 19 DOM
-
2026-06-15pricedays on market $138,500 Active 18 DOM
-
2026-06-13days on market $143,500 Active 16 DOM
-
2026-06-13days on market $143,500 Active 15 DOM
-
2026-06-09days on market $143,500 Active 12 DOM
-
2026-06-08days on market $143,500 Active 11 DOM
-
2026-06-07days on market $143,500 Active 10 DOM
-
2026-06-03days on market $143,500 Active 6 DOM
-
2026-06-02days on market $143,500 Active 5 DOM
-
2026-06-01days on market $143,500 Active 4 DOM
-
2026-05-31days on market $143,500 Active 3 DOM
-
2026-05-28$143,500 Active
ⓘ Source: listings_history table (triggers on properties + properties_extension) + one-shot
backfill from property_details.listing_events for pre-trigger history.
Tax reassessment forecast IN · Partial reset (capped growth)
- Current annual tax
- $1,884 · $157/mo
- Projected year-2 tax
- $1,884 · $157/mo
- Expected delta
- $0/yr ($0/mo · 0.0%)
ⓘ Screening estimate from a state-policy table — verify with the county assessor before closing.
Climate risk First Street
- Flood 1/10 Low FEMA zone X (unshaded) · 0% chance over 30 yrs
- Wildfire 1/10 Low
- Heat 4/10 Moderate 7 d/yr ≥102°F today · 19 d/yr by 30 yrs out
- Wind 2/10 Low 0% chance of damaging wind over 30 yrs
- Air quality 3/10 Moderate 2 unhealthy d/yr today · 3 by 30 yrs out
Nearby sold comps map
Loading sold comps map…
Walkable amenities ~0.75 mi
Loading nearby amenities…
Taxation est. · year 1
- Rental income
- $15,066
- − Mortgage interest
- −$7,758
- − Property taxes
- −$1,884
- − Insurance
- −$692
- − Repairs & maintenance
- −$1,205
- − Management
- −$1,205
- − Depreciation
- −$4,029
- Taxable loss
- −$1,708
- Est. tax savings @ 24.0%
- +$410
- After-tax cash flow
- $1,020/yr
For passive investors: Depreciation is non-cash, so a rental often shows a tax loss while cash-flowing — sheltering income. Rental losses are passive: they offset passive income freely, and up to $25,000/yr can offset ordinary (W-2) income if you actively participate and your MAGI is under $100k (phasing out to $0 by $150k); unused losses carry forward. On sale, claimed depreciation is recaptured at up to 25%, and gains may owe capital-gains tax (a 1031 exchange can defer both). Figures are a year-1 estimate at your 24.0% rate — not tax advice; consult a CPA.
Schools (NCES district)
- District
- Indianapolis Public Schools
- NCES district ID
- 1804770
- Math proficiency
- 14% ▼ -7.00%
- Reading proficiency
- 20% ▼ -3.00%
- Median HH income
- $32,034
- Composite
- 13.69/100
- National rank
- #9499
- State rank
- #286 of 301 in IN
Livability — Indianapolis city (balance)
No livability data for this city. (Only ~50 U.S. cities are tracked.)
Census & demographics
- Census place
- Indianapolis city (balance), IN
- County
- Marion County · 998,460 people
- City population
- 881,119
- Metro
- Indianapolis-Carmel-Anderson, IN
- Population (ZIP)
- 27,027
- Household income
- $65,280
- Rent vs Own
- Severe rent burden
- 1011.0
Population outlook (Marion County) Hauer SSP2
- Today (2025)
- 1,025,572 people
- By 2030
- 1,065,727 · +3.9%
- By 2040
- 1,141,577 · +11.3%
- By 2050
- 1,208,920 · +17.9%
- By 2075
- 1,367,288 · +33.3%
- By 2100
- 1,438,201 · +40.2%
Race, ethnicity, and origin ACS 2023
- Neighborhood character
- Predominantly White (69%)
- Race & ethnicity
- White 69% Black 13% Hispanic / Latino 13% Two or more races 7%
- Hispanic origin (detail)
- Mexican 7%
- Common ancestry
- Italian 2% Iranian 2% Lithuanian 2%
- Foreign-born
- 9% · Canada, China
- Languages at home
- 87% English-only · Spanish 9% Arabic 1%
Political lean MEDSL · Marion
- 2024 margin
- Strong D (+27.7) · D 63.0% · R 35.3% · Other 1.7%
- 2008→2024 swing
- -0.7pp no change · 2008: 28.4pp · 2024: 27.7pp
- All cycles
- 2024: D+27.7 2020: D+29.1 2016: D+22.8 2012: D+22.2 2008: D+28.4
Not yet ingested
- Civics
- —
Market trends
- HPI YoY
- ▼ -97.56%
- Current HPI
- 313.4711
- Rent YoY
- ▲ 1.79%
- Metro
- Indianapolis-Carmel-Anderson, IN
- State GDP YoY
- ▲ 2.90%
- F500 in state
- 18
Industry mix (Fortune 500 HQ in IN)
| Industry | F500 HQs | Revenue |
|---|---|---|
| Industrial Machinery | 2 | $37B |
|
||
| Healthcare | 1 | $177B |
|
||
| Pharmaceuticals | 1 | $45B |
|
||
| Metals / Steel | 1 | $18B |
|
||
| Agriculture | 1 | $17B |
|
||
| Packaging | 1 | $12B |
|
||
Price history
1 event — show timeline
- 2026-05-28 Listed $143,500 MIBOR as Distributed by MLS Grid
Property tax history
+10.0%/yrLatest (2025): $1,884 · +25.5% YoY. Source: county tax records.
Cash-flow waterfall
monthlySold comps — $/sqft
last 12 mo · ≤1 miLoading sold comps…