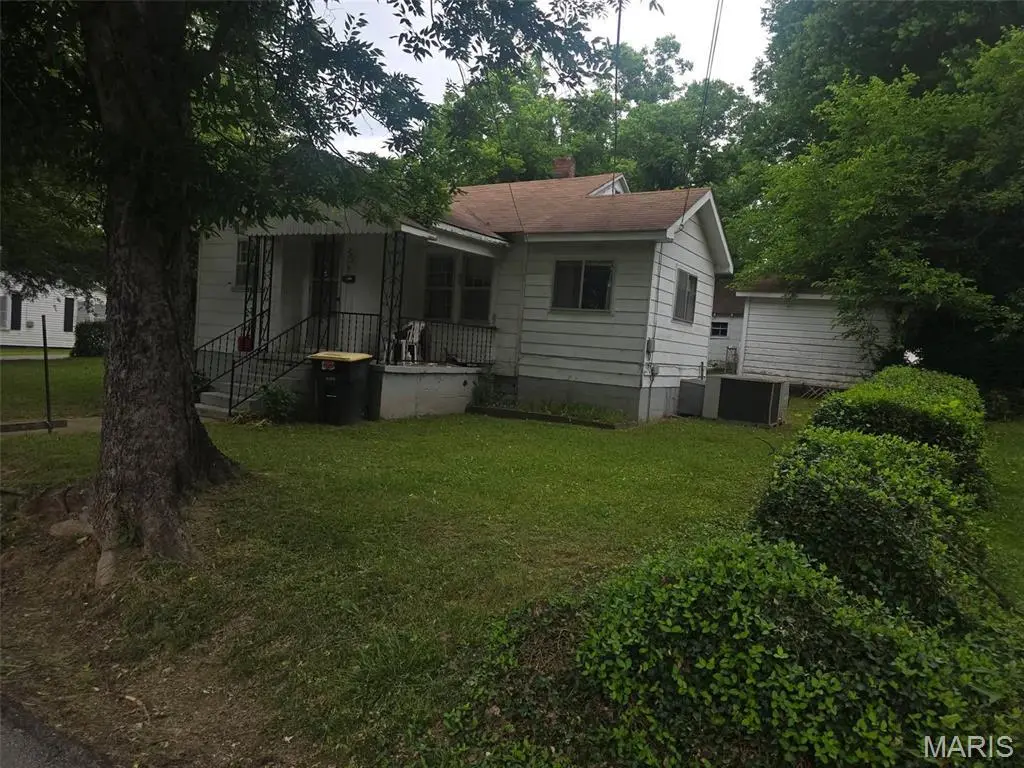
207 Morgan · Doniphan, MO
Flood risk No data
- FEMA flood zone
- —
- Chance of flooding over 30 yrs
- —
- Est. flood insurance / yr
- —
Fire risk No data
- Est. fire insurance / yr
- —
Heat risk No data
- Hot days now (above threshold)
- —
- Hot days in 30 yrs
- —
Wind risk No data
- Chance of severe wind over 30 yrs
- —
Air-quality risk No data
- Unhealthy air days now
- —
- Unhealthy air days in 30 yrs
- —
Risk factors via First Street. Map © Google.
Why this score? — see what drove the A- grade
The composite is a weighted blend of 9 inputs, each scored 0–100. Each bar is that input's sub-score; the figure is the points it added to the 100-point composite (weight × sub-score).
- Cash flow +30.0/30.0
- ARV discount +15.0/15.0
- 1% rule +10.0/10.0
- DSCR +10.0/10.0
- Appreciation +7.6/10.0
- Livability +3.0/5.0
- Schools +2.7/10.0
- Rent growth +2.5/5.0
- Condition / age +2.2/5.0
$59,900
🖨 Deal sheet 📄 Offer letter ✓ Due diligence
Key facts
- Built 1950
- Listed 29 days
Property features AI
Exterior
- Utilities: Public water; Public sewer; Electricity available
- Home design: Single-family residence; One level
- Construction: Built with Other construction materials; 1,121 above-grade finished area (assessor)
- Exterior features: Back yard
Interior
- Bedrooms: Two bedrooms on the main level
- Bathrooms: One full bathroom (main level)
- Heating & cooling: Electric heat; Central air conditioning
- Interior features: Seven total rooms
Neighborhood map
What this means for you Summary
Snapshot
- This is a 2-bed/1.0-bath single-family listed at $60k. Condition is rated fair.
Deal economics
- At list price, monthly cash flow is $358 ($4k/yr) — positive.
- The deal already cash-flows at list — no discount required.
- Meets the 1% rule at list price ($977 rent vs $60k).
- Recommended offer: $59k (1.5% below list) — sets the bar for market timing.
- Cap rate 13.5% vs local median 2.6% in Doniphan — top-decile yield for the area; either an underpriced asset or a hidden risk that comps aren't pricing in. Stress-test before assuming the spread holds.
Location & tenants
- Location reads 59/100 on livability (#568 in MO) — a working-class tenant base; expect higher turnover. Strengths: cost of living A+, housing A-; Watch: health & safety C-, amenities F, commute F.
- Doniphan R-I (rural): math 27% / reading 39% proficiency, ranked #254 of 324 in MO (top 78%) — families likely to look elsewhere, expect single-tenant / working-renter base with shorter leases; 63% free/reduced lunch — lower-income household profile, screen leases tightly.
- Zoned schools: Doniphan Elem. (378 students, 99% FRL); Doniphan High (math 54% / reading 57%, grade C, #61 of 521 statewide, top 12%, 476 students, 99% FRL) — zoned schools average 99% FRL vs 63% district-wide (36 pts higher); higher-poverty schools than district average — tighter screening recommended.
- Zoned-school proficiency averages 56% at this address vs 33% district-wide (+23 pts) — the actual schools serving this property are materially stronger than the Doniphan R-I average implies; a family-tenant draw the district grade alone would hide.
- Market conditions: 127 active listings in the ZIP.
Forward outlook
- In year one you build about $3k of equity ($414 loan paydown + $3k appreciation (5.1% local appreciation)).
- Ripley County population projected at -20% by 2050 — secular population decline; favor cash flow + early exit over multi-decade hold.
- At projected returns (5.1% appreciation + 3.0% rent growth), your $17k cash investment doubles in ~3 years — after that, you're playing with house money.
- By year 9, paydown + projected appreciation supports a ~$31k cash-out refi (75% LTV) — recoverable capital for the next deal without selling this one.
Negotiation context
- It's been on market 30 days — a 2% lower offer ($59k) is reasonable based on typical stale-listing flexibility.
- 2 sale attempts with the ask held roughly flat each time — persistent listings suggest the price (not the market) is what's stuck; bring a comps-based counter.
Risks & watch-outs
- Watch-outs: built in 1950 — expect roof / HVAC / electrical / plumbing capex.
Questions for the listing agent
- Have any recent inspections been done? Can we get a copy of the seller's disclosures and any deferred-maintenance estimates?
- Built in 1950 — when were the roof, HVAC, electrical panel, plumbing, and water heater last replaced?
- Is there a deadline driving the sale (1031 exchange, divorce, estate, relocation)? That informs how much negotiation room exists.
- Schools are D-rated, which usually means shorter tenancies and higher turnover. Who's the typical renter profile here, and what's been the actual vacancy rate?
- What's the average days-on-market for RENTAL listings here right now (not sales)? A rising rental-DOM trend means longer vacancies and softer asking-rent achievability than the comps imply.
- What's the recent tenant-quality profile in this submarket — average credit score on applications, eviction rate, late-payment / NSF rate, and stable-employment percentage? A property-management company in the area should have these aggregated.
- How much new for-sale + rental construction is in the pipeline within 1–3 miles? Heavy new supply typically softens prices + rents 12–24 months out; constrained supply supports both.
Investment metrics
- 1% rule
- 1.63% ✓
- Cap rate
- 13.47%
- Cash-on-cash
- 25.62%
- DSCR
- 2.14
- GRM
- 5.1
CMA / ARV
- ARV (on-the-fly)
- $91,922
- Comps found
- 10
Show comp detail 10 sales within ~0.75 mi
| Address | Dist | Beds/Ba | Sqft | Sold | Price | $/sf | Match |
|---|---|---|---|---|---|---|---|
| 904 N Lafayette St | 0.28mi | 2/1.0 | 1,008 (-10%) | 5mo | $89,000 | $88 | 66 |
| 203 E Young St | 0.32mi | 2/1.0 | 1,188 (+6%) | 12mo | $87,500 | $74 | 65 |
| 505 Plum | 0.52mi | 2/1.0 | 1,060 (-5%) | 3mo | $47,000 | $44 | 64 |
| 109 Brooks | 0.12mi | 3/1.0 (+1) | 1,026 (-8%) | 19mo | $98,900 | $96 | 60 |
| 406 Grand | 0.31mi | 2/1.0 | 1,209 (+8%) | 16mo | $75,000 | $62 | 59 |
| 701 E Locust | 0.70mi | 3/2.0 (+1) | 1,116 (-0%) | 8mo | $135,000 | $121 | 51 |
| 307 Locust | 0.45mi | 2/1.0 | 1,041 (-7%) | 19mo | $85,000 | $82 | 51 |
| 404 E Highway St | 0.65mi | 3/1.0 (+1) | 1,132 (+1%) | 16mo | $59,900 | $53 | 49 |
| 505 Elm St | 0.51mi | 3/1.5 (+1) | 1,112 (-1%) | 24mo | $78,000 | $70 | 48 |
| 420 E Spring St | 0.48mi | 2/1.5 | 1,035 (-8%) | 22mo | $99,900 | $97 | 45 |
Match score weights: distance 35% · size 25% · config 20% · recency 20%. Top-matched comps best support the ARV.
Projected returns pro-forma
5.14% appreciation · 3.0% rent growth · sell at horizon
- IRR
- 35.5%
- Equity multiple
- 3.21×
- Total profit
- $37,110
- Equity at exit
- $34,454
- IRR
- 33.7%
- Equity multiple
- 6.50×
- Total profit
- $92,282
- Equity at exit
- $59,888
Cash invested: $16,772 (down + closing). Projections, not guarantees.
Landlord ↔ Tenant lean methodology
- Overall (STATE)
- 81 Strongly Landlord-Friendly
- State Missouri
- 81 Strongly Landlord-Friendly · R+10
- County
- — inherits STATE
- City
- — inherits STATE
ZIP-level market 63935
- Home prices YoY
- 4.4%
- Active inventory
- 127
- Price-to-rent
- 5.1×
Monthly cashflow live
- Estimated rent
- $977 medium interval (Pro) →
- Mortgage (P&I)
- −$314
- Tax est. 1.5%
- −$75 /mo · $898/yr
- Insurance
- −$25
- HOA
- −$0
- Vacancy / Maint / Mgmt
- −$205
- Net cashflow
- $358
Break-even live
UW: 25.0% down · 7.5% · 30yr · 1.5% tax · 5.0% vac · 8.0% maint · 8.0% mgmt
Financing live
Cash to close
- Down payment
- $14,975
- Closing costs
- $1,797
- Reserves months
- —
- Total cash needed
- —
Loan-product check · same deal, 3 products live
Conventional
25% down · 7.5% · 30yr
- Down + closing
- —
- Monthly P&I
- —
- Monthly cashflow
- —
- DSCR
- —
- Eligible?
- —
Personal DTI + credit; lowest rate.
DSCR
20% down · 8.5% · 30yr
- Down + closing
- —
- Monthly P&I
- —
- Monthly cashflow
- —
- DSCR
- —
- Eligible?
- —
No personal income docs; deal must DSCR.
Hard money
10% down · 12.0% · 12mo
- Down + closing
- —
- Monthly P&I
- —
- Monthly cashflow
- —
- DSCR
- —
- Eligible?
- —
Short-term bridge; refi at stabilization.
Listing history 17 events
-
2026-06-18days on market $59,900 Active 30 DOM
-
2026-06-17days on market $59,900 Active 29 DOM
-
2026-06-16days on market $59,900 Active 28 DOM
-
2026-06-15days on market $59,900 Active 27 DOM
-
2026-06-13days on market $59,900 Active 25 DOM
-
2026-06-12days on market $59,900 Active 24 DOM
-
2026-06-09days on market $59,900 Active 21 DOM
-
2026-06-08days on market $59,900 Active 20 DOM
-
2026-06-07days on market $59,900 Active 19 DOM
-
2026-06-07days on market $59,900 Active 18 DOM
-
2026-06-04days on market $59,900 Active 15 DOM
-
2026-06-02days on market $59,900 Active 14 DOM
-
2026-06-01days on market $59,900 Active 13 DOM
-
2026-05-31days on market $59,900 Active 12 DOM
-
2026-05-19status Active
-
2026-05-19status Pending
-
2026-05-19$59,900 Active
ⓘ Source: listings_history table (triggers on properties + properties_extension) + one-shot
backfill from property_details.listing_events for pre-trigger history.
Nearby sold comps map
Loading sold comps map…
Walkable amenities ~0.75 mi
Loading nearby amenities…
Taxation est. · year 1
- Rental income
- $11,728
- − Mortgage interest
- −$3,355
- − Property taxes
- −$898
- − Insurance
- −$300
- − Repairs & maintenance
- −$938
- − Management
- −$938
- − Depreciation
- −$1,743
- Taxable income
- $3,556
- Est. tax owed @ 24.0%
- −$853
- After-tax cash flow
- $3,444/yr
For passive investors: Depreciation is non-cash, so a rental often shows a tax loss while cash-flowing — sheltering income. Rental losses are passive: they offset passive income freely, and up to $25,000/yr can offset ordinary (W-2) income if you actively participate and your MAGI is under $100k (phasing out to $0 by $150k); unused losses carry forward. On sale, claimed depreciation is recaptured at up to 25%, and gains may owe capital-gains tax (a 1031 exchange can defer both). Figures are a year-1 estimate at your 24.0% rate — not tax advice; consult a CPA.
Condition & rehab AI · 13 photos
The home is in fair condition with some minor repairs and maintenance needed. Painting the exterior and interior will significantly improve its value and appeal.
Repairs flagged
- Minor Kitchen cabinets — The cabinets are in good condition but could benefit from a fresh coat of paint.
- Minor Bathroom vanity — The vanity is in good condition but could benefit from a fresh coat of paint.
- Minor Exterior siding — The siding is in fair condition but could benefit from a fresh coat of paint.
- Minor Flooring — The flooring is in average condition but could benefit from a fresh coat of paint.
- Minor Interior walls — The walls are in average condition but could benefit from a fresh coat of paint.
Value-add opportunities
- Both Painting — Painting the exterior and interior will improve the home's curb appeal and interior condition, making it more attractive to potential buyers and renters.
- Both Landscaping — Landscaping will improve the home's curb appeal and make it more attractive to potential buyers and renters.
Renovation cost estimate screening
| Repair item | Severity | Est. cost |
|---|---|---|
| Kitchen cabinets · The cabinets are in good condition but could benefit from a fresh coat of paint. | Minor | $500–3,000 |
| Bathroom vanity · The vanity is in good condition but could benefit from a fresh coat of paint. | Minor | $500–3,000 |
| Exterior siding · The siding is in fair condition but could benefit from a fresh coat of paint. | Minor | $500–3,000 |
| Flooring · The flooring is in average condition but could benefit from a fresh coat of paint. | Minor | $500–3,000 |
| Interior walls · The walls are in average condition but could benefit from a fresh coat of paint. | Minor | $500–3,000 |
| Total estimated repair cost · 5 items | $2,500–15,000 |
Value-add ROI direction
- Both Painting — Painting the exterior and interior will improve the home's curb appeal and interior condition, making it more attractive to potential buyers and renters. ↑
- Both Landscaping — Landscaping will improve the home's curb appeal and make it more attractive to potential buyers and renters. ↑
ⓘ Cost ranges are severity-bucket heuristics (US national rule-of-thumb). Get contractor quotes + a written scope before underwriting a rehab budget.
Schools (NCES district)
- District
- Doniphan R-I
- NCES district ID
- 2910920
- Math proficiency
- 27% ▼ -3.00%
- Reading proficiency
- 39% ▼ -1.00%
- Median HH income
- $31,818
- Composite
- 26.91/100
- National rank
- #7085
- State rank
- #254 of 324 in MO
Livability — Doniphan
- Score
- 59/100
- State rank
- #568
- US rank
- #20561
Category grades
Schools grade is shown separately in the Schools card above.
Census & demographics
- Census place
- Doniphan, MO
- Population (ZIP)
- 8,017
Population outlook (Ripley County) Hauer SSP2
- Today (2025)
- 13,011 people
- By 2030
- 12,515 · -3.8%
- By 2040
- 11,512 · -11.5%
- By 2050
- 10,427 · -19.9%
- By 2075
- 7,833 · -39.8%
- By 2100
- 5,692 · -56.3%
Race, ethnicity, and origin ACS 2023
- Neighborhood character
- Predominantly White (93%)
- Race & ethnicity
- White 93% Two or more races 5% Hispanic / Latino 1%
- Common ancestry
- Romanian 3% Slovak 3% Serbian 2%
- Foreign-born
- 1% · Canada
Political lean MEDSL · Ripley
- 2024 margin
- Solid R (+73.0) · D 13.2% · R 86.2%
- 2008→2024 swing
- -43.0pp toward R · 2008: -30.1pp · 2024: -73.0pp
- All cycles
- 2024: R+73.0 2020: R+70.1 2016: R+66.9 2012: R+44.6 2008: R+30.1
Not yet ingested
- Civics
- —
Market trends
- HPI YoY
- ▲ 5.14%
- Current HPI
- 122.3339
- Rent YoY
- —
- Metro
- —
- State GDP YoY
- ▲ 1.84%
- F500 in state
- 20
Industry mix (Fortune 500 HQ in MO)
| Industry | F500 HQs | Revenue |
|---|---|---|
| Healthcare | 1 | $163B |
|
||
| Insurance | 1 | $21B |
|
||
| Industrial Technology | 1 | $17B |
|
||
| Retail | 1 | $16B |
|
||
| Industrial Distribution | 1 | $10B |
|
||
| Utilities | 1 | $9B |
|
||
Price history
3 events — show timeline
- 2026-05-19 Relisted — MARIS as Distributed by MLS Grid
- 2026-05-19 Pending — MARIS as Distributed by MLS Grid
- 2026-05-19 Listed $59,900 MARIS as Distributed by MLS Grid
Cash-flow waterfall
monthlySold comps — $/sqft
last 12 mo · ≤1 miLoading sold comps…