1212 Carr Pl · Oshkosh, WI
Flood risk 1/10 · Minimal
- FEMA flood zone
- X (unshaded)
- Chance of flooding over 30 yrs
- 0.0%
- Est. flood insurance / yr
- $473 – $860
Fire risk 1/10 · Minimal
- Est. fire insurance / yr
- $636 – $1,182
Heat risk 2/10 · Minimal
- Hot days now (above 97°F)
- 7 days/yr
- Hot days in 30 yrs
- 13 days/yr
Wind risk 2/10 · Minimal
- Chance of severe wind over 30 yrs
- —
Air-quality risk 2/10 · Minimal
- Unhealthy air days now
- 1 days/yr
- Unhealthy air days in 30 yrs
- 2 days/yr
Risk factors via First Street. Map © Google.
Why this score? — see what drove the D+ grade
The composite is a weighted blend of 9 inputs, each scored 0–100. Each bar is that input's sub-score; the figure is the points it added to the 100-point composite (weight × sub-score).
- ARV discount +15.0/15.0
- Cash flow +11.0/30.0
- Livability +4.2/5.0
- Rent growth +3.7/5.0
- DSCR +3.2/10.0
- 1% rule +3.1/10.0
- Schools +2.9/10.0
- Condition / age +2.5/5.0
- Appreciation +0.0/10.0
$169,900
🖨 Deal sheet 📄 Offer letter ✓ Due diligence
Listing remarks MLS
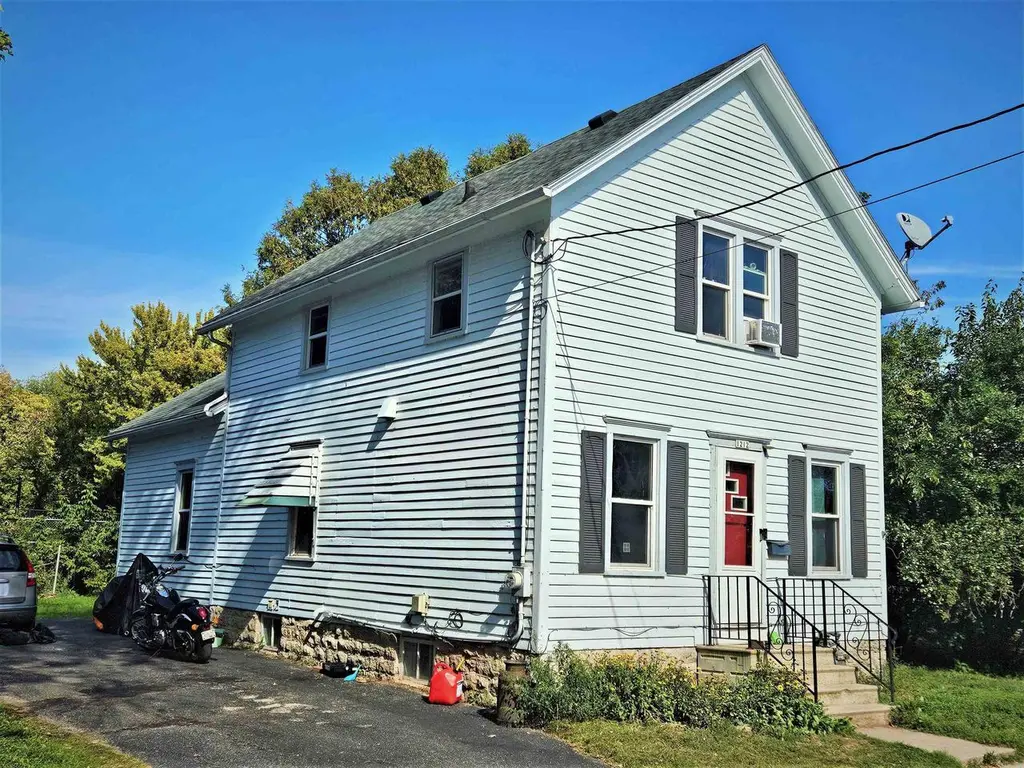
E-Side of Oshkosh 1.5 story Farmhouse set on cul-de-sac and close to neighborhood park. Enclosed porch. Currently leased to long-term tenant at $995 per month thru 10/31/2026. All utilities paid by tenant.
Key facts
- Manageable size yard
- Partial basement
- E-side of oshkosh
Tags
Property features AI
Finance
- Other: Included with the home: range and refrigerator; Exclusions: personal property of tenants
Exterior
- Utilities: Municipal water; Municipal sewer
- Home design: 2-story single-family home; Construction completed; Property zoned residential
- Construction: Finished above-grade area approximately 1,360; Finished below-grade area: 0; Lot size about 0.12 acre; Year built information from assessor/public records
- Exterior features: Cedar exterior; Sidewalks on the lot
Interior
- Kitchen: Kitchen on the main level (approx. 14 x 11); Includes range/oven and refrigerator
- Bedrooms: Primary bedroom on the upper level (approx. 14 x 11); Second bedroom on the upper level (approx. 13 x 11); Third bedroom on the main level (approx. 9 x 7); Fourth bedroom on the main level (approx. 8 x 7)
- Bathrooms: One full bathroom
- Heating & cooling: Forced air heating; Natural gas fuel
- Interior features: Partial basement with block and stone walls; Living room on the main level; Dining room on the main level; Den/office on the main level
- Laundry & utility: No specific laundry details provided
Neighborhood map
What this means for you Summary
Snapshot
- This is a 2-bed/1.0-bath other listed at $170k.
Deal economics
- At list price, monthly cash flow is $-70 ($-841/yr) — negative.
- To cash-flow at today's rent, offer at most $158k (7.3% below list).
- To meet the 1% rule (rent ≥ 1% of price), the offer needs to be $138k (18.7% below list).
- Recommended offer: $138k (18.7% below list) — sets the bar for 1% rule.
- Cap rate 5.8% vs local median 3.7% in Oshkosh — top-decile yield for the area; either an underpriced asset or a hidden risk that comps aren't pricing in. Stress-test before assuming the spread holds.
Location & tenants
- Location reads 85/100 on livability (#29 in WI, #574 nationally) — a professional / high-income tenant draw. Strengths: cost of living A+, housing A+, health & safety A+.
- Oshkosh Area School District (urban): math 33% / reading 34% proficiency, ranked #246 of 342 in WI (top 72%) — families likely to look elsewhere, expect single-tenant / working-renter base with shorter leases.
- Market conditions: Rents rising fast (+5.0%/yr); 82 active listings in the ZIP; 21 comparable units currently listed for rent nearby; rentals at typical pace (median 21d on market — plan ~3-4 weeks tenant-placement turnaround); 43% of comp listings sitting > 30 days — soft ceiling on asking rent; 652 units permitted in Winnebago County in 2024 (333 in 5+ unit buildings).
Forward outlook
- Local home prices are declining (-3.0%/yr); year-one equity from $1k of loan paydown is wiped out by about $5k of value loss. Plan a longer hold.
- Winnebago County population projected at +3% by 2050 — modest demand growth; plan on rents tracking national, not racing it.
Negotiation context
- It's been on market 56 days — a 3% lower offer ($165k) is reasonable based on typical stale-listing flexibility.
- 2 sale attempts with the ask held roughly flat each time — persistent listings suggest the price (not the market) is what's stuck; bring a comps-based counter.
- Current owner paid $78k; list at $170k implies a 119% gain — meaningful room to come down on a strong offer.
Risks & watch-outs
- Watch-outs: built in 1888 — expect roof / HVAC / electrical / plumbing capex.
Questions for the listing agent
- What do current leases actually rent for vs. the listed asking? Can we see a recent rent roll and the last 12 months of T-12 income?
- It's been on market 56 days. Have you received any prior offers? Is the seller open to a 19% concession, seller financing, or rate buy-down credit?
- Built in 1888 — when were the roof, HVAC, electrical panel, plumbing, and water heater last replaced?
- Is there a deadline driving the sale (1031 exchange, divorce, estate, relocation)? That informs how much negotiation room exists.
- The area grade is low — what's the realistic commute time and amenity access for the typical tenant pool here? Any planned neighborhood developments (good or bad) we should know about?
- What's the average days-on-market for RENTAL listings here right now (not sales)? A rising rental-DOM trend means longer vacancies and softer asking-rent achievability than the comps imply.
- What's the recent tenant-quality profile in this submarket — average credit score on applications, eviction rate, late-payment / NSF rate, and stable-employment percentage? A property-management company in the area should have these aggregated.
- How much new for-sale + rental construction is in the pipeline within 1–3 miles? Heavy new supply typically softens prices + rents 12–24 months out; constrained supply supports both.
Investment metrics
- 1% rule
- 0.81% ✗
- Cap rate
- 5.80%
- Cash-on-cash
- -1.77%
- DSCR
- 0.92
- GRM
- 10.3
CMA / ARV
- ARV (median comp)
- $206,852
- List price
- $169,900
- Delta
- -17.86%
- Verdict
- UNDERPRICED
- Comps
- 20 within 1.0 mi
Projected returns pro-forma
-3.0% appreciation · 4.97% rent growth · sell at horizon
- IRR
- -17.1%
- Equity multiple
- 0.39×
- Total profit
- $-29,190
- Equity at exit
- $25,333
- IRR
- -5.7%
- Equity multiple
- 0.60×
- Total profit
- $-19,189
- Equity at exit
- $14,690
Cash invested: $47,572 (down + closing). Projections, not guarantees.
Landlord ↔ Tenant lean methodology
- Overall (STATE)
- 73 Landlord-Friendly
- State Wisconsin
- 73 Landlord-Friendly · R+2
- County
- — inherits STATE
- City
- — inherits STATE
ZIP-level market 54901
- Rents YoY
- 5.0%
- Active inventory
- 82
- Price-to-rent
- 10.3×
Monthly cashflow live
- Estimated rent
- $1,381 high interval (Pro) →
- Mortgage (P&I)
- −$891
- Tax from tax record
- −$199 /mo · $2,392/yr
- Insurance
- −$71
- HOA
- −$0
- Vacancy / Maint / Mgmt
- −$290
- Net cashflow
- $-70
Break-even live
UW: 25.0% down · 7.5% · 30yr · 1.5% tax · 5.0% vac · 8.0% maint · 8.0% mgmt
Financing live
Cash to close
- Down payment
- $42,475
- Closing costs
- $5,097
- Reserves months
- —
- Total cash needed
- —
Loan-product check · same deal, 3 products live
Conventional
25% down · 7.5% · 30yr
- Down + closing
- —
- Monthly P&I
- —
- Monthly cashflow
- —
- DSCR
- —
- Eligible?
- —
Personal DTI + credit; lowest rate.
DSCR
20% down · 8.5% · 30yr
- Down + closing
- —
- Monthly P&I
- —
- Monthly cashflow
- —
- DSCR
- —
- Eligible?
- —
No personal income docs; deal must DSCR.
Hard money
10% down · 12.0% · 12mo
- Down + closing
- —
- Monthly P&I
- —
- Monthly cashflow
- —
- DSCR
- —
- Eligible?
- —
Short-term bridge; refi at stabilization.
Rent comps 21 comps
| Address | Beds | Baths | Sqft | Rent | $/sqft | DOM | Units | Dist |
|---|---|---|---|---|---|---|---|---|
| 835 Waugoo Ave Unit A Oshkosh, WI | 2.0 | 1.0 | 1000 | $995 | $0.99 | 44d | 1 | 0.40mi |
| 513 Evans St Unit 1514469P Oshkosh, WI | 3.0 | 1.5 | 1270 | $2,909 | $2.29 | 21d | 1 | 0.73mi |
| 548 Bowen St Oshkosh, WI | 2.0 | 1.0 | 900 | $850 | $0.94 | 13d | 1 | 0.81mi |
| 1119 S Main St Unit 1121 Oshkosh, WI | 3.0 | 1.0 | 1066 | $1,250 | $1.17 | 21d | 1 | 0.83mi |
| 100 N Main St Oshkosh, WI | 2.0 | 2.0 | 1100 | $1,495 | $1.36 | 13d | 1 | 0.85mi |
| 1120 E Parkway Ave Oshkosh, WI | 2.0 | 2.0 | 950 | $1,195 | $1.26 | 13d | 1 | 0.85mi |
| 35 W 14th Ave Unit 35A Oshkosh, WI | 2.0 | 1.0 | 1000 | $1,000 | $1.00 | 44d | 1 | 0.94mi |
| 106 W 9th Ave Oshkosh, WI | 2.0 | 1.0 | 900 | $995 | $1.11 | 44d | 1 | 0.94mi |
| 622 Grand St Oshkosh, WI | 2.0 | 1.0 | 900 | $895 | $0.99 | 44d | 1 | 1.02mi |
| 212 W 8th Ave Oshkosh, WI | 2.0 | 1.0 | 1100 | $1,099 | $1.00 | 21d | 1 | 1.04mi |
| 417 Marion Rd Oshkosh, WI | 1.0–2.0 | 1.0–2.0 | 778 | $2,500 | $3.21 | 13d | 10 | 1.15mi |
| 319 E Irving Ave Oshkosh, WI | 3.0 | 1.5 | 1384 | $1,250 | $0.90 | 44d | 1 | 1.16mi |
| 155 Jackson St Oshkosh, WI | 2.0 | 1.0–2.0 | 716 | $1,775 | $2.48 | 21d | 8 | 1.20mi |
| 1745 Oregon St Oshkosh, WI | 1.0–3.0 | 1.0–2.0 | 1079 | $1,282 | $1.19 | 13d | 6 | 1.28mi |
| 650 N Main St Oshkosh, WI | 1.0–3.0 | 1.0–2.0 | 925 | $1,524 | $1.65 | 21d | 12 | 1.30mi |
| 95 Dawes St Oshkosh, WI | 3.0 | 2.0 | 1520 | $1,650 | $1.09 | 44d | 1 | 1.36mi |
| 512 Algoma Blvd Unit 212 Oshkosh, WI | 2.0 | 1.0 | 900 | $999 | $1.11 | 13d | 1 | 1.38mi |
| 405 Michigan St Unit 1061622P Oshkosh, WI | 2.0 | 1.0 | 1097 | $2,526 | $2.30 | 21d | 1 | 1.43mi |
| 416 W 17th Ave Unit 416 Oshkosh, WI | 3.0 | 1.5 | 1100 | $1,450 | $1.32 | 44d | 1 | 1.43mi |
| 306 Wisconsin St Oshkosh, WI | 3.0 | 1.0 | 1500 | $1,500 | $1.00 | 44d | 1 | 1.46mi |
| 532 W 5th Ave Oshkosh, WI | 2.0 | 1.0 | 1120 | $2,495 | $2.23 | 44d | 1 | 1.48mi |
Listing history 21 events
-
2026-06-19days on market $169,900 Active 56 DOM
-
2026-06-18days on market $169,900 Active 55 DOM
-
2026-06-17days on market $169,900 Active 54 DOM
-
2026-06-16days on market $169,900 Active 53 DOM
-
2026-06-15days on market $169,900 Active 52 DOM
-
2026-06-14days on market $169,900 Active 50 DOM
-
2026-06-13days on market $169,900 Active 49 DOM
-
2026-06-10days on market $169,900 Active 47 DOM
-
2026-06-09days on market $169,900 Active 46 DOM
-
2026-06-08days on market $169,900 Active 45 DOM
-
2026-06-07pricedays on market $169,900 Active 44 DOM
-
2026-06-02days on market $175,000 Active 39 DOM
-
2026-06-01days on market $175,000 Active 38 DOM
-
2026-05-31days on market $175,000 Active 37 DOM
-
2026-05-30days on market $175,000 Active 36 DOM
-
2026-04-23$175,000 Active 310-char remark
-
2026-04-18historical 205-char remark
Show marketing remark (205 chars)
E-Side of Oshkosh 1.5 story Farmhouse set on cul-de-sac and close to neighborhood park. Enclosed porch. Currently leased to long-term tenant at $995 per month thru 10/31/2026. All utilities paid by tenant.
-
2025-10-17$175,000 Active 205-char remark
Show marketing remark (205 chars)
E-Side of Oshkosh 1.5 story Farmhouse set on cul-de-sac and close to neighborhood park. Enclosed porch. Currently leased to long-term tenant at $995 per month thru 10/31/2026. All utilities paid by tenant.
-
2005-10-06soldstatus $77,500
-
2003-03-28soldstatus $16,500
-
2003-03-28soldstatus $21,100
ⓘ Source: listings_history table (triggers on properties + properties_extension) + one-shot
backfill from property_details.listing_events for pre-trigger history.
Tax reassessment forecast WI · Partial reset (capped growth)
- Current annual tax
- $2,392 · $199/mo
- Projected year-2 tax
- $2,768 · $231/mo
- Expected delta
- +$376/yr (+$31/mo · 15.7%)
ⓘ Screening estimate from a state-policy table — verify with the county assessor before closing.
Climate risk First Street
- Flood 1/10 Low FEMA zone X (unshaded) · 0% chance over 30 yrs
- Wildfire 1/10 Low
- Heat 2/10 Low 7 d/yr ≥97°F today · 13 d/yr by 30 yrs out
- Wind 2/10 Low
- Air quality 2/10 Low 1 unhealthy d/yr today · 2 by 30 yrs out
Nearby sold comps map
Loading sold comps map…
Walkable amenities ~0.75 mi
Loading nearby amenities…
Taxation est. · year 1
- Rental income
- $16,573
- − Mortgage interest
- −$9,517
- − Property taxes
- −$2,392
- − Insurance
- −$850
- − Repairs & maintenance
- −$1,326
- − Management
- −$1,326
- − Depreciation
- −$4,943
- Taxable loss
- −$3,780
- Est. tax savings @ 24.0%
- +$907
- After-tax cash flow
- $66/yr
For passive investors: Depreciation is non-cash, so a rental often shows a tax loss while cash-flowing — sheltering income. Rental losses are passive: they offset passive income freely, and up to $25,000/yr can offset ordinary (W-2) income if you actively participate and your MAGI is under $100k (phasing out to $0 by $150k); unused losses carry forward. On sale, claimed depreciation is recaptured at up to 25%, and gains may owe capital-gains tax (a 1031 exchange can defer both). Figures are a year-1 estimate at your 24.0% rate — not tax advice; consult a CPA.
Schools (NCES district)
- District
- Oshkosh Area School District
- NCES district ID
- 5511190
- Math proficiency
- 33% ▼ -7.00%
- Reading proficiency
- 34% ▼ -2.00%
- Median HH income
- $48,048
- Composite
- 28.92/100
- National rank
- #6634
- State rank
- #246 of 342 in WI
Livability — Oshkosh
- Score
- 85/100
- State rank
- #29
- US rank
- #574
Category grades
Schools grade is shown separately in the Schools card above.
Census & demographics
- Census place
- Oshkosh, WI
- County
- Winnebago County · 155,689 people
- City population
- 81,810
- Metro
- Oshkosh-Neenah, WI
- Population (ZIP)
- 37,294
- Household income
- $61,794
- Rent vs Own
- Severe rent burden
- 1484.0
Population outlook (Winnebago County) Hauer SSP2
- Today (2025)
- 175,480 people
- By 2030
- 177,928 · +1.4%
- By 2040
- 180,873 · +3.1%
- By 2050
- 181,302 · +3.3%
- By 2075
- 184,071 · +4.9%
- By 2100
- 175,932 · +0.3%
Race, ethnicity, and origin ACS 2023
- Neighborhood character
- Predominantly White (80%)
- Race & ethnicity
- White 80% Black 6% Hispanic / Latino 6% Two or more races 5% Asian 4%
- Hispanic origin (detail)
- Mexican 3% Puerto Rican 2%
- Common ancestry
- Romanian 6% Portuguese 4% Lithuanian 2%
- Foreign-born
- 4% · Canada
- Languages at home
- 93% English-only · Other Asian/Pacific 2% Spanish 2% Arabic 1%
Political lean MEDSL · Winnebago
- 2024 margin
- Toss-up / Even · D 46.9% · R 51.7% · Other 1.4%
- 2008→2024 swing
- -16.4pp toward R · 2008: 11.7pp · 2024: -4.8pp
- All cycles
- 2024: R+4.8 2020: R+4.0 2016: R+7.4 2012: D+3.8 2008: D+11.7
Not yet ingested
- Civics
- —
Market trends
- HPI YoY
- ▼ -128.12%
- Current HPI
- 187.7253
- Rent YoY
- ▲ 4.97%
- Metro
- Oshkosh-Neenah, WI
- State GDP YoY
- ▲ 2.10%
- F500 in state
- 20
Industry mix (Fortune 500 HQ in WI)
| Industry | F500 HQs | Revenue |
|---|---|---|
| Industrial Machinery | 4 | $23B |
|
||
| Industrial Technology | 2 | $36B |
|
||
| Insurance | 1 | $36B |
|
||
| Professional Services | 1 | $19B |
|
||
| Utilities | 1 | $9B |
|
||
| Consumer Goods | 1 | $3B |
|
||
Price history
+929.7% since first listed7 events — show timeline
- 2026-06-03 Price Changed $169,900 RANW
- 2026-04-23 Listed $175,000 RANW
- 2026-04-18 Listing Removed — RANW
- 2025-10-17 Listed $175,000 RANW
- 2005-10-06 Sold (Public Records) $77,500 Public Records
- 2003-03-28 Sold (Public Records) $21,100 Public Records
- 2003-03-28 Sold (Public Records) $16,500 Public Records
Property tax history
+3.8%/yrLatest (2024): $2,392 · +18.7% YoY. Source: county tax records.
Cash-flow waterfall
monthlySold comps — $/sqft
last 12 mo · ≤1 miLoading sold comps…