 🏗️ New Construction
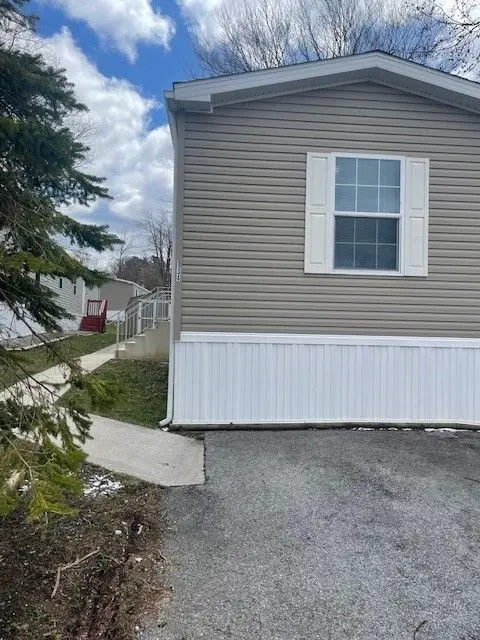
EAGLE RIVER 134E Laurel Woods Plan · Cresson, PA
Flood risk 3/10 · Minor
- FEMA flood zone
- X (unshaded)
- Chance of flooding over 30 yrs
- 0.2%
- Est. flood insurance / yr
- $507 – $1,088
Fire risk 2/10 · Minimal
- Est. fire insurance / yr
- $511 – $949
Heat risk 2/10 · Minimal
- Hot days now (above 89°F)
- 7 days/yr
- Hot days in 30 yrs
- 18 days/yr
Wind risk 2/10 · Minimal
- Chance of severe wind over 30 yrs
- —
Air-quality risk 3/10 · Minor
- Unhealthy air days now
- 2 days/yr
- Unhealthy air days in 30 yrs
- 4 days/yr
Risk factors via First Street. Map © Google.
Why this score? — see what drove the C+ grade
The composite is a weighted blend of 9 inputs, each scored 0–100. Each bar is that input's sub-score; the figure is the points it added to the 100-point composite (weight × sub-score).
- Cash flow +25.2/30.0
- DSCR +8.3/10.0
- ARV discount +7.5/15.0
- 1% rule +6.6/10.0
- Condition / age +3.8/5.0
- Schools +3.6/10.0
- Livability +3.5/5.0
- Rent growth +2.5/5.0
- Appreciation +0.0/10.0
$69,300
🖨 Deal sheet 📄 Offer letter ✓ Due diligence
Listing remarks MLS
Large rooms!
Key facts
- Large rooms
- Listed 609 days
Tags
Neighborhood map
What this means for you Summary
Snapshot
- This is a 3-bed/2.0-bath manufactured listed at $69k. Condition is rated good.
Deal economics
- At list price, monthly cash flow is $179 ($2k/yr) — positive.
- The deal already cash-flows at list — no discount required.
- Meets the 1% rule at list price ($925 rent vs $69k).
- Recommended offer: $61k (12.0% below list) — sets the bar for market timing.
- Cap rate 9.0% vs local median 5.4% in Cresson — top-decile yield for the area; either an underpriced asset or a hidden risk that comps aren't pricing in. Stress-test before assuming the spread holds.
Location & tenants
- Location reads 70/100 on livability (#767 in PA) — a middle-class / working-renter tenant base. Strengths: schools A+, crime A+, cost of living A+; Watch: amenities F, commute F, employment F.
- Penn Cambria SD (town): math 29% / reading 57% proficiency, ranked #304 of 539 in PA (top 56%) — families likely to look elsewhere, expect single-tenant / working-renter base with shorter leases.
- Market conditions: 32 active listings in the ZIP; 1 comparable units currently listed for rent nearby; 64 units permitted in Cambria County in 2024 (0 in 5+ unit buildings).
Forward outlook
- Local home prices are declining (-3.0%/yr); year-one equity from $552 of loan paydown is wiped out by about $2k of value loss. Plan a longer hold.
- Cambria County population projected at -28% by 2050 — secular population decline; favor cash flow + early exit over multi-decade hold.
Negotiation context
- It's been on market 609 days — a 12% lower offer ($61k) is reasonable based on typical stale-listing flexibility.
Questions for the listing agent
- It's been on market 609 days. Have you received any prior offers? Is the seller open to a 12% concession, seller financing, or rate buy-down credit?
- Why hasn't it sold? Are there any deal-killer items the seller is aware of (foundation, flood, title, zoning, code violations)?
- Is there a deadline driving the sale (1031 exchange, divorce, estate, relocation)? That informs how much negotiation room exists.
- Schools are A-rated — typically a magnet for longer-tenancy family renters. What's the average tenant stay here, and is there a school-zone premium baked into asking?
- What's the average days-on-market for RENTAL listings here right now (not sales)? A rising rental-DOM trend means longer vacancies and softer asking-rent achievability than the comps imply.
- What's the recent tenant-quality profile in this submarket — average credit score on applications, eviction rate, late-payment / NSF rate, and stable-employment percentage? A property-management company in the area should have these aggregated.
- How much new for-sale + rental construction is in the pipeline within 1–3 miles? Heavy new supply typically softens prices + rents 12–24 months out; constrained supply supports both.
Investment metrics
- 1% rule
- 1.16% ✓
- Cap rate
- 8.97%
- Cash-on-cash
- 9.58%
- DSCR
- 1.43
- GRM
- 7.2
CMA / ARV
- ARV (median comp)
- $79,900
- List price
- $69,300
- Delta
- -13.27%
- Verdict
- UNDERPRICED
- Comps
- 1 within 2.0 mi
Projected returns pro-forma
-3.0% appreciation · 3.0% rent growth · sell at horizon
- IRR
- -1.8%
- Equity multiple
- 0.93×
- Total profit
- $-1,559
- Equity at exit
- $11,913
- IRR
- 7.9%
- Equity multiple
- 1.60×
- Total profit
- $13,344
- Equity at exit
- $6,908
Cash invested: $22,372 (down + closing). Projections, not guarantees.
Landlord ↔ Tenant lean methodology
- Overall (STATE)
- 62 Landlord-Friendly
- State Pennsylvania
- 62 Landlord-Friendly · EVEN
- County
- — inherits STATE
- City
- — inherits STATE
ZIP-level market 16630
- Active inventory
- 32
- Price-to-rent
- 6.2×
Monthly cashflow live
- Estimated rent
- $925 medium interval (Pro) →
- Mortgage (P&I)
- −$419
- Tax est. 1.5%
- −$100 /mo · $1,198/yr
- Insurance
- −$33
- HOA
- −$0
- Vacancy / Maint / Mgmt
- −$194
- Net cashflow
- $179
Break-even live
UW: 25.0% down · 7.5% · 30yr · 1.5% tax · 5.0% vac · 8.0% maint · 8.0% mgmt
Financing live
Cash to close
- Down payment
- $19,975
- Closing costs
- $2,397
- Reserves months
- —
- Total cash needed
- —
Loan-product check · same deal, 3 products live
Conventional
25% down · 7.5% · 30yr
- Down + closing
- —
- Monthly P&I
- —
- Monthly cashflow
- —
- DSCR
- —
- Eligible?
- —
Personal DTI + credit; lowest rate.
DSCR
20% down · 8.5% · 30yr
- Down + closing
- —
- Monthly P&I
- —
- Monthly cashflow
- —
- DSCR
- —
- Eligible?
- —
No personal income docs; deal must DSCR.
Hard money
10% down · 12.0% · 12mo
- Down + closing
- —
- Monthly P&I
- —
- Monthly cashflow
- —
- DSCR
- —
- Eligible?
- —
Short-term bridge; refi at stabilization.
Rent comps 1 comps
| Address | Beds | Baths | Sqft | Rent | $/sqft | DOM | Units | Dist |
|---|---|---|---|---|---|---|---|---|
| 1943 Saint Joseph St Cresson, PA | 3.0 | 2.0 | 1120 | $925 | $0.83 | 43d | 1 | 0.03mi |
Listing history 18 events
-
2026-06-19days on market $69,300 Active 609 DOM
-
2026-06-18days on market $69,300 Active 608 DOM
-
2026-06-17days on market $69,300 Active 607 DOM
-
2026-06-16days on market $69,300 Active 606 DOM
-
2026-06-15days on market $69,300 Active 605 DOM
-
2026-06-14days on market $69,300 Active 603 DOM
-
2026-06-13days on market $69,300 Active 602 DOM
-
2026-06-10days on market $69,300 Active 600 DOM
-
2026-06-09days on market $69,300 Active 599 DOM
-
2026-06-08days on market $69,300 Active 598 DOM
-
2026-06-07days on market $69,300 Active 597 DOM
-
2026-06-03days on market $69,300 Active 593 DOM
-
2026-06-02days on market $69,300 Active 592 DOM
-
2026-06-01days on market $69,300 Active 591 DOM
-
2026-05-31days on market $69,300 Active 590 DOM
-
2026-05-30days on market $69,300 Active 589 DOM
-
2025-02-12price $69,300 12-char remark
Show marketing remark (12 chars)
Large rooms!
-
2024-10-18$69,000 Active 12-char remark
Show marketing remark (12 chars)
Large rooms!
ⓘ Source: listings_history table (triggers on properties + properties_extension) + one-shot
backfill from property_details.listing_events for pre-trigger history.
Climate risk First Street
- Flood 3/10 Moderate FEMA zone X (unshaded) · 20% chance over 30 yrs
- Wildfire 2/10 Low
- Heat 2/10 Low 7 d/yr ≥89°F today · 18 d/yr by 30 yrs out
- Wind 2/10 Low
- Air quality 3/10 Moderate 2 unhealthy d/yr today · 4 by 30 yrs out
Nearby sold comps map
Loading sold comps map…
Walkable amenities ~0.75 mi
Loading nearby amenities…
Taxation est. · year 1
- Rental income
- $11,100
- − Mortgage interest
- −$4,476
- − Property taxes
- −$1,198
- − Insurance
- −$400
- − Repairs & maintenance
- −$888
- − Management
- −$888
- − Depreciation
- −$2,324
- Taxable income
- $926
- Est. tax owed @ 24.0%
- −$222
- After-tax cash flow
- $1,921/yr
For passive investors: Depreciation is non-cash, so a rental often shows a tax loss while cash-flowing — sheltering income. Rental losses are passive: they offset passive income freely, and up to $25,000/yr can offset ordinary (W-2) income if you actively participate and your MAGI is under $100k (phasing out to $0 by $150k); unused losses carry forward. On sale, claimed depreciation is recaptured at up to 25%, and gains may owe capital-gains tax (a 1031 exchange can defer both). Figures are a year-1 estimate at your 24.0% rate — not tax advice; consult a CPA.
Condition & rehab AI · 13 photos
This manufactured home is in good condition with cosmetic updates needed to enhance its resale and rental value.
Repairs flagged
- Minor Kitchen cabinets — Worn appearance
- Minor Bathroom fixtures — Dated appearance
Value-add opportunities
- Both Paint interior walls — Fresh paint enhances curb appeal and interior aesthetics
- Both Replace dated kitchen cabinets — New cabinets improve functionality and aesthetics
- Both Replace dated bathroom fixtures — New fixtures improve functionality and aesthetics
Renovation cost estimate screening
| Repair item | Severity | Est. cost |
|---|---|---|
| Kitchen cabinets · Worn appearance | Minor | $500–3,000 |
| Bathroom fixtures · Dated appearance | Minor | $500–3,000 |
| Total estimated repair cost · 2 items | $1,000–6,000 |
Value-add ROI direction
- Both Paint interior walls — Fresh paint enhances curb appeal and interior aesthetics ↑
- Both Replace dated kitchen cabinets — New cabinets improve functionality and aesthetics ↑
- Both Replace dated bathroom fixtures — New fixtures improve functionality and aesthetics ↑
ⓘ Cost ranges are severity-bucket heuristics (US national rule-of-thumb). Get contractor quotes + a written scope before underwriting a rehab budget.
Schools (NCES district)
- District
- Penn Cambria SD
- NCES district ID
- 4213770
- Math proficiency
- 29% ▼ -21.00%
- Reading proficiency
- 57% ▼ -12.00%
- Median HH income
- $45,952
- Composite
- 36.48/100
- National rank
- #4657
- State rank
- #304 of 539 in PA
Livability — Cresson
- Score
- 70/100
- State rank
- #767
- US rank
- #7975
Category grades
Schools grade is shown separately in the Schools card above.
Census & demographics
- City population
- 4,771
- Population (ZIP)
- 4,771
Population outlook (Cambria County) Hauer SSP2
- Today (2025)
- 122,754 people
- By 2030
- 115,827 · -5.6%
- By 2040
- 101,309 · -17.5%
- By 2050
- 88,379 · -28.0%
- By 2075
- 65,237 · -46.9%
- By 2100
- 46,909 · -61.8%
Race, ethnicity, and origin ACS 2023
- Neighborhood character
- Predominantly White (94%)
- Race & ethnicity
- White 94% Two or more races 3% Black 1%
- Common ancestry
- Romanian 14% Scotch-Irish 2% Lithuanian 2%
- Foreign-born
- 2% · Canada, China
- Languages at home
- 98% English-only · Other Indo-European 1% Spanish 1%
Political lean MEDSL · Cambria
- 2024 margin
- Solid R (+39.7) · D 29.8% · R 69.5%
- 2008→2024 swing
- -40.4pp toward R · 2008: 0.7pp · 2024: -39.7pp
- All cycles
- 2024: R+39.7 2020: R+37.3 2016: R+37.8 2012: R+17.8 2008: D+0.7
Not yet ingested
- Civics
- —
Market trends
- HPI YoY
- ▼ -73.81%
- Current HPI
- 112.0315
- Rent YoY
- —
- Metro
- —
- State GDP YoY
- ▲ 1.68%
- F500 in state
- 34
Industry mix (Fortune 500 HQ in PA)
| Industry | F500 HQs | Revenue |
|---|---|---|
| Healthcare | 2 | $309B |
|
||
| Insurance | 2 | $27B |
|
||
| Telecommunications / Media | 1 | $124B |
|
||
| Industrial Distribution | 1 | $22B |
|
||
| Financial Services | 1 | $20B |
|
||
| Chemicals / Materials | 1 | $18B |
|
||
Price history
+0.4% since first listed2 events — show timeline
- 2025-02-12 Price Changed $69,300 Zillow
- 2024-10-18 Listed $69,000 Zillow
Cash-flow waterfall
monthlySold comps — $/sqft
last 12 mo · ≤1 miLoading sold comps…