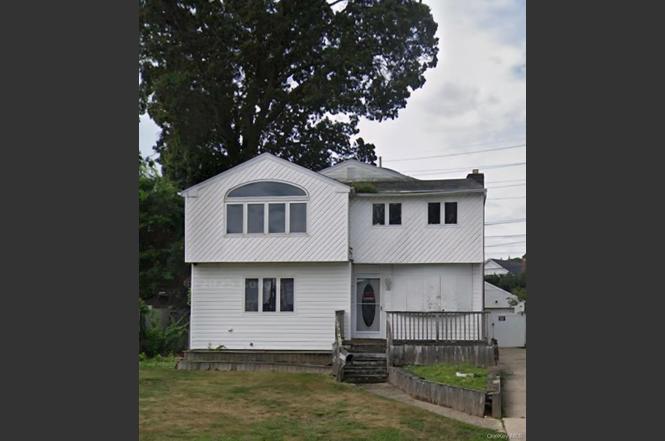
2434 Martin Ave · Bellmore, NY
Flood risk 3/10 · Minor
- FEMA flood zone
- X (unshaded)
- Chance of flooding over 30 yrs
- 0.2%
- Est. flood insurance / yr
- $507 – $1,088
Fire risk 1/10 · Minimal
- Est. fire insurance / yr
- $691 – $1,283
Heat risk 6/10 · Moderate
- Hot days now (above 95°F)
- 7 days/yr
- Hot days in 30 yrs
- 16 days/yr
Wind risk 6/10 · Moderate
- Chance of severe wind over 30 yrs
- 71.0%
Air-quality risk 4/10 · Minor
- Unhealthy air days now
- 3 days/yr
- Unhealthy air days in 30 yrs
- 5 days/yr
Risk factors via First Street. Map © Google.
Why this score? — see what drove the B grade
The composite is a weighted blend of 9 inputs, each scored 0–100. Each bar is that input's sub-score; the figure is the points it added to the 100-point composite (weight × sub-score).
- Cash flow +30.0/30.0
- 1% rule +10.0/10.0
- DSCR +10.0/10.0
- ARV discount +7.5/15.0
- Schools +5.9/10.0
- Livability +4.2/5.0
- Rent growth +2.5/5.0
- Condition / age +2.5/5.0
- Appreciation +0.0/10.0
$199,900
🖨 Deal sheet 📄 Offer letter ✓ Due diligence
Listing remarks
SHORT SALE, SUBJECT TO LENDERS APPROVAL, LAND ONLY- FIRE DAMAGE STRUCTURE. COMPLETE GUT AND RE-DO OR KNOCKDOWN. CASH ONLY. SOLD AS IS, LAND ONLY.
Key facts
- 9,735 sq ft lot
- Pool
- Built 1943
Neighborhood map
What this means for you Summary
Snapshot
- This is a 4-bed/2.0-bath single-family listed at $200k.
Deal economics
- At list price, monthly cash flow is $1k ($13k/yr) — positive.
- The deal already cash-flows at list — no discount required.
- Meets the 1% rule at list price ($4k rent vs $200k).
- Recommended offer: $197k (1.5% below list) — sets the bar for market timing.
- Cap rate 12.6% vs local median 1.7% in Bellmore — top-decile yield for the area; either an underpriced asset or a hidden risk that comps aren't pricing in. Stress-test before assuming the spread holds.
Location & tenants
- Location reads 84/100 on livability (#46 in NY, #740 nationally) — a professional / high-income tenant draw. Strengths: crime A+, commute A+, employment A+; Watch: cost of living F.
- North Bellmore Union Free School District (suburban): math 60% / reading 66% proficiency, ranked #151 of 590 in NY (top 26%) — acceptable for families but not a draw, mixed tenant base, ~2y average lease; only 8% free/reduced lunch — higher-income household profile.
- Zoned schools: Martin Avenue Elementary School (math 64% / reading 74%, grade A-, #447 of 2,108 statewide, top 24%, 311 students, 17% FRL).
- Market conditions: 141 active listings in the ZIP; 1 comparable units currently listed for rent nearby; 824 units permitted in Nassau County in 2024 (153 in 5+ unit buildings).
Forward outlook
- Local home prices are declining (-3.0%/yr); year-one equity from $1k of loan paydown is wiped out by about $6k of value loss. Plan a longer hold.
- Nassau County population projected at +7% by 2050 — modest demand growth; plan on rents tracking national, not racing it.
- At projected returns (-3.0% appreciation + 3.0% rent growth), your $56k cash investment doubles in ~6 years — after that, you're playing with house money.
Negotiation context
- It's been on market 16 days — a 2% lower offer ($197k) is reasonable based on typical stale-listing flexibility.
- 2 sale attempts since 3y ago with the ask held roughly flat each time — persistent listings suggest the price (not the market) is what's stuck; bring a comps-based counter.
Risks & watch-outs
- Watch-outs: property tax is 3.5% of price; built in 1943 — expect roof / HVAC / electrical / plumbing capex.
- Climate carrying-cost: major wind risk, 71% chance of damaging wind over 30y; extreme-heat days projected 7→16/yr by 2055 (HVAC capex compounding) — expect insurance premiums to compound above CPI over the hold.
Questions for the listing agent
- Built in 1943 — when were the roof, HVAC, electrical panel, plumbing, and water heater last replaced?
- Property tax is high relative to price — has the assessment been appealed recently, and will the sale trigger a re-assessment?
- Is there a deadline driving the sale (1031 exchange, divorce, estate, relocation)? That informs how much negotiation room exists.
- Schools are A-rated — typically a magnet for longer-tenancy family renters. What's the average tenant stay here, and is there a school-zone premium baked into asking?
- What's the average days-on-market for RENTAL listings here right now (not sales)? A rising rental-DOM trend means longer vacancies and softer asking-rent achievability than the comps imply.
- What's the recent tenant-quality profile in this submarket — average credit score on applications, eviction rate, late-payment / NSF rate, and stable-employment percentage? A property-management company in the area should have these aggregated.
- How much new for-sale + rental construction is in the pipeline within 1–3 miles? Heavy new supply typically softens prices + rents 12–24 months out; constrained supply supports both.
Investment metrics
- 1% rule
- 1.75% ✓
- Cap rate
- 12.60%
- Cash-on-cash
- 22.54%
- DSCR
- 2.00
- GRM
- 4.8
CMA / ARV
- ARV (on-the-fly)
- $1,239,225
- Comps found
- 12
Show comp detail 12 sales within ~0.75 mi
| Address | Dist | Beds/Ba | Sqft | Sold | Price | $/sf | Match |
|---|---|---|---|---|---|---|---|
| 10 Airway Dr | 0.09mi | 5/4.0 (+1) | 2,451 (-8%) | 6mo | $935,000 | $381 | 64 |
| 2282 Sycamore Pl | 0.57mi | 4/3.0 | 2,700 (+1%) | 5mo | $1,450,000 | $537 | 63 |
| 1776 Roberta Ln | 0.41mi | 4/2.0 | 2,846 (+7%) | 10mo | $850,000 | $299 | 61 |
| 2175 Helene Ave | 0.60mi | 4/2.5 | 2,606 (-2%) | 10mo | $1,260,000 | $483 | 58 |
| 201 Argyle Pl | 0.62mi | 4/3.5 | 2,600 (-2%) | 5mo | $1,210,000 | $465 | 57 |
| 2730 Court St | 0.53mi | 4/2.0 | 2,384 (-10%) | 2mo | $850,000 | $357 | 56 |
| 204 Margaret Blvd | 0.44mi | 5/2.0 (+1) | 2,364 (-11%) | 3mo | $1,100,000 | $465 | 53 |
| 2693 Martin Ave | 0.49mi | 3/2.0 (-1) | 2,300 (-14%) | 6mo | $856,000 | $372 | 44 |
| 2171 Seneca Dr S | 0.73mi | 5/3.0 (+1) | 2,416 (-9%) | 0mo | $1,220,000 | $505 | 41 |
| 1271 Pea Pond Rd | 0.70mi | 5/2.0 (+1) | 2,420 (-9%) | 8mo | $872,500 | $361 | 40 |
| 70 Loines Ave | 0.75mi | 4/2.5 | 2,310 (-13%) | 9mo | $1,250,000 | $541 | 33 |
| 2147 Seneca Dr N | 0.71mi | 5/3.0 (+1) | 2,326 (-13%) | 5mo | $1,115,000 | $479 | 32 |
Match score weights: distance 35% · size 25% · config 20% · recency 20%. Top-matched comps best support the ARV.
Projected returns pro-forma
-3.0% appreciation · 3.0% rent growth · sell at horizon
- IRR
- 15.5%
- Equity multiple
- 1.62×
- Total profit
- $34,822
- Equity at exit
- $29,806
- IRR
- 24.2%
- Equity multiple
- 3.10×
- Total profit
- $117,586
- Equity at exit
- $17,284
Cash invested: $55,972 (down + closing). Projections, not guarantees.
Landlord ↔ Tenant lean methodology
- Overall (STATE)
- 15 Strongly Tenant-Friendly
- State New York
- 15 Strongly Tenant-Friendly · D+10
- County
- — inherits STATE
- City
- — inherits STATE
ZIP-level market 11710
- Active inventory
- 141
- Price-to-rent
- 4.8×
Monthly cashflow live
- Estimated rent
- $3,500 medium interval (Pro) →
- Mortgage (P&I)
- −$1,048
- Tax from tax record
- −$582 /mo · $6,985/yr
- Insurance
- −$83
- HOA
- −$0
- Vacancy / Maint / Mgmt
- −$735
- Net cashflow
- $1,051
Break-even live
UW: 25.0% down · 7.5% · 30yr · 1.5% tax · 5.0% vac · 8.0% maint · 8.0% mgmt
Financing live
Cash to close
- Down payment
- $49,975
- Closing costs
- $5,997
- Reserves months
- —
- Total cash needed
- —
Loan-product check · same deal, 3 products live
Conventional
25% down · 7.5% · 30yr
- Down + closing
- —
- Monthly P&I
- —
- Monthly cashflow
- —
- DSCR
- —
- Eligible?
- —
Personal DTI + credit; lowest rate.
DSCR
20% down · 8.5% · 30yr
- Down + closing
- —
- Monthly P&I
- —
- Monthly cashflow
- —
- DSCR
- —
- Eligible?
- —
No personal income docs; deal must DSCR.
Hard money
10% down · 12.0% · 12mo
- Down + closing
- —
- Monthly P&I
- —
- Monthly cashflow
- —
- DSCR
- —
- Eligible?
- —
Short-term bridge; refi at stabilization.
Rent comps 1 comps
| Address | Beds | Baths | Sqft | Rent | $/sqft | DOM | Units | Dist |
|---|---|---|---|---|---|---|---|---|
| 42 Hamilton Rd Unit Left North Merrick, NY | 3.0 | 1.0 | 2100 | $3,500 | $1.67 | 1d | 1 | 1.22mi |
Listing history 8 events
-
2026-02-07status Pending
-
2026-01-15$199,900 Active
-
2023-05-10status Pending
-
2023-05-10historical
-
2023-04-25$199,900 Active
-
2005-02-01soldstatus $605,000
-
2005-02-01soldstatus $605,000
-
1988-03-17soldstatus $285,000
ⓘ Source: listings_history table (triggers on properties + properties_extension) + one-shot
backfill from property_details.listing_events for pre-trigger history.
Tax reassessment forecast NY · Partial reset (capped growth)
- Current annual tax
- $6,985 · $582/mo
- Projected year-2 tax
- $6,985 · $582/mo
- Expected delta
- $0/yr ($0/mo · 0.0%)
ⓘ Screening estimate from a state-policy table — verify with the county assessor before closing.
Climate risk First Street
- Flood 3/10 Moderate FEMA zone X (unshaded) · 20% chance over 30 yrs
- Wildfire 1/10 Low
- Heat 6/10 Major 7 d/yr ≥95°F today · 16 d/yr by 30 yrs out
- Wind 6/10 Major 71% chance of damaging wind over 30 yrs
- Air quality 4/10 Moderate 3 unhealthy d/yr today · 5 by 30 yrs out
Nearby sold comps map
Loading sold comps map…
Walkable amenities ~0.75 mi
Loading nearby amenities…
Taxation est. · year 1
- Rental income
- $42,000
- − Mortgage interest
- −$11,198
- − Property taxes
- −$6,985
- − Insurance
- −$1,000
- − Repairs & maintenance
- −$3,360
- − Management
- −$3,360
- − Depreciation
- −$5,815
- Taxable income
- $10,282
- Est. tax owed @ 24.0%
- −$2,468
- After-tax cash flow
- $10,148/yr
For passive investors: Depreciation is non-cash, so a rental often shows a tax loss while cash-flowing — sheltering income. Rental losses are passive: they offset passive income freely, and up to $25,000/yr can offset ordinary (W-2) income if you actively participate and your MAGI is under $100k (phasing out to $0 by $150k); unused losses carry forward. On sale, claimed depreciation is recaptured at up to 25%, and gains may owe capital-gains tax (a 1031 exchange can defer both). Figures are a year-1 estimate at your 24.0% rate — not tax advice; consult a CPA.
Schools (NCES district)
- District
- North Bellmore Union Free School District
- NCES district ID
- 3620940
- Math proficiency
- 60% ▲ 3.00%
- Reading proficiency
- 66% ▲ 12.00%
- Median HH income
- $108,596
- Composite
- 59.15/100
- National rank
- #950
- State rank
- #151 of 590 in NY
Livability — Bellmore
- Score
- 84/100
- State rank
- #46
- US rank
- #740
Category grades
Schools grade is shown separately in the Schools card above.
Census & demographics
- Census place
- Bellmore, NY
- City population
- 34,459
- Population (ZIP)
- 34,459
Population outlook (Nassau County) Hauer SSP2
- Today (2025)
- 1,409,302 people
- By 2030
- 1,431,482 · +1.6%
- By 2040
- 1,471,607 · +4.4%
- By 2050
- 1,502,845 · +6.6%
- By 2075
- 1,575,403 · +11.8%
- By 2100
- 1,554,356 · +10.3%
Race, ethnicity, and origin ACS 2023
- Neighborhood character
- Predominantly White (78%)
- Race & ethnicity
- White 78% Hispanic / Latino 10% Two or more races 8% Asian 5% Black 2%
- Hispanic origin (detail)
- Puerto Rican 4%
- Common ancestry
- Scotch-Irish 5% Romanian 5% Italian 1%
- Foreign-born
- 10% · Canada, China, Dominican Republic
- Languages at home
- 84% English-only · Spanish 6% Other Indo-European 4% Chinese 1%
Political lean MEDSL · Nassau
- 2024 margin
- Toss-up / Even · D 47.9% · R 52.1%
- 2008→2024 swing
- -12.6pp toward R · 2008: 8.4pp · 2024: -4.2pp
- All cycles
- 2024: R+4.2 2020: D+9.5 2016: D+5.3 2012: D+6.7 2008: D+8.4
Not yet ingested
- Civics
- —
Market trends
- HPI YoY
- ▼ -733.80%
- Current HPI
- 294.8496
- Rent YoY
- —
- Metro
- —
- State GDP YoY
- ▲ 2.60%
- F500 in state
- 92
Industry mix (Fortune 500 HQ in NY)
| Industry | F500 HQs | Revenue |
|---|---|---|
| Financial Services | 10 | $950B |
|
||
| Consumer Goods | 9 | $162B |
|
||
| Insurance | 4 | $225B |
|
||
| Telecommunications | 2 | $144B |
|
||
| Pharmaceuticals | 2 | $112B |
|
||
| Media / Entertainment | 2 | $69B |
|
||
Price history
-29.9% since first listed8 events — show timeline
- 2026-02-07 Pending — OneKey® MLS as Distributed by MLS Grid
- 2026-01-15 Listed $199,900 OneKey® MLS as Distributed by MLS Grid
- 2023-05-10 Pending — OneKey® MLS as Distributed by MLS Grid
- 2023-05-10 Listing Removed — OneKey® MLS as Distributed by MLS Grid
- 2023-04-25 Listed $199,900 OneKey® MLS as Distributed by MLS Grid
- 2005-02-01 Sold (Public Records) $605,000 Public Records
- 2005-02-01 Sold (Public Records) $605,000 Public Records
- 1988-03-17 Sold (Public Records) $285,000 Public Records
Property tax history
-3.5%/yrLatest (2024): $6,985 · -2.5% YoY. Source: county tax records.
Cash-flow waterfall
monthlySold comps — $/sqft
last 12 mo · ≤1 miLoading sold comps…