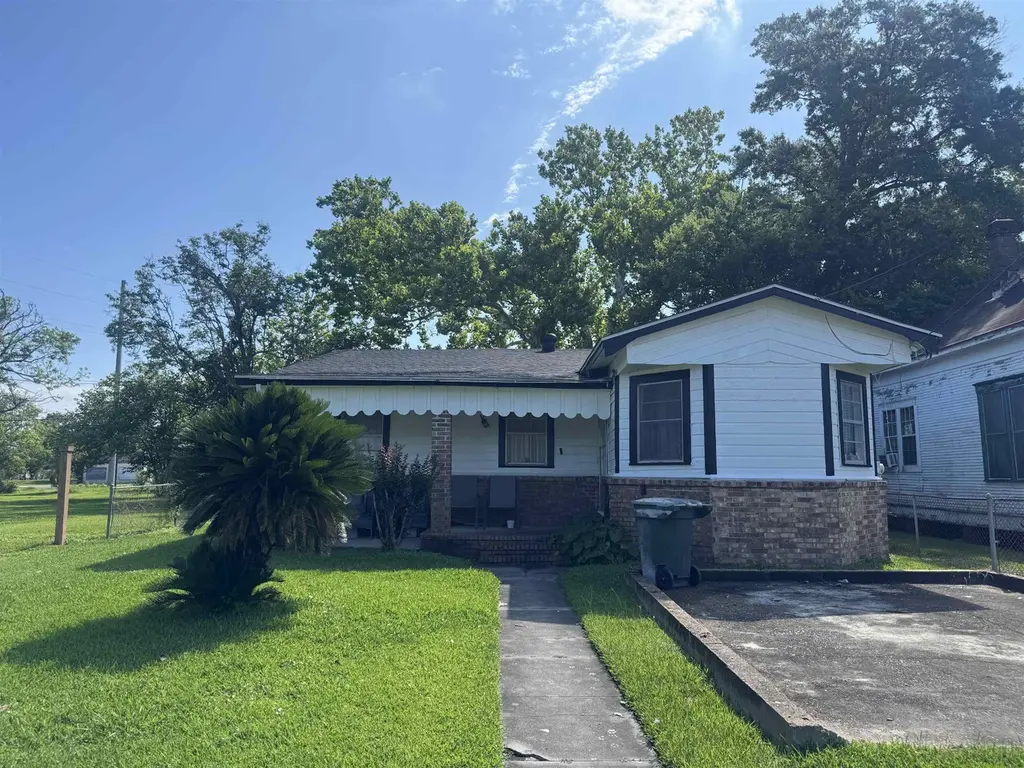
2060 Cable Ave · Beaumont, TX
Flood risk 1/10 · Minimal
- FEMA flood zone
- X
- Chance of flooding over 30 yrs
- 0.0%
- Est. flood insurance / yr
- $507 – $1,088
Fire risk 1/10 · Minimal
- Est. fire insurance / yr
- $1,222 – $2,270
Heat risk 9/10 · Severe
- Hot days now (above 109°F)
- 7 days/yr
- Hot days in 30 yrs
- 24 days/yr
Wind risk 9/10 · Severe
- Chance of severe wind over 30 yrs
- 99.0%
Air-quality risk 2/10 · Minimal
- Unhealthy air days now
- 1 days/yr
- Unhealthy air days in 30 yrs
- 1 days/yr
Risk factors via First Street. Map © Google.
Why this score? — see what drove the B grade
The composite is a weighted blend of 9 inputs, each scored 0–100. Each bar is that input's sub-score; the figure is the points it added to the 100-point composite (weight × sub-score).
- Cash flow +30.0/30.0
- 1% rule +10.0/10.0
- DSCR +10.0/10.0
- Appreciation +7.7/10.0
- ARV discount +7.5/15.0
- Livability +3.2/5.0
- Rent growth +2.5/5.0
- Condition / age +2.5/5.0
- Schools +1.5/10.0
$75,000
🖨 Deal sheet 📄 Offer letter ✓ Due diligence
Listing remarks
This well maintained home offers more than you think. It has 3 bedrooms, 1 bathroom, a family room and combo dining/den area. Recently updated including freshly painted exterior, countertops, air condition and flooring. Roof installed in 2022.
Key facts
- Roof installed
- Updated countertops
- Updated flooring
Tags
Property features AI
Finance
- Financial info: Annual tax roughly $1,699
Exterior
- Home design: Single Family Residence
- Exterior features: Single-family residential property
Interior
- Bathrooms: 1 full bathroom
- Interior features: Located in the North subdivision
Neighborhood map
What this means for you Summary
Snapshot
- This is a 3-bed/1.0-bath single-family listed at $75k.
Deal economics
- At list price, monthly cash flow is $410 ($5k/yr) — positive.
- The deal already cash-flows at list — no discount required.
- Meets the 1% rule at list price ($1k rent vs $75k).
- Cap rate 12.9% vs local median 5.3% in Beaumont — top-decile yield for the area; either an underpriced asset or a hidden risk that comps aren't pricing in. Stress-test before assuming the spread holds.
Location & tenants
- Location reads 64/100 on livability (#739 in TX) — a middle-class / working-renter tenant base. Strengths: cost of living A+, housing A+, health & safety A+; Watch: employment D, schools D-, crime F.
- Beaumont ISD (urban): math 14% / reading 22% proficiency, ranked #789 of 826 in TX (top 96%) — low school quality limits family demand, transient renter base, plan for 1-2y turnover; 69% free/reduced lunch — lower-income household profile, screen leases tightly.
- Market conditions: 79 active listings in the ZIP; 16 comparable units currently listed for rent nearby; rentals at typical pace (median 24d on market — plan ~3-4 weeks tenant-placement turnaround); lower-income renter base — watch delinquency; 343 units permitted in Jefferson County in 2024 (0 in 5+ unit buildings).
- This rent runs 44% of the median local income ($32k/yr) — at the standard rent-burdened threshold; future hikes will face affordability resistance.
Forward outlook
- In year one you build about $5k of equity ($519 loan paydown + $4k appreciation (5.4% local appreciation)).
- At projected returns (5.4% appreciation + 3.0% rent growth), your $21k cash investment doubles in ~3 years — after that, you're playing with house money.
- By year 8, paydown + projected appreciation supports a ~$35k cash-out refi (75% LTV) — recoverable capital for the next deal without selling this one.
Negotiation context
- Only 5 days on market — expect competitive offers; lowballing is unlikely to land.
Risks & watch-outs
- Climate carrying-cost: severe wind risk, 99% chance of damaging wind over 30y; extreme-heat days projected 7→24/yr by 2055 (HVAC capex compounding) — expect insurance premiums to compound above CPI over the hold.
Questions for the listing agent
- Built in 1962 — when were the roof, HVAC, electrical panel, plumbing, and water heater last replaced?
- Is there a deadline driving the sale (1031 exchange, divorce, estate, relocation)? That informs how much negotiation room exists.
- Schools are D-rated, which usually means shorter tenancies and higher turnover. Who's the typical renter profile here, and what's been the actual vacancy rate?
- Crime grade is F in this area — have there been break-ins, vandalism, or insurance claims at this property in the last 3 years? What carrier currently insures it and at what premium?
- What's the average days-on-market for RENTAL listings here right now (not sales)? A rising rental-DOM trend means longer vacancies and softer asking-rent achievability than the comps imply.
- What's the recent tenant-quality profile in this submarket — average credit score on applications, eviction rate, late-payment / NSF rate, and stable-employment percentage? A property-management company in the area should have these aggregated.
- How much new for-sale + rental construction is in the pipeline within 1–3 miles? Heavy new supply typically softens prices + rents 12–24 months out; constrained supply supports both.
Investment metrics
- 1% rule
- 1.54% ✓
- Cap rate
- 12.85%
- Cash-on-cash
- 23.43%
- DSCR
- 2.04
- GRM
- 5.4
CMA / ARV
- ARV (on-the-fly)
- $174,628
- Comps found
- 2
Show comp detail 2 sales within ~0.75 mi
| Address | Dist | Beds/Ba | Sqft | Sold | Price | $/sf | Match |
|---|---|---|---|---|---|---|---|
| 1045 Miller St | 0.46mi | 3/2.5 | 1,340 (+14%) | 8mo | $199,900 | $149 | 42 |
| 1075 Miller St | 0.46mi | 3/2.5 | 1,340 (+14%) | 9mo | $195,000 | $146 | 42 |
Match score weights: distance 35% · size 25% · config 20% · recency 20%. Top-matched comps best support the ARV.
Projected returns pro-forma
5.43% appreciation · 3.0% rent growth · sell at horizon
- IRR
- 34.1%
- Equity multiple
- 3.16×
- Total profit
- $45,290
- Equity at exit
- $44,498
- IRR
- 32.1%
- Equity multiple
- 6.41×
- Total profit
- $113,526
- Equity at exit
- $78,502
Cash invested: $21,000 (down + closing). Projections, not guarantees.
Landlord ↔ Tenant lean methodology
- Overall (STATE)
- 87 Strongly Landlord-Friendly
- State Texas
- 87 Strongly Landlord-Friendly · R+5
- County
- — inherits STATE
- City
- — inherits STATE
ZIP-level market 77703
- Home prices YoY
- 3.7%
- Active inventory
- 79
- Price-to-rent
- 5.4×
Monthly cashflow live
- Estimated rent
- $1,154 high interval (Pro) →
- Mortgage (P&I)
- −$393
- Tax from tax record
- −$77 /mo · $925/yr
- Insurance
- −$31
- HOA
- −$0
- Vacancy / Maint / Mgmt
- −$242
- Net cashflow
- $410
Break-even live
UW: 25.0% down · 7.5% · 30yr · 1.5% tax · 5.0% vac · 8.0% maint · 8.0% mgmt
Financing live
Cash to close
- Down payment
- $18,750
- Closing costs
- $2,250
- Reserves months
- —
- Total cash needed
- —
Loan-product check · same deal, 3 products live
Conventional
25% down · 7.5% · 30yr
- Down + closing
- —
- Monthly P&I
- —
- Monthly cashflow
- —
- DSCR
- —
- Eligible?
- —
Personal DTI + credit; lowest rate.
DSCR
20% down · 8.5% · 30yr
- Down + closing
- —
- Monthly P&I
- —
- Monthly cashflow
- —
- DSCR
- —
- Eligible?
- —
No personal income docs; deal must DSCR.
Hard money
10% down · 12.0% · 12mo
- Down + closing
- —
- Monthly P&I
- —
- Monthly cashflow
- —
- DSCR
- —
- Eligible?
- —
Short-term bridge; refi at stabilization.
Rent comps 16 comps
| Address | Beds | Baths | Sqft | Rent | $/sqft | DOM | Units | Dist |
|---|---|---|---|---|---|---|---|---|
| 2020 Cottonwood St Beaumont, TX | 2.0–4.0 | 1.0 | 928 | $1,238 | $1.33 | 14d | 9 | 0.79mi |
| 2023 Delaware St Beaumont, TX | 3.0 | 1.0 | 1180 | $1,300 | $1.10 | 44d | 1 | 0.95mi |
| 2260 Ashley St Beaumont, TX | 3.0 | 2.0 | 1471 | $1,595 | $1.08 | 14d | 1 | 0.96mi |
| 2290 Long Ave Unit 05 Beaumont, TX | 2.0 | 1.0 | 1055 | $950 | $0.90 | 23d | 1 | 1.01mi |
| 705 N 5th St Beaumont, TX | 2.0 | 1.0 | 900 | $800 | $0.89 | 14d | 1 | 1.01mi |
| 2248 Hazel St Beaumont, TX | 2.0 | 1.5 | 950 | $795 | $0.84 | 44d | 1 | 1.04mi |
| 880 N 7th St Unit 10 Beaumont, TX | 2.0 | 1.0 | 880 | $875 | $0.99 | 44d | 1 | 1.06mi |
| 2275 Harrison Ave Unit 15 Beaumont, TX | 2.0 | 1.0 | 880 | $875 | $0.99 | 44d | 1 | 1.06mi |
| 2275 Harrison Ave Unit 14 Beaumont, TX | 2.0 | 1.0 | 880 | $875 | $0.99 | 23d | 1 | 1.06mi |
| 2125 Earl St Beaumont, TX | 2.0 | 1.0 | 785 | $995 | $1.27 | 44d | 1 | 1.22mi |
| 2125 Earl St Beaumont, TX | 2.0 | 1.0 | 785 | $900 | $1.15 | 23d | 1 | 1.22mi |
| 2570 Sweetgum Ln Beaumont, TX | 1.0–2.0 | 1.0–1.5 | 876 | $1,599 | $1.82 | 14d | 15 | 1.28mi |
| 2329 Broadway Unit 2290-06 Beaumont, TX | 2.0 | 1.0 | 990 | $999 | $1.01 | 14d | 1 | 1.34mi |
| 2329 Broadway Unit 2337-02 Beaumont, TX | 2.0 | 1.0 | 990 | $999 | $1.01 | 23d | 1 | 1.34mi |
| 2640 Harrison Ave Beaumont, TX | 3.0 | 1.0 | 1158 | $1,295 | $1.12 | 23d | 1 | 1.47mi |
| 2575 Primrose St Unit 3 Beaumont, TX | 2.0 | 1.0 | 800 | $900 | $1.12 | 23d | 1 | 1.48mi |
Listing history 7 events
-
2026-06-07status $75,000 Pending 5 DOM
-
2026-06-03days on market $75,000 Active 5 DOM
-
2026-06-02days on market $75,000 Active 4 DOM
-
2026-06-01days on market $75,000 Active 3 DOM
-
2026-05-31days on market $75,000 Active 2 DOM
-
2026-05-29$75,000 Active
-
2011-10-27soldstatus
ⓘ Source: listings_history table (triggers on properties + properties_extension) + one-shot
backfill from property_details.listing_events for pre-trigger history.
Tax reassessment forecast TX · Resets to sale price
- Current annual tax
- $925 · $77/mo
- Projected year-2 tax
- $1,372 · $114/mo
- Expected delta
- +$448/yr (+$37/mo · 48.4%)
ⓘ Screening estimate from a state-policy table — verify with the county assessor before closing.
Climate risk First Street
- Flood 1/10 Low FEMA zone X · 0% chance over 30 yrs
- Wildfire 1/10 Low
- Heat 9/10 Extreme 7 d/yr ≥109°F today · 24 d/yr by 30 yrs out
- Wind 9/10 Extreme 99% chance of damaging wind over 30 yrs
- Air quality 2/10 Low 1 unhealthy d/yr today · 1 by 30 yrs out
Nearby sold comps map
Loading sold comps map…
Walkable amenities ~0.75 mi
Loading nearby amenities…
Taxation est. · year 1
- Rental income
- $13,849
- − Mortgage interest
- −$4,201
- − Property taxes
- −$925
- − Insurance
- −$375
- − Repairs & maintenance
- −$1,108
- − Management
- −$1,108
- − Depreciation
- −$2,182
- Taxable income
- $3,950
- Est. tax owed @ 24.0%
- −$948
- After-tax cash flow
- $3,973/yr
For passive investors: Depreciation is non-cash, so a rental often shows a tax loss while cash-flowing — sheltering income. Rental losses are passive: they offset passive income freely, and up to $25,000/yr can offset ordinary (W-2) income if you actively participate and your MAGI is under $100k (phasing out to $0 by $150k); unused losses carry forward. On sale, claimed depreciation is recaptured at up to 25%, and gains may owe capital-gains tax (a 1031 exchange can defer both). Figures are a year-1 estimate at your 24.0% rate — not tax advice; consult a CPA.
Schools (NCES district)
- District
- Beaumont ISD
- NCES district ID
- 4809670
- Math proficiency
- 14% ▼ -13.00%
- Reading proficiency
- 22% ▼ -7.00%
- Median HH income
- $41,683
- Composite
- 15.43/100
- National rank
- #9316
- State rank
- #789 of 826 in TX
Livability — Beaumont
- Score
- 64/100
- State rank
- #739
- US rank
- #13710
Category grades
Schools grade is shown separately in the Schools card above.
Census & demographics
- Census place
- Beaumont, TX
- County
- Jefferson County · 203,592 people
- City population
- 125,901
- Metro
- Beaumont-Port Arthur, TX
- Population (ZIP)
- 11,004
- Household income
- $31,803
- Rent vs Own
- Severe rent burden
- 657.0
Population outlook (Jefferson County) Hauer SSP2
- Today (2025)
- 259,015 people
- By 2030
- 260,685 · +0.6%
- By 2040
- 263,309 · +1.7%
- By 2050
- 265,237 · +2.4%
- By 2075
- 270,193 · +4.3%
- By 2100
- 255,628 · -1.3%
Race, ethnicity, and origin ACS 2023
- Neighborhood character
- Majority Black (60%)
- Race & ethnicity
- Black 60% Hispanic / Latino 31% Two or more races 7% White 5%
- Hispanic origin (detail)
- Mexican 25%
- Common ancestry
- Serbian 1%
- Foreign-born
- 13% · Canada
- Languages at home
- 70% English-only · Spanish 29% French/Haitian/Cajun 1%
Political lean MEDSL · Jefferson
- 2024 margin
- Lean R (+8.9) · D 45.1% · R 54.0%
- 2008→2024 swing
- -11.1pp toward R · 2008: 2.2pp · 2024: -8.9pp
- All cycles
- 2024: R+8.9 2020: R+1.6 2016: R+0.5 2012: D+1.6 2008: D+2.2
Not yet ingested
- Civics
- —
Market trends
- HPI YoY
- ▲ 5.43%
- Current HPI
- 151.9888
- Rent YoY
- —
- Metro
- Beaumont-Port Arthur, TX
- State GDP YoY
- ▲ 3.95%
- F500 in state
- 110
Industry mix (Fortune 500 HQ in TX)
| Industry | F500 HQs | Revenue |
|---|---|---|
| Energy | 16 | $1,198B |
|
||
| Technology | 5 | $198B |
|
||
| Engineering / Construction | 4 | $72B |
|
||
| Energy Services | 3 | $60B |
|
||
| Utilities | 3 | $41B |
|
||
| Healthcare | 2 | $330B |
|
||
Price history
2 events — show timeline
- 2026-05-29 Listed $75,000 BBOR
- 2011-10-27 Sold (Public Records) — Public Records
Property tax history
+2.7%/yrLatest (2025): $925 · +9.1% YoY. Source: county tax records.
Cash-flow waterfall
monthlySold comps — $/sqft
last 12 mo · ≤1 miLoading sold comps…