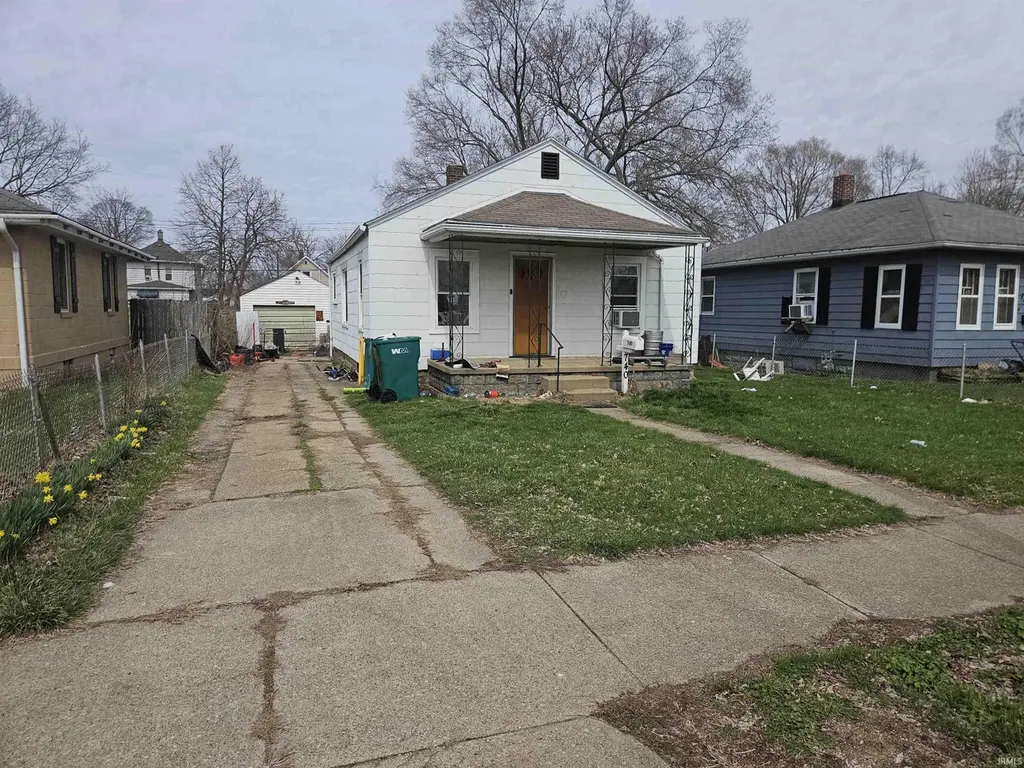
740 E 6th St · Mishawaka, IN
Flood risk 7/10 · Major
- FEMA flood zone
- X (unshaded)
- Chance of flooding over 30 yrs
- 0.76%
- Est. flood insurance / yr
- $473 – $860
Fire risk 1/10 · Minimal
- Est. fire insurance / yr
- $717 – $1,331
Heat risk 2/10 · Minimal
- Hot days now (above 100°F)
- 7 days/yr
- Hot days in 30 yrs
- 16 days/yr
Wind risk 2/10 · Minimal
- Chance of severe wind over 30 yrs
- —
Air-quality risk 3/10 · Minor
- Unhealthy air days now
- 2 days/yr
- Unhealthy air days in 30 yrs
- 3 days/yr
Risk factors via First Street. Map © Google.
Why this score? — see what drove the B+ grade
The composite is a weighted blend of 9 inputs, each scored 0–100. Each bar is that input's sub-score; the figure is the points it added to the 100-point composite (weight × sub-score).
- Cash flow +30.0/30.0
- ARV discount +15.0/15.0
- DSCR +10.0/10.0
- 1% rule +8.6/10.0
- Rent growth +4.8/5.0
- Livability +3.8/5.0
- Condition / age +2.5/5.0
- Schools +2.2/10.0
- Appreciation +0.0/10.0
$89,900
🖨 Deal sheet 📄 Offer letter ✓ Due diligence
Listing remarks MLS
MLS input for comparables only - pending at time of listing
Key facts
- 6,525 sq ft lot
- Garage
- Built 1922
Neighborhood map
What this means for you Summary
Snapshot
- This is a 2-bed/1.0-bath single-family listed at $90k.
Deal economics
- At list price, monthly cash flow is $333 ($4k/yr) — positive.
- The deal already cash-flows at list — no discount required.
- Meets the 1% rule at list price ($1k rent vs $90k).
- Cap rate 11.5% vs local median 5.3% in Mishawaka — top-decile yield for the area; either an underpriced asset or a hidden risk that comps aren't pricing in. Stress-test before assuming the spread holds.
Location & tenants
- Location reads 76/100 on livability (#53 in IN, #3,586 nationally) — a middle-class / working-renter tenant base. Strengths: cost of living A+, housing A+, health & safety B; Watch: amenities F, employment F.
- School City Of Mishawaka (urban): math 23% / reading 30% proficiency, ranked #260 of 301 in IN (top 86%) — low school quality limits family demand, transient renter base, plan for 1-2y turnover.
- Zoned schools: Emmons Elementary School (math 14% / reading 14%, grade F, #874 of 994 statewide, top 89%, 435 students, 87% FRL); John J Young Middle School (math 17% / reading 30%, grade F, #257 of 330 statewide, top 79%, 735 students, 74% FRL); Mishawaka High School (math 24% / reading 60%, grade F, #197 of 369 statewide, top 57%, 1,488 students, 65% FRL) — zoned schools average 75% FRL vs 54% district-wide (21 pts higher); higher-poverty schools than district average — tighter screening recommended.
- Market conditions: Rents rising fast (+9.1%/yr); 140 active listings in the ZIP; 12 comparable units currently listed for rent nearby; rentals leasing fast (median 13d on market — plan ~1-2 weeks tenant-placement turnaround); 754 units permitted in St. Joseph County in 2024 (460 in 5+ unit buildings).
Forward outlook
- Local home prices are declining (-3.0%/yr); year-one equity from $622 of loan paydown is wiped out by about $3k of value loss. Plan a longer hold.
- At projected returns (-3.0% appreciation + 8.0% rent growth), your $25k cash investment doubles in ~6 years — after that, you're playing with house money.
Negotiation context
- Only 7 days on market — expect competitive offers; lowballing is unlikely to land.
- 2 sale attempts since 4y ago with the ask held roughly flat each time — persistent listings suggest the price (not the market) is what's stuck; bring a comps-based counter.
- Current owner paid $45k; list at $90k implies a 100% gain — meaningful room to come down on a strong offer.
Risks & watch-outs
- Watch-outs: flood insurance adds $56/mo; built in 1922 — expect roof / HVAC / electrical / plumbing capex.
- Climate carrying-cost: major flood risk — expect insurance premiums to compound above CPI over the hold.
Questions for the listing agent
- Built in 1922 — when were the roof, HVAC, electrical panel, plumbing, and water heater last replaced?
- What's the actual annual flood-insurance premium (NFIP or private), and is the property in a SFHA with mandatory coverage?
- Is there a deadline driving the sale (1031 exchange, divorce, estate, relocation)? That informs how much negotiation room exists.
- What's the average days-on-market for RENTAL listings here right now (not sales)? A rising rental-DOM trend means longer vacancies and softer asking-rent achievability than the comps imply.
- What's the recent tenant-quality profile in this submarket — average credit score on applications, eviction rate, late-payment / NSF rate, and stable-employment percentage? A property-management company in the area should have these aggregated.
- How much new for-sale + rental construction is in the pipeline within 1–3 miles? Heavy new supply typically softens prices + rents 12–24 months out; constrained supply supports both.
Investment metrics
- 1% rule
- 1.36% ✓
- Cap rate
- 11.48%
- Cash-on-cash
- 18.52%
- DSCR
- 1.82
- GRM
- 6.1
CMA / ARV
- ARV (on-the-fly)
- $140,544
- Comps found
- 12
Show comp detail 12 sales within ~0.75 mi
| Address | Dist | Beds/Ba | Sqft | Sold | Price | $/sf | Match |
|---|---|---|---|---|---|---|---|
| 740 E 6th St | 0.00mi | 2/1.0 | 768 (0%) | 1mo | $77,027 | $100 | 99 |
| 737 E 4th St | 0.12mi | 2/1.0 | 720 (-6%) | 19mo | $72,000 | $100 | 68 |
| 1118 E 4th St | 0.43mi | 2/1.0 | 780 (+2%) | 18mo | $87,630 | $112 | 62 |
| 118 W 12th St | 0.70mi | 2/1.0 | 748 (-3%) | 2mo | $199,900 | $267 | 61 |
| 909 E Lawrence St | 0.73mi | 2/1.0 | 770 (+0%) | 7mo | $125,000 | $162 | 60 |
| 116 W 10th St | 0.65mi | 2/1.0 | 836 (+9%) | 3mo | $171,000 | $205 | 53 |
| 411 N Wenger Ave | 0.63mi | 2/1.0 | 804 (+5%) | 12mo | $160,000 | $199 | 53 |
| 405 Gernhart Ave | 0.73mi | 2/1.0 | 768 (0%) | 17mo | $172,000 | $224 | 52 |
| 1005 E 4th St | 0.31mi | 2/1.0 | 880 (+15%) | 12mo | $161,000 | $183 | 52 |
| 218 E 12th St | 0.60mi | 2/1.0 | 828 (+8%) | 10mo | $135,000 | $163 | 51 |
| 213 N State St | 0.70mi | 2/1.0 | 792 (+3%) | 15mo | $169,000 | $213 | 49 |
| 314 E 16th St | 0.74mi | 2/1.0 | 840 (+9%) | 5mo | $146,390 | $174 | 46 |
Match score weights: distance 35% · size 25% · config 20% · recency 20%. Top-matched comps best support the ARV.
Projected returns pro-forma
-3.0% appreciation · 8.0% rent growth · sell at horizon
- IRR
- 12.4%
- Equity multiple
- 1.52×
- Total profit
- $13,126
- Equity at exit
- $13,404
- IRR
- 25.0%
- Equity multiple
- 3.71×
- Total profit
- $68,244
- Equity at exit
- $7,773
Cash invested: $25,172 (down + closing). Projections, not guarantees.
Landlord ↔ Tenant lean methodology
- Overall (STATE)
- 90 Strongly Landlord-Friendly
- State Indiana
- 90 Strongly Landlord-Friendly · R+11
- County
- — inherits STATE
- City
- — inherits STATE
ZIP-level market 46544
- Rents YoY
- 9.1%
- Active inventory
- 140
- Price-to-rent
- 6.1×
Monthly cashflow live
- Estimated rent
- $1,222 high interval (Pro) →
- Mortgage (P&I)
- −$471
- Tax from tax record
- −$68 /mo · $819/yr
- Insurance
- −$37
- Flood insurance flood zone
- −$56 /mo · $666/yr
- HOA
- −$0
- Vacancy / Maint / Mgmt
- −$257
- Net cashflow
- $333
Break-even live
UW: 25.0% down · 7.5% · 30yr · 1.5% tax · 5.0% vac · 8.0% maint · 8.0% mgmt
Financing live
Cash to close
- Down payment
- $22,475
- Closing costs
- $2,697
- Reserves months
- —
- Total cash needed
- —
Loan-product check · same deal, 3 products live
Conventional
25% down · 7.5% · 30yr
- Down + closing
- —
- Monthly P&I
- —
- Monthly cashflow
- —
- DSCR
- —
- Eligible?
- —
Personal DTI + credit; lowest rate.
DSCR
20% down · 8.5% · 30yr
- Down + closing
- —
- Monthly P&I
- —
- Monthly cashflow
- —
- DSCR
- —
- Eligible?
- —
No personal income docs; deal must DSCR.
Hard money
10% down · 12.0% · 12mo
- Down + closing
- —
- Monthly P&I
- —
- Monthly cashflow
- —
- DSCR
- —
- Eligible?
- —
Short-term bridge; refi at stabilization.
Rent comps 12 comps
| Address | Beds | Baths | Sqft | Rent | $/sqft | DOM | Units | Dist |
|---|---|---|---|---|---|---|---|---|
| 703 E 12th St Unit D Mishawaka, IN | 2.0 | 1.0 | 850 | $1,395 | $1.64 | 13d | 1 | 0.42mi |
| 703 E 12th St Unit A Mishawaka, IN | 2.0 | 1.0 | 900 | $1,295 | $1.44 | 43d | 1 | 0.42mi |
| 722 S Spring St Apt 3 Mishawaka, IN | 2.0 | 1.0 | 800 | $1,200 | $1.50 | 13d | 1 | 0.70mi |
| 365 W Front St Mishawaka, IN | 2.0 | 1.0–2.0 | 825 | $3,050 | $3.70 | 13d | 1 | 0.84mi |
| 602 E Battell St Mishawaka, IN | 1.0 | 1.0 | 980 | $1,400 | $1.43 | 20d | 1 | 0.87mi |
| 516 W 3rd St Apt 1 Mishawaka, IN | 1.0 | 1.0 | 750 | $800 | $1.07 | 20d | 1 | 0.89mi |
| 516 W 3rd St #6 Mishawaka, IN | 2.0 | 1.0 | 700 | $800 | $1.14 | 13d | 1 | 0.89mi |
| 116 W Mishawaka Ave Mishawaka, IN | 3.0 | 1.0–2.0 | 948 | $1,914 | $2.02 | 13d | 31 | 0.93mi |
| 724 Elizabeth St Mishawaka, IN | 1.0 | 1.0 | 850 | $875 | $1.03 | 13d | 1 | 1.00mi |
| 1434 Fallcreek Dr Mishawaka, IN | 2.0–3.0 | 1.0–2.0 | 1176 | $1,029 | $0.88 | 13d | 1 | 1.13mi |
| 1202 W 7th St Unit B Mishawaka, IN | 2.0 | 1.0 | 600 | $1,100 | $1.83 | 13d | 1 | 1.30mi |
| 3530 Northside Blvd South Bend, IN | 1.0–2.0 | 1.0 | 850 | $1,200 | $1.41 | 13d | 1 | 1.46mi |
Listing history 4 events
-
2026-04-03status Pending
-
2026-03-27$89,900 Active
-
2022-03-16soldstatus $45,000 59-char remark
Show marketing remark (59 chars)
MLS input for comparables only - pending at time of listing
-
2022-02-18$45,000 59-char remark
Show marketing remark (59 chars)
MLS input for comparables only - pending at time of listing
ⓘ Source: listings_history table (triggers on properties + properties_extension) + one-shot
backfill from property_details.listing_events for pre-trigger history.
Tax reassessment forecast IN · Partial reset (capped growth)
- Current annual tax
- $819 · $68/mo
- Projected year-2 tax
- $819 · $68/mo
- Expected delta
- $0/yr ($0/mo · 0.0%)
ⓘ Screening estimate from a state-policy table — verify with the county assessor before closing.
Climate risk First Street
- Flood 7/10 Severe FEMA zone X (unshaded) · 76% chance over 30 yrs
- Wildfire 1/10 Low
- Heat 2/10 Low 7 d/yr ≥100°F today · 16 d/yr by 30 yrs out
- Wind 2/10 Low
- Air quality 3/10 Moderate 2 unhealthy d/yr today · 3 by 30 yrs out
Nearby sold comps map
Loading sold comps map…
Walkable amenities ~0.75 mi
Loading nearby amenities…
Taxation est. · year 1
- Rental income
- $14,669
- − Mortgage interest
- −$5,036
- − Property taxes
- −$819
- − Insurance
- −$1,116
- − Repairs & maintenance
- −$1,174
- − Management
- −$1,174
- − Depreciation
- −$2,615
- Taxable income
- $2,736
- Est. tax owed @ 24.0%
- −$657
- After-tax cash flow
- $3,339/yr
For passive investors: Depreciation is non-cash, so a rental often shows a tax loss while cash-flowing — sheltering income. Rental losses are passive: they offset passive income freely, and up to $25,000/yr can offset ordinary (W-2) income if you actively participate and your MAGI is under $100k (phasing out to $0 by $150k); unused losses carry forward. On sale, claimed depreciation is recaptured at up to 25%, and gains may owe capital-gains tax (a 1031 exchange can defer both). Figures are a year-1 estimate at your 24.0% rate — not tax advice; consult a CPA.
Schools (NCES district)
- District
- School City Of Mishawaka
- NCES district ID
- 1806840
- Math proficiency
- 23% ▼ -9.00%
- Reading proficiency
- 30% ▼ -7.00%
- Median HH income
- $39,290
- Composite
- 22.26/100
- National rank
- #8143
- State rank
- #260 of 301 in IN
Livability — Mishawaka
- Score
- 76/100
- State rank
- #53
- US rank
- #3586
Category grades
Schools grade is shown separately in the Schools card above.
Census & demographics
- Census place
- Mishawaka, IN
- County
- Saint Joseph County · 189,048 people
- City population
- 57,683
- Metro
- South Bend-Mishawaka, IN-MI
- Population (ZIP)
- 31,077
- Household income
- $58,829
- Rent vs Own
- Severe rent burden
- 685.0
Population outlook (St. Joseph County) Hauer SSP2
- Today (2025)
- 273,186 people
- By 2030
- 273,594 · +0.1%
- By 2040
- 271,641 · -0.6%
- By 2050
- 269,187 · -1.5%
- By 2075
- 263,136 · -3.7%
- By 2100
- 245,659 · -10.1%
Race, ethnicity, and origin ACS 2023
- Neighborhood character
- Predominantly White (79%)
- Race & ethnicity
- White 79% Black 9% Two or more races 7% Hispanic / Latino 6% Asian 1%
- Hispanic origin (detail)
- Mexican 5%
- Common ancestry
- Romanian 7% English 3% Lithuanian 2%
- Foreign-born
- 4% · Canada, Vietnam
- Languages at home
- 94% English-only · Spanish 3%
Political lean MEDSL · St. Joseph
- 2024 margin
- Toss-up / Even · D 50.0% · R 48.5% · Other 1.5%
- 2008→2024 swing
- -15.6pp toward R · 2008: 17.1pp · 2024: 1.5pp
- All cycles
- 2024: D+1.5 2020: D+5.8 2016: D+0.2 2012: D+3.5 2008: D+17.1
Not yet ingested
- Civics
- —
Market trends
- HPI YoY
- ▼ -116.74%
- Current HPI
- 188.9996
- Rent YoY
- ▲ 9.10%
- Metro
- South Bend-Mishawaka, IN-MI
- State GDP YoY
- ▲ 2.90%
- F500 in state
- 18
Industry mix (Fortune 500 HQ in IN)
| Industry | F500 HQs | Revenue |
|---|---|---|
| Industrial Machinery | 2 | $37B |
|
||
| Healthcare | 1 | $177B |
|
||
| Pharmaceuticals | 1 | $45B |
|
||
| Metals / Steel | 1 | $18B |
|
||
| Agriculture | 1 | $17B |
|
||
| Packaging | 1 | $12B |
|
||
Price history
+99.8% since first listed4 events — show timeline
- 2026-04-03 Pending — IRMLS
- 2026-03-27 Listed $89,900 IRMLS
- 2022-03-16 Sold (MLS) $45,000 IRMLS
- 2022-02-18 Listed $45,000 IRMLS
Property tax history
-7.9%/yrLatest (2023): $819 · -27.3% YoY. Source: county tax records.
Cash-flow waterfall
monthlySold comps — $/sqft
last 12 mo · ≤1 miLoading sold comps…