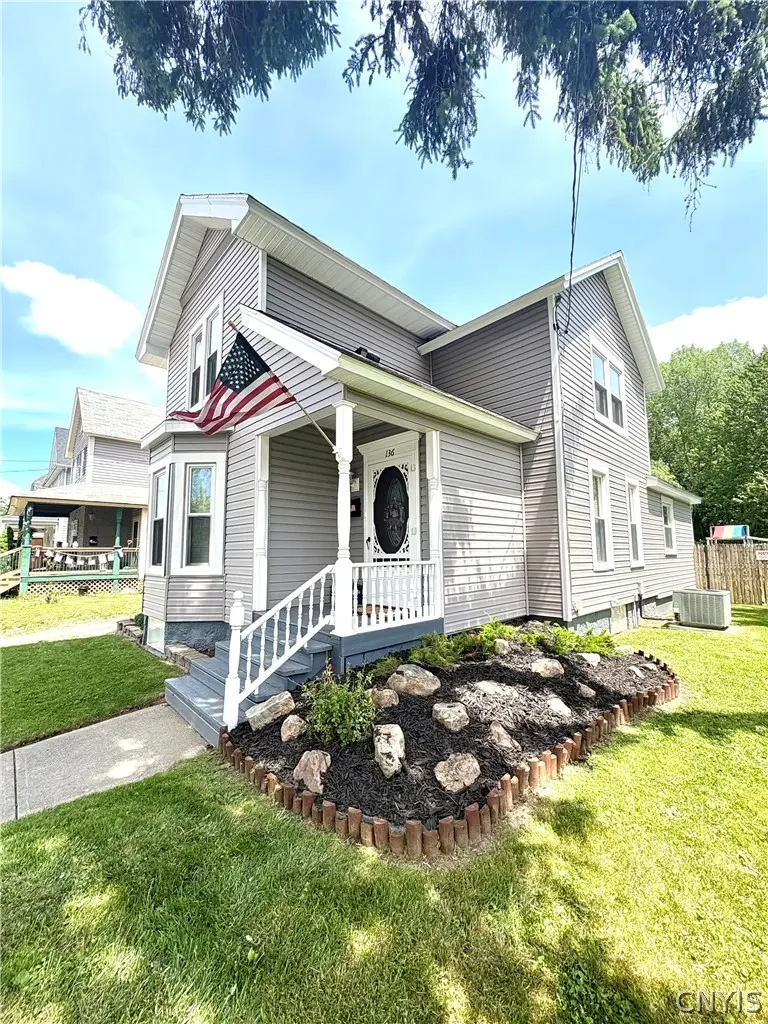
136 N Fulton St · Auburn, NY
Flood risk 1/10 · Minimal
- FEMA flood zone
- X (unshaded)
- Chance of flooding over 30 yrs
- 0.0%
- Est. flood insurance / yr
- $473 – $860
Fire risk 1/10 · Minimal
- Est. fire insurance / yr
- $691 – $1,283
Heat risk 2/10 · Minimal
- Hot days now (above 96°F)
- 7 days/yr
- Hot days in 30 yrs
- 15 days/yr
Wind risk 1/10 · Minimal
- Chance of severe wind over 30 yrs
- 1.0%
Air-quality risk 2/10 · Minimal
- Unhealthy air days now
- 0 days/yr
- Unhealthy air days in 30 yrs
- 1 days/yr
Risk factors via First Street. Map © Google.
Why this score? — see what drove the F grade
The composite is a weighted blend of 9 inputs, each scored 0–100. Each bar is that input's sub-score; the figure is the points it added to the 100-point composite (weight × sub-score).
- Cash flow +13.5/30.0
- DSCR +4.1/10.0
- Livability +3.7/5.0
- 1% rule +3.2/10.0
- Schools +3.0/10.0
- Rent growth +2.5/5.0
- Condition / age +2.5/5.0
- ARV discount +0.0/15.0
- Appreciation +0.0/10.0
$224,900
🖨 Deal sheet 📄 Offer letter ✓ Due diligence
Listing remarks
Welcome home to this spacious and meticulously maintained 4-bedroom, 2-bath residence offering comfort, functionality, and numerous recent improvements. The oversized kitchen provides an abundance of cabinet and counter space, making it the perfect gathering place for everyday living and entertaining. Convenience is key with a first-floor bedroom and first-floor laundry, offering flexible living options to suit a variety of lifestyles. Outside, enjoy summer days in the above-ground pool and take advantage of the generous outdoor space for recreation and relaxation. This home also offers central air. Major updates provide peace of mind, including a newer furnace, hot water heater, siding, an
Key facts
- Newer furnace
- Oversized kitchen
- First floor laundry
Tags
Property features AI
Exterior
- Parking: No garage
- Utilities: Public water connected; Sewer connected
- Home design: Two-story house; Existing construction; Rectangular residential lot; City street frontage
- Construction: Vinyl siding; Stone foundation
- Exterior features: Fully fenced yard; Above-ground pool; Patio (open); Porch; Shed(s)/storage; Gravel driveway; Full fencing
Interior
- Kitchen: Gas range; Gas oven; Microwave; Refrigerator
- Bedrooms: Two main-level bedrooms
- Flooring: Carpet; Laminate; Varied flooring
- Bathrooms: Two full bathrooms; One main-level bathroom
- Heating & cooling: Gas forced-air heating
- Interior features: Eat-in kitchen; Separate/formal living room; Bedroom on main level; Full basement
- Laundry & utility: Main-level laundry; Washer; Dryer; Gas water heater
Neighborhood map
What this means for you Summary
Snapshot
- This is a 3-bed/1.0-bath single-family listed at $225k.
Deal economics
- At list price, monthly cash flow is $8 ($95/yr) — positive.
- The deal already cash-flows at list — no discount required.
- To meet the 1% rule (rent ≥ 1% of price), the offer needs to be $184k (18.4% below list).
- Recommended offer: $184k (18.4% below list) — sets the bar for 1% rule.
Location & tenants
- Location reads 74/100 on livability (#298 in NY, #4,814 nationally) — a middle-class / working-renter tenant base. Strengths: cost of living A+, housing A+, health & safety A+; Watch: schools D, amenities D-, commute F.
- Auburn City School District (town): math 31% / reading 39% proficiency, ranked #558 of 590 in NY (top 95%) — families likely to look elsewhere, expect single-tenant / working-renter base with shorter leases.
- Market conditions: 221 active listings in the ZIP; 1 comparable units currently listed for rent nearby; 161 units permitted in Cayuga County in 2024 (65 in 5+ unit buildings).
- This rent runs 36% of the median local income ($61k/yr) — at the standard rent-burdened threshold; future hikes will face affordability resistance.
Forward outlook
- Local home prices are declining (-3.0%/yr); year-one equity from $2k of loan paydown is wiped out by about $7k of value loss. Plan a longer hold.
- Cayuga County population projected at -18% by 2050 — secular population decline; favor cash flow + early exit over multi-decade hold.
Negotiation context
- Only 10 days on market — expect competitive offers; lowballing is unlikely to land.
- 2 sale attempts with the ask held roughly flat each time — persistent listings suggest the price (not the market) is what's stuck; bring a comps-based counter.
- Current owner paid $69k; list at $225k implies a 225% gain — meaningful room to come down on a strong offer.
Risks & watch-outs
- Watch-outs: built in 1885 — expect roof / HVAC / electrical / plumbing capex.
Questions for the listing agent
- Built in 1885 — when were the roof, HVAC, electrical panel, plumbing, and water heater last replaced?
- Is there a deadline driving the sale (1031 exchange, divorce, estate, relocation)? That informs how much negotiation room exists.
- Schools are D-rated, which usually means shorter tenancies and higher turnover. Who's the typical renter profile here, and what's been the actual vacancy rate?
- The area grade is low — what's the realistic commute time and amenity access for the typical tenant pool here? Any planned neighborhood developments (good or bad) we should know about?
- What's the average days-on-market for RENTAL listings here right now (not sales)? A rising rental-DOM trend means longer vacancies and softer asking-rent achievability than the comps imply.
- What's the recent tenant-quality profile in this submarket — average credit score on applications, eviction rate, late-payment / NSF rate, and stable-employment percentage? A property-management company in the area should have these aggregated.
- How much new for-sale + rental construction is in the pipeline within 1–3 miles? Heavy new supply typically softens prices + rents 12–24 months out; constrained supply supports both.
Investment metrics
- 1% rule
- 0.82% ✗
- Cap rate
- 6.33%
- Cash-on-cash
- 0.15%
- DSCR
- 1.01
- GRM
- 10.2
CMA / ARV
- ARV (on-the-fly)
- $170,316
- Comps found
- 12
Show comp detail 12 sales within ~0.75 mi
| Address | Dist | Beds/Ba | Sqft | Sold | Price | $/sf | Match |
|---|---|---|---|---|---|---|---|
| 126 N Fulton St | 0.02mi | 3/1.5 | 1,568 (+5%) | 6mo | $162,500 | $104 | 83 |
| 78 Standart Ave | 0.18mi | 3/2.0 | 1,448 (-3%) | 1mo | $165,000 | $114 | 82 |
| 18 Paul St | 0.25mi | 3/1.5 | 1,516 (+2%) | 4mo | $65,000 | $43 | 80 |
| 34 Liberty St | 0.25mi | 4/1.5 (+1) | 1,464 (-2%) | 3mo | $135,000 | $92 | 76 |
| 69 Lansing St | 0.13mi | 4/1.5 (+1) | 1,608 (+8%) | 7mo | $204,000 | $127 | 68 |
| 44 Capitol St | 0.57mi | 2/1.0 (-1) | 1,500 (+0%) | 7mo | $79,900 | $53 | 62 |
| 42 Seminary St | 0.51mi | 2/1.0 (-1) | 1,396 (-7%) | 3mo | $63,000 | $45 | 58 |
| 17 North Park | 0.34mi | 3/1.5 | 1,308 (-12%) | 7mo | $195,000 | $149 | 55 |
| 124 Curtis Pl | 0.35mi | 3/1.5 | 1,295 (-13%) | 8mo | $165,000 | $127 | 53 |
| 23 Chase St | 0.66mi | 3/1.0 | 1,652 (+11%) | 2mo | $165,000 | $100 | 50 |
| 26 Chase St | 0.63mi | 3/2.0 | 1,372 (-8%) | 4mo | $170,000 | $124 | 49 |
| 445 N Seward Ave | 0.66mi | 3/1.0 | 1,288 (-14%) | 6mo | $185,000 | $144 | 41 |
Match score weights: distance 35% · size 25% · config 20% · recency 20%. Top-matched comps best support the ARV.
Projected returns pro-forma
-3.0% appreciation · 3.0% rent growth · sell at horizon
- IRR
- -16.1%
- Equity multiple
- 0.43×
- Total profit
- $-35,983
- Equity at exit
- $33,533
- IRR
- -7.8%
- Equity multiple
- 0.51×
- Total profit
- $-30,854
- Equity at exit
- $19,445
Cash invested: $62,972 (down + closing). Projections, not guarantees.
Landlord ↔ Tenant lean methodology
- Overall (STATE)
- 15 Strongly Tenant-Friendly
- State New York
- 15 Strongly Tenant-Friendly · D+10
- County
- — inherits STATE
- City
- — inherits STATE
ZIP-level market 13021
- Home prices YoY
- -22.4%
- Active inventory
- 221
- Price-to-rent
- 10.2×
Monthly cashflow live
- Estimated rent
- $1,835 medium interval (Pro) →
- Mortgage (P&I)
- −$1,179
- Tax from tax record
- −$169 /mo · $2,027/yr
- Insurance
- −$94
- HOA
- −$0
- Vacancy / Maint / Mgmt
- −$385
- Net cashflow
- $8
Break-even live
UW: 25.0% down · 7.5% · 30yr · 1.5% tax · 5.0% vac · 8.0% maint · 8.0% mgmt
Financing live
Cash to close
- Down payment
- $56,225
- Closing costs
- $6,747
- Reserves months
- —
- Total cash needed
- —
Loan-product check · same deal, 3 products live
Conventional
25% down · 7.5% · 30yr
- Down + closing
- —
- Monthly P&I
- —
- Monthly cashflow
- —
- DSCR
- —
- Eligible?
- —
Personal DTI + credit; lowest rate.
DSCR
20% down · 8.5% · 30yr
- Down + closing
- —
- Monthly P&I
- —
- Monthly cashflow
- —
- DSCR
- —
- Eligible?
- —
No personal income docs; deal must DSCR.
Hard money
10% down · 12.0% · 12mo
- Down + closing
- —
- Monthly P&I
- —
- Monthly cashflow
- —
- DSCR
- —
- Eligible?
- —
Short-term bridge; refi at stabilization.
Rent comps 1 comps
| Address | Beds | Baths | Sqft | Rent | $/sqft | DOM | Units | Dist |
|---|---|---|---|---|---|---|---|---|
| 5 Sheridan St Auburn, NY | 4.0 | 2.0 | 1788 | $1,995 | $1.12 | 43d | 1 | 0.79mi |
Listing history 8 events
-
2026-06-19days on market $224,900 Active 10 DOM
-
2026-06-18days on market $224,900 Active 9 DOM
-
2026-06-17days on market $224,900 Active 8 DOM
-
2026-06-16days on market $224,900 Active 7 DOM
-
2026-06-15days on market $224,900 Active 6 DOM
-
2026-06-14days on market $224,900 Active 4 DOM
-
2026-06-12remarks 699-char remark
-
2026-06-12$224,900 Active 3 DOM
ⓘ Source: listings_history table (triggers on properties + properties_extension) + one-shot
backfill from property_details.listing_events for pre-trigger history.
Tax reassessment forecast NY · Partial reset (capped growth)
- Current annual tax
- $2,027 · $169/mo
- Projected year-2 tax
- $2,914 · $243/mo
- Expected delta
- +$887/yr (+$74/mo · 43.8%)
ⓘ Screening estimate from a state-policy table — verify with the county assessor before closing.
Climate risk First Street
- Flood 1/10 Low FEMA zone X (unshaded) · 0% chance over 30 yrs
- Wildfire 1/10 Low
- Heat 2/10 Low 7 d/yr ≥96°F today · 15 d/yr by 30 yrs out
- Wind 1/10 Low 100% chance of damaging wind over 30 yrs
- Air quality 2/10 Low 0 unhealthy d/yr today · 1 by 30 yrs out
Nearby sold comps map
Loading sold comps map…
Walkable amenities ~0.75 mi
Loading nearby amenities…
Taxation est. · year 1
- Rental income
- $22,024
- − Mortgage interest
- −$12,598
- − Property taxes
- −$2,027
- − Insurance
- −$1,124
- − Repairs & maintenance
- −$1,762
- − Management
- −$1,762
- − Depreciation
- −$6,543
- Taxable loss
- −$3,792
- Est. tax savings @ 24.0%
- +$910
- After-tax cash flow
- $1,005/yr
For passive investors: Depreciation is non-cash, so a rental often shows a tax loss while cash-flowing — sheltering income. Rental losses are passive: they offset passive income freely, and up to $25,000/yr can offset ordinary (W-2) income if you actively participate and your MAGI is under $100k (phasing out to $0 by $150k); unused losses carry forward. On sale, claimed depreciation is recaptured at up to 25%, and gains may owe capital-gains tax (a 1031 exchange can defer both). Figures are a year-1 estimate at your 24.0% rate — not tax advice; consult a CPA.
Schools (NCES district)
- District
- Auburn City School District
- NCES district ID
- 3603480
- Math proficiency
- 31% ▼ -17.00%
- Reading proficiency
- 39% ▲ 2.00%
- Median HH income
- $43,567
- Composite
- 29.71/100
- National rank
- #6452
- State rank
- #558 of 590 in NY
Livability — Auburn
- Score
- 74/100
- State rank
- #298
- US rank
- #4814
Category grades
Schools grade is shown separately in the Schools card above.
Census & demographics
- Census place
- Auburn, NY
- County
- Cayuga County · 37,247 people
- City population
- 37,247
- Metro
- Auburn, NY
- Population (ZIP)
- 37,247
- Household income
- $60,712
- Rent vs Own
- Severe rent burden
- 1449.0
Population outlook (Cayuga County) Hauer SSP2
- Today (2025)
- 74,820 people
- By 2030
- 72,402 · -3.2%
- By 2040
- 66,917 · -10.6%
- By 2050
- 61,007 · -18.5%
- By 2075
- 48,047 · -35.8%
- By 2100
- 34,512 · -53.9%
Race, ethnicity, and origin ACS 2023
- Neighborhood character
- Predominantly White (87%)
- Race & ethnicity
- White 87% Two or more races 7% Black 3% Hispanic / Latino 3%
- Common ancestry
- Romanian 8% Subsaharan African 3% Lithuanian 2%
- Foreign-born
- 2% · Canada
- Languages at home
- 95% English-only · Spanish 2% Other Indo-European 1% German/W. Germanic 1%
Political lean MEDSL · Cayuga
- 2024 margin
- R (+13.0) · D 43.5% · R 56.5%
- 2008→2024 swing
- -21.5pp toward R · 2008: 8.5pp · 2024: -13.0pp
- All cycles
- 2024: R+13.0 2020: R+9.2 2016: R+13.2 2012: D+10.8 2008: D+8.5
Not yet ingested
- Civics
- —
Market trends
- HPI YoY
- ▼ -97.53%
- Current HPI
- 338.5537
- Rent YoY
- —
- Metro
- Auburn, NY
- State GDP YoY
- ▲ 2.60%
- F500 in state
- 92
Industry mix (Fortune 500 HQ in NY)
| Industry | F500 HQs | Revenue |
|---|---|---|
| Financial Services | 10 | $950B |
|
||
| Consumer Goods | 9 | $162B |
|
||
| Insurance | 4 | $225B |
|
||
| Telecommunications | 2 | $144B |
|
||
| Pharmaceuticals | 2 | $112B |
|
||
| Media / Entertainment | 2 | $69B |
|
||
Price history
+493.4% since first listed7 events — show timeline
- 2026-06-09 Listed $224,900 CNYIS
- 2025-04-02 Listing Removed — UNYREIS
- 2025-03-29 Listing Removed — UNYREIS
- 2025-03-29 Listing Removed — UNYREIS
- 2025-02-07 Listed $190,000 UNYREIS
- 2006-08-04 Sold (Public Records) $69,100 Public Records
- 1999-05-14 Sold (Public Records) $37,900 Public Records
Property tax history
-1.4%/yrLatest (2025): $2,027 · -1.8% YoY. Source: county tax records.
Cash-flow waterfall
monthlySold comps — $/sqft
last 12 mo · ≤1 miLoading sold comps…