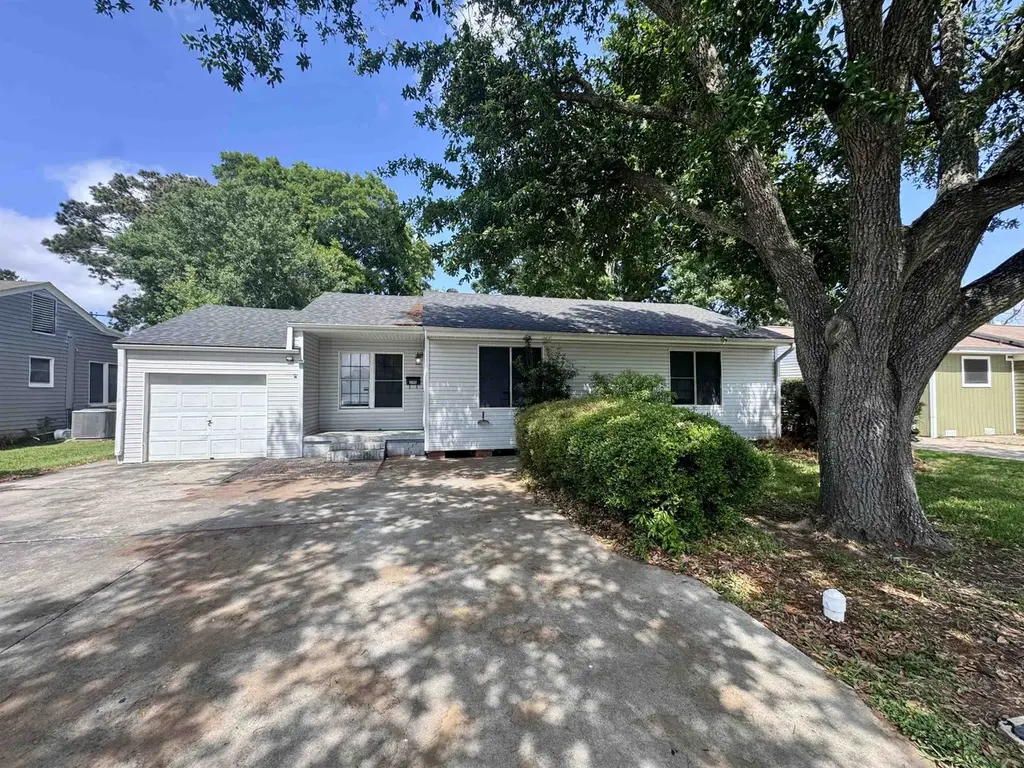
3110 Boyd Ave · Groves, TX
Flood risk 8/10 · Major
- FEMA flood zone
- X (shaded)
- Chance of flooding over 30 yrs
- 0.6%
- Est. flood insurance / yr
- $507 – $1,088
Fire risk 1/10 · Minimal
- Est. fire insurance / yr
- $1,222 – $2,270
Heat risk 9/10 · Severe
- Hot days now (above 110°F)
- 7 days/yr
- Hot days in 30 yrs
- 25 days/yr
Wind risk 9/10 · Severe
- Chance of severe wind over 30 yrs
- 99.0%
Air-quality risk 2/10 · Minimal
- Unhealthy air days now
- 1 days/yr
- Unhealthy air days in 30 yrs
- 1 days/yr
Risk factors via First Street. Map © Google.
Why this score? — see what drove the C- grade
The composite is a weighted blend of 9 inputs, each scored 0–100. Each bar is that input's sub-score; the figure is the points it added to the 100-point composite (weight × sub-score).
- Cash flow +16.8/30.0
- ARV discount +15.0/15.0
- 1% rule +5.6/10.0
- DSCR +5.2/10.0
- Livability +3.6/5.0
- Rent growth +2.5/5.0
- Condition / age +2.5/5.0
- Schools +1.5/10.0
- Appreciation +0.0/10.0
$145,000
🖨 Deal sheet 📄 Offer letter ✓ Due diligence
Listing remarks MLS
Welcome to 3110 Boyd in Groves, TX! This charming 3-bedroom, 1-bath home, 1 car garage homes offers over 1,535 square feet of comfortable living space with timeless character throughout. Step inside to find beautiful original wood floors that add warmth and charm to the home. The spacious layout provides plenty of room to relax or entertain, while the 1-car garage adds convenience and extra storage. Enjoy outdoor living with a covered patio overlooking the fenced backyard—perfect for gatherings, pets, or simply unwinding after a long day. This home blends classic features with everyday functionality in a great location!
Key facts
- Great location
- Original wood floors
- Covered patio
Tags
Property features AI
Finance
- Other: Seller disclosure available
- Financial info: Lease not considered
- HOA & community: HOA information not provided
Exterior
- Parking: Attached garage with 1 parking space
- Security: Security features not specified
- Utilities: Public water; Public sewer
- Home design: Residential property; Single-story living area not specified; Entry level not specified; Facing direction not specified
- Construction: Built in 1962; Block foundation; Composition roof
- Exterior features: Located in a subdivision
Interior
- Kitchen: Appliances not specified
- Bedrooms: Number of bedrooms not specified
- Flooring: Flooring details not specified
- Bathrooms: 1 full bathroom
- Heating & cooling: Central heating (gas); Central electric air conditioning
- Interior features: 3 total rooms
- Laundry & utility: Laundry features not specified
Neighborhood map
What this means for you Summary
Snapshot
- This is a 3-bed/1.0-bath single-family listed at $145k.
Deal economics
- At list price, monthly cash flow is $25 ($305/yr) — positive.
- The deal already cash-flows at list — no discount required.
- Meets the 1% rule at list price ($2k rent vs $145k).
- Recommended offer: $143k (1.5% below list) — sets the bar for market timing.
- Cap rate 7.1% vs local median 4.0% in Groves — top-decile yield for the area; either an underpriced asset or a hidden risk that comps aren't pricing in. Stress-test before assuming the spread holds.
Location & tenants
- Location reads 71/100 on livability (#315 in TX) — a middle-class / working-renter tenant base. Strengths: cost of living A+, housing A+, health & safety A; Watch: employment C-, amenities F, commute F.
- Port Arthur ISD (urban): math 15% / reading 22% proficiency, ranked #796 of 826 in TX (top 96%) — low school quality limits family demand, transient renter base, plan for 1-2y turnover; 80% free/reduced lunch — lower-income household profile, screen leases tightly.
- Zoned schools: Jefferson Middle (math 13% / reading 21%, grade F, #1,520 of 1,662 statewide, top 92%, 837 students, 91% FRL); Memorial H S (math 15% / reading 27%, grade F, #1,385 of 1,632 statewide, top 85%, 2,116 students, 77% FRL) — zoned schools at 84% FRL track the district average.
- Market conditions: 92 active listings in the ZIP; 5 comparable units currently listed for rent nearby; rentals leasing fast (median 14d on market — plan ~1-2 weeks tenant-placement turnaround); 40% of comp listings sitting > 30 days — soft ceiling on asking rent; 343 units permitted in Jefferson County in 2024 (0 in 5+ unit buildings).
Forward outlook
- Local home prices are declining (-3.0%/yr); year-one equity from $1k of loan paydown is wiped out by about $4k of value loss. Plan a longer hold.
Negotiation context
- It's been on market 16 days — a 2% lower offer ($143k) is reasonable based on typical stale-listing flexibility.
- 4 sale attempts since 4y ago with the ask held roughly flat each time — persistent listings suggest the price (not the market) is what's stuck; bring a comps-based counter.
Risks & watch-outs
- Watch-outs: property tax is 2.5% of price; flood insurance adds $66/mo.
- Climate carrying-cost: severe flood risk; severe wind risk, 99% chance of damaging wind over 30y; extreme-heat days projected 7→25/yr by 2055 (HVAC capex compounding) — expect insurance premiums to compound above CPI over the hold.
Questions for the listing agent
- Built in 1962 — when were the roof, HVAC, electrical panel, plumbing, and water heater last replaced?
- Property tax is high relative to price — has the assessment been appealed recently, and will the sale trigger a re-assessment?
- What's the actual annual flood-insurance premium (NFIP or private), and is the property in a SFHA with mandatory coverage?
- Is there a deadline driving the sale (1031 exchange, divorce, estate, relocation)? That informs how much negotiation room exists.
- What's the average days-on-market for RENTAL listings here right now (not sales)? A rising rental-DOM trend means longer vacancies and softer asking-rent achievability than the comps imply.
- What's the recent tenant-quality profile in this submarket — average credit score on applications, eviction rate, late-payment / NSF rate, and stable-employment percentage? A property-management company in the area should have these aggregated.
- How much new for-sale + rental construction is in the pipeline within 1–3 miles? Heavy new supply typically softens prices + rents 12–24 months out; constrained supply supports both.
Investment metrics
- 1% rule
- 1.06% ✓
- Cap rate
- 7.05%
- Cash-on-cash
- 2.72%
- DSCR
- 1.12
- GRM
- 7.8
CMA / ARV
- ARV (on-the-fly)
- $196,480
- Comps found
- 8
Show comp detail 8 sales within ~0.75 mi
| Address | Dist | Beds/Ba | Sqft | Sold | Price | $/sf | Match |
|---|---|---|---|---|---|---|---|
| 3231 Charles Ave | 0.19mi | 3/1.5 | 1,632 (+6%) | 8mo | $240,000 | $147 | 72 |
| 5116 Woodlawn Dr | 0.47mi | 3/2.0 | 1,566 (+2%) | 0mo | $199,900 | $128 | 70 |
| 3165 Charles Ave | 0.17mi | 3/2.0 | 1,584 (+3%) | 21mo | $190,000 | $120 | 66 |
| 6220 32nd St | 0.48mi | 4/2.0 (+1) | 1,606 (+5%) | 8mo | $254,000 | $158 | 54 |
| 3022 South Dr | 0.44mi | 3/2.0 | 1,583 (+3%) | 21mo | $49,900 | $32 | 53 |
| 2600 Berry Ave | 0.35mi | 3/2.0 | 1,431 (-7%) | 19mo | $154,900 | $108 | 52 |
| 2301 Owens Ave | 0.56mi | 3/1.0 | 1,310 (-15%) | 3mo | $199,999 | $153 | 47 |
| 3420 Grant Ave | 0.69mi | 3/2.0 | 1,685 (+10%) | 24mo | $169,900 | $101 | 28 |
Match score weights: distance 35% · size 25% · config 20% · recency 20%. Top-matched comps best support the ARV.
Projected returns pro-forma
-3.0% appreciation · 3.0% rent growth · sell at horizon
- IRR
- -15.0%
- Equity multiple
- 0.46×
- Total profit
- $-21,737
- Equity at exit
- $21,620
- IRR
- -6.2%
- Equity multiple
- 0.60×
- Total profit
- $-16,276
- Equity at exit
- $12,537
Cash invested: $40,600 (down + closing). Projections, not guarantees.
Landlord ↔ Tenant lean methodology
- Overall (STATE)
- 87 Strongly Landlord-Friendly
- State Texas
- 87 Strongly Landlord-Friendly · R+5
- County
- — inherits STATE
- City
- — inherits STATE
ZIP-level market 77619
- Active inventory
- 92
- Price-to-rent
- 7.8×
Monthly cashflow live
- Estimated rent
- $1,539 high interval (Pro) →
- Mortgage (P&I)
- −$760
- Tax from tax record
- −$303 /mo · $3,640/yr
- Insurance
- −$60
- Flood insurance flood zone
- −$66 /mo · $798/yr
- HOA
- −$0
- Vacancy / Maint / Mgmt
- −$323
- Net cashflow
- $25
Break-even live
UW: 25.0% down · 7.5% · 30yr · 1.5% tax · 5.0% vac · 8.0% maint · 8.0% mgmt
Financing live
Cash to close
- Down payment
- $36,250
- Closing costs
- $4,350
- Reserves months
- —
- Total cash needed
- —
Loan-product check · same deal, 3 products live
Conventional
25% down · 7.5% · 30yr
- Down + closing
- —
- Monthly P&I
- —
- Monthly cashflow
- —
- DSCR
- —
- Eligible?
- —
Personal DTI + credit; lowest rate.
DSCR
20% down · 8.5% · 30yr
- Down + closing
- —
- Monthly P&I
- —
- Monthly cashflow
- —
- DSCR
- —
- Eligible?
- —
No personal income docs; deal must DSCR.
Hard money
10% down · 12.0% · 12mo
- Down + closing
- —
- Monthly P&I
- —
- Monthly cashflow
- —
- DSCR
- —
- Eligible?
- —
Short-term bridge; refi at stabilization.
Rent comps 5 comps
| Address | Beds | Baths | Sqft | Rent | $/sqft | DOM | Units | Dist |
|---|---|---|---|---|---|---|---|---|
| 3141 Boyd Ave Groves, TX | 2.0 | 2.0 | 1200 | $1,375 | $1.15 | 43d | 1 | 0.06mi |
| 5989 32nd St Groves, TX | 2.0 | 1.0 | 1074 | $1,400 | $1.30 | 13d | 1 | 0.31mi |
| 5235 33rd St Unit 1 Groves, TX | 2.0 | 1.0 | 1400 | $1,400 | $1.00 | 13d | 1 | 0.44mi |
| 6110 Willis St Groves, TX | 2.0 | 1.0 | 1100 | $1,200 | $1.09 | 44d | 1 | 0.46mi |
| 5048 Kent Ave Groves, TX | 3.0 | 1.5 | 1351 | $1,650 | $1.22 | 13d | 1 | 1.41mi |
Listing history 13 events
-
2026-06-03days on market $145,000 Pending 16 DOM
-
2026-06-02days on market $145,000 Pending 15 DOM
-
2026-06-01days on market $145,000 Pending 14 DOM
-
2026-05-31days on market $145,000 Pending 13 DOM
-
2026-05-30days on market $145,000 Pending 12 DOM
-
2026-05-18$145,000 Active 633-char remark
-
2026-04-14$145,000 Active 633-char remark
Show marketing remark (633 chars)
Welcome to 3110 Boyd in Groves, TX! This charming 3-bedroom, 1-bath home, 1 car garage homes offers over 1,535 square feet of comfortable living space with timeless character throughout. Step inside to find beautiful original wood floors that add warmth and charm to the home. The spacious layout provides plenty of room to relax or entertain, while the 1-car garage adds convenience and extra storage. Enjoy outdoor living with a covered patio overlooking the fenced backyard—perfect for gatherings, pets, or simply unwinding after a long day. This home blends classic features with everyday functionality in a great location!
-
2022-04-11price $1,550
-
2022-03-16soldstatus
-
2022-03-15soldstatus
Show marketing remark (320 chars)
This three-bedroom home offers a lot of space with a living room to fit all your family and guests. Freshly painted, hardwood flooring, wood-burning fireplace are just some of the things you'll like. The back porch and fenced backyard are perfect for hanging outside. It's updated and cute, call today! No owner finance.
-
2022-02-08$99,900
-
2022-02-07$99,900
Show marketing remark (320 chars)
This three-bedroom home offers a lot of space with a living room to fit all your family and guests. Freshly painted, hardwood flooring, wood-burning fireplace are just some of the things you'll like. The back porch and fenced backyard are perfect for hanging outside. It's updated and cute, call today! No owner finance.
ⓘ Source: listings_history table (triggers on properties + properties_extension) + one-shot
backfill from property_details.listing_events for pre-trigger history.
Tax reassessment forecast TX · Resets to sale price
- Current annual tax
- $3,640 · $303/mo
- Projected year-2 tax
- $3,640 · $303/mo
- Expected delta
- $0/yr ($0/mo · 0.0%)
ⓘ Screening estimate from a state-policy table — verify with the county assessor before closing.
Climate risk First Street
- Flood 8/10 Severe FEMA zone X (shaded) · 60% chance over 30 yrs
- Wildfire 1/10 Low
- Heat 9/10 Extreme 7 d/yr ≥110°F today · 25 d/yr by 30 yrs out
- Wind 9/10 Extreme 99% chance of damaging wind over 30 yrs
- Air quality 2/10 Low 1 unhealthy d/yr today · 1 by 30 yrs out
Nearby sold comps map
Loading sold comps map…
Walkable amenities ~0.75 mi
Loading nearby amenities…
Taxation est. · year 1
- Rental income
- $18,472
- − Mortgage interest
- −$8,122
- − Property taxes
- −$3,640
- − Insurance
- −$1,522
- − Repairs & maintenance
- −$1,478
- − Management
- −$1,478
- − Depreciation
- −$4,218
- Taxable loss
- −$1,987
- Est. tax savings @ 24.0%
- +$477
- After-tax cash flow
- $782/yr
For passive investors: Depreciation is non-cash, so a rental often shows a tax loss while cash-flowing — sheltering income. Rental losses are passive: they offset passive income freely, and up to $25,000/yr can offset ordinary (W-2) income if you actively participate and your MAGI is under $100k (phasing out to $0 by $150k); unused losses carry forward. On sale, claimed depreciation is recaptured at up to 25%, and gains may owe capital-gains tax (a 1031 exchange can defer both). Figures are a year-1 estimate at your 24.0% rate — not tax advice; consult a CPA.
Schools (NCES district)
- District
- Port Arthur ISD
- NCES district ID
- 4835400
- Math proficiency
- 15% ▼ -22.00%
- Reading proficiency
- 22% ▼ -10.00%
- Median HH income
- $31,795
- Composite
- 14.9/100
- National rank
- #9373
- State rank
- #796 of 826 in TX
Livability — Groves
- Score
- 71/100
- State rank
- #315
- US rank
- #7031
Category grades
Schools grade is shown separately in the Schools card above.
Census & demographics
- Census place
- Groves, TX
- County
- Jefferson County · 203,592 people
- City population
- 16,976
- Metro
- Beaumont-Port Arthur, TX
- Population (ZIP)
- 16,976
- Household income
- $73,710
- Rent vs Own
- Severe rent burden
- 131.0
Population outlook (Jefferson County) Hauer SSP2
- Today (2025)
- 259,015 people
- By 2030
- 260,685 · +0.6%
- By 2040
- 263,309 · +1.7%
- By 2050
- 265,237 · +2.4%
- By 2075
- 270,193 · +4.3%
- By 2100
- 255,628 · -1.3%
Race, ethnicity, and origin ACS 2023
- Neighborhood character
- Diverse neighborhood (Simpson 0.62)
- Race & ethnicity
- White 53% Hispanic / Latino 30% Two or more races 18% Black 9% Asian 6%
- Hispanic origin (detail)
- Mexican 24% Dominican 2%
- Common ancestry
- Lithuanian 10% Serbian 1% Slovak 1%
- Foreign-born
- 16% · Canada, Vietnam, Jamaica
- Languages at home
- 72% English-only · Spanish 20% Vietnamese 5% Other Asian/Pacific 2%
Political lean MEDSL · Jefferson
- 2024 margin
- Lean R (+8.9) · D 45.1% · R 54.0%
- 2008→2024 swing
- -11.1pp toward R · 2008: 2.2pp · 2024: -8.9pp
- All cycles
- 2024: R+8.9 2020: R+1.6 2016: R+0.5 2012: D+1.6 2008: D+2.2
Not yet ingested
- Civics
- —
Market trends
- HPI YoY
- ▼ -235.42%
- Current HPI
- 183.1358
- Rent YoY
- —
- Metro
- Beaumont-Port Arthur, TX
- State GDP YoY
- ▲ 3.95%
- F500 in state
- 110
Industry mix (Fortune 500 HQ in TX)
| Industry | F500 HQs | Revenue |
|---|---|---|
| Energy | 16 | $1,198B |
|
||
| Technology | 5 | $198B |
|
||
| Engineering / Construction | 4 | $72B |
|
||
| Energy Services | 3 | $60B |
|
||
| Utilities | 3 | $41B |
|
||
| Healthcare | 2 | $330B |
|
||
Price history
+45.1% since first listed11 events — show timeline
- 2026-06-04 Pending — HARMLS
- 2026-05-28 Pending — HARMLS
- 2026-05-28 Pending — BBOR
- 2026-05-18 Listed $145,000 HARMLS
- 2026-04-14 Listed $145,000 BBOR
- 2022-04-11 Price Changed $1,550 RENT.
- 2022-03-16 Sold (Public Records) — Public Records
- 2022-03-15 Sold (MLS) — BBOR
- 2022-03-15 Sold (MLS) — PNPANBOR
- 2022-02-08 Listed $99,900 BBOR
- 2022-02-07 Listed $99,900 PNPANBOR
Property tax history
+7.0%/yrLatest (2025): $3,640 · -2.0% YoY. Source: county tax records.
Cash-flow waterfall
monthlySold comps — $/sqft
last 12 mo · ≤1 miLoading sold comps…