28 Pleasant Ave · East Haven, CT
Flood risk 1/10 · Minimal
- FEMA flood zone
- X (unshaded)
- Chance of flooding over 30 yrs
- 0.0%
- Est. flood insurance / yr
- $507 – $1,088
Fire risk 2/10 · Minimal
- Est. fire insurance / yr
- $829 – $1,539
Heat risk 6/10 · Moderate
- Hot days now (above 97°F)
- 7 days/yr
- Hot days in 30 yrs
- 16 days/yr
Wind risk 6/10 · Moderate
- Chance of severe wind over 30 yrs
- 61.0%
Air-quality risk 5/10 · Moderate
- Unhealthy air days now
- 6 days/yr
- Unhealthy air days in 30 yrs
- 8 days/yr
Risk factors via First Street. Map © Google.
Why this score? — see what drove the C grade
The composite is a weighted blend of 9 inputs, each scored 0–100. Each bar is that input's sub-score; the figure is the points it added to the 100-point composite (weight × sub-score).
- Cash flow +24.3/30.0
- DSCR +7.8/10.0
- ARV discount +7.5/15.0
- 1% rule +7.0/10.0
- Livability +3.5/5.0
- Schools +2.9/10.0
- Rent growth +2.7/5.0
- Condition / age +2.5/5.0
- Appreciation +0.0/10.0
$175,000
🖨 Deal sheet 📄 Offer letter ✓ Due diligence
Listing remarks
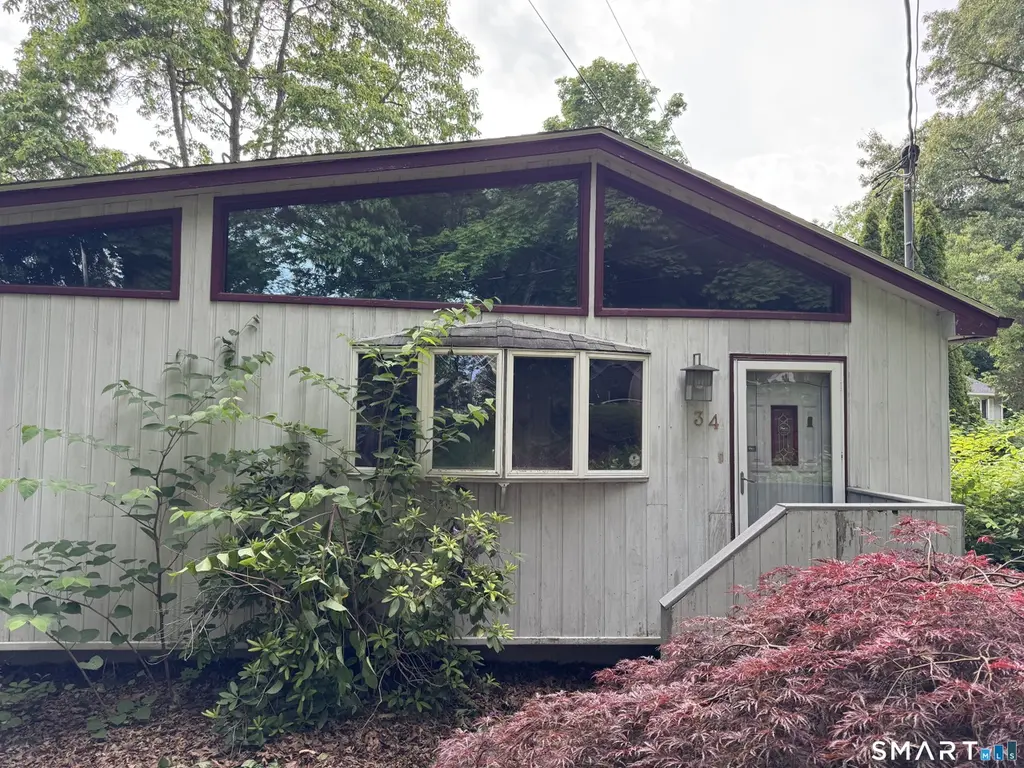
Calling all flippers, builders, remodelers and anyone looking for an opportunity to reimagine and renovate! This home offers 1,509 sf of living space and 0.45 acres of land to bring your ideas and visions to life! Tucked away but still minutes to everything you need - Just a short drive to Route 80 and major Highways, Downtown New Haven, Yale, Tweed Airport, shopping and local eateries! Being sold as-is. * * Please note that the house is physically numbered 34 Pleasant Ave but its legal address is 28 Pleasant Ave * * Multiple offers - Highest and Best by Thursday 6/4/26 at 12:00 PM.
Key facts
- 0.45 acre lot
- Built 1925
- Listed 4 days
Property features AI
Exterior
- Utilities: Public water connected; Public sewer connected; Domestic hot water; Fuel tank located in basement
- Home design: Single-family home
- Construction: Frame construction; Concrete foundation
- Exterior features: Open lot; Wood siding; Asphalt shingle roof; Grey exterior with red trim
Interior
- Kitchen: Electric range; Range hood; Refrigerator; Dishwasher
- Bedrooms: 2 bedrooms
- Bathrooms: 2 full bathrooms
- Heating & cooling: Hot air heating (oil-fired); Wall unit cooling
- Interior features: Crawl space basement; Attic with storage space and pull-down stairs; Total of 5 rooms
- Laundry & utility: Washer and electric dryer in kitchen (main level)
Neighborhood map
What this means for you Summary
Snapshot
- This is a 2-bed/1.0-bath single-family listed at $175k.
Deal economics
- At list price, monthly cash flow is $352 ($4k/yr) — positive.
- The deal already cash-flows at list — no discount required.
- Meets the 1% rule at list price ($2k rent vs $175k).
- Cap rate 8.7% vs local median 3.8% in East Haven — top-decile yield for the area; either an underpriced asset or a hidden risk that comps aren't pricing in. Stress-test before assuming the spread holds.
Location & tenants
- Location reads 70/100 on livability (#99 in CT) — a middle-class / working-renter tenant base. Strengths: housing A+, crime A-, health & safety B+; Watch: amenities F, commute F.
- East Haven School District (suburban): math 25% / reading 40% proficiency, ranked #118 of 153 in CT (top 77%) — families likely to look elsewhere, expect single-tenant / working-renter base with shorter leases.
- Zoned schools: East Haven High School (math 17% / reading 42%, grade F, #139 of 194 statewide, top 74%, 849 students, 47% FRL).
- Market conditions: Rents flat; 100 active listings in the ZIP; 5 comparable units currently listed for rent nearby; rentals leasing fast (median 3d on market — plan ~1-2 weeks tenant-placement turnaround); solid renter incomes; 1,059 units permitted in South Central Connecticut Planning Region in 2024 (779 in 5+ unit buildings).
Forward outlook
- Local home prices are declining (-3.0%/yr); year-one equity from $1k of loan paydown is wiped out by about $5k of value loss. Plan a longer hold.
Negotiation context
- Only 4 days on market — expect competitive offers; lowballing is unlikely to land.
Risks & watch-outs
- Watch-outs: built in 1925 — expect roof / HVAC / electrical / plumbing capex.
- Climate carrying-cost: major wind risk, 61% chance of damaging wind over 30y; extreme-heat days projected 7→16/yr by 2055 (HVAC capex compounding) — expect insurance premiums to compound above CPI over the hold.
Questions for the listing agent
- Built in 1925 — when were the roof, HVAC, electrical panel, plumbing, and water heater last replaced?
- Is there a deadline driving the sale (1031 exchange, divorce, estate, relocation)? That informs how much negotiation room exists.
- Schools are D-rated, which usually means shorter tenancies and higher turnover. Who's the typical renter profile here, and what's been the actual vacancy rate?
- What's the average days-on-market for RENTAL listings here right now (not sales)? A rising rental-DOM trend means longer vacancies and softer asking-rent achievability than the comps imply.
- What's the recent tenant-quality profile in this submarket — average credit score on applications, eviction rate, late-payment / NSF rate, and stable-employment percentage? A property-management company in the area should have these aggregated.
- How much new for-sale + rental construction is in the pipeline within 1–3 miles? Heavy new supply typically softens prices + rents 12–24 months out; constrained supply supports both.
Investment metrics
- 1% rule
- 1.20% ✓
- Cap rate
- 8.71%
- Cash-on-cash
- 8.63%
- DSCR
- 1.38
- GRM
- 6.9
CMA / ARV
- ARV (on-the-fly)
- $377,250
- Comps found
- 12
Show comp detail 12 sales within ~0.75 mi
| Address | Dist | Beds/Ba | Sqft | Sold | Price | $/sf | Match |
|---|---|---|---|---|---|---|---|
| 30 Thompson St | 0.36mi | 3/2.0 (+1) | 1,500 (-1%) | 4mo | $310,000 | $207 | 70 |
| 187 Eddon Dr | 0.44mi | 3/2.0 (+1) | 1,525 (+1%) | 2mo | $470,000 | $308 | 67 |
| 118 Hellstrom Rd | 0.41mi | 3/1.5 (+1) | 1,562 (+4%) | 4mo | $385,000 | $246 | 65 |
| 421 Strong St | 0.35mi | 3/2.0 (+1) | 1,368 (-9%) | 0mo | $700,000 | $512 | 59 |
| 30 S Dale St | 0.59mi | 3/1.5 (+1) | 1,502 (-0%) | 10mo | $375,000 | $250 | 56 |
| 6 Maplevale Ct | 0.26mi | 3/2.0 (+1) | 1,654 (+10%) | 10mo | $366,000 | $221 | 54 |
| 472 Strong St | 0.34mi | 3/1.0 (+1) | 1,344 (-11%) | 10mo | $337,000 | $251 | 52 |
| 965 N High St | 0.74mi | 3/1.0 (+1) | 1,552 (+3%) | 4mo | $312,000 | $201 | 52 |
| 26 Hunt Ln | 0.52mi | 3/1.0 (+1) | 1,368 (-9%) | 10mo | $340,000 | $249 | 47 |
| 8 Navarro Rd | 0.51mi | 3/1.0 (+1) | 1,404 (-7%) | 17mo | $350,000 | $249 | 46 |
| 116 Crest Ave | 0.71mi | 3/3.0 (+1) | 1,408 (-7%) | 11mo | $400,000 | $284 | 34 |
| 47 S Strong St | 0.72mi | 3/2.5 (+1) | 1,675 (+11%) | 13mo | $456,000 | $272 | 26 |
Match score weights: distance 35% · size 25% · config 20% · recency 20%. Top-matched comps best support the ARV.
Projected returns pro-forma
-3.0% appreciation · 0.79% rent growth · sell at horizon
- IRR
- -5.9%
- Equity multiple
- 0.79×
- Total profit
- $-10,398
- Equity at exit
- $26,093
- IRR
- 0.7%
- Equity multiple
- 1.05×
- Total profit
- $2,258
- Equity at exit
- $15,131
Cash invested: $49,000 (down + closing). Projections, not guarantees.
Landlord ↔ Tenant lean methodology
- Overall (STATE)
- 27 Tenant-Leaning
- State Connecticut
- 27 Tenant-Leaning · D+7
- County
- — inherits STATE
- City
- — inherits STATE
ZIP-level market 06512
- Rents YoY
- 0.8%
- Active inventory
- 100
- Price-to-rent
- 6.9×
Monthly cashflow live
- Estimated rent
- $2,104 high interval (Pro) →
- Mortgage (P&I)
- −$918
- Tax from tax record
- −$319 /mo · $3,826/yr
- Insurance
- −$73
- HOA
- −$0
- Vacancy / Maint / Mgmt
- −$442
- Net cashflow
- $352
Break-even live
UW: 25.0% down · 7.5% · 30yr · 1.5% tax · 5.0% vac · 8.0% maint · 8.0% mgmt
Financing live
Cash to close
- Down payment
- $43,750
- Closing costs
- $5,250
- Reserves months
- —
- Total cash needed
- —
Loan-product check · same deal, 3 products live
Conventional
25% down · 7.5% · 30yr
- Down + closing
- —
- Monthly P&I
- —
- Monthly cashflow
- —
- DSCR
- —
- Eligible?
- —
Personal DTI + credit; lowest rate.
DSCR
20% down · 8.5% · 30yr
- Down + closing
- —
- Monthly P&I
- —
- Monthly cashflow
- —
- DSCR
- —
- Eligible?
- —
No personal income docs; deal must DSCR.
Hard money
10% down · 12.0% · 12mo
- Down + closing
- —
- Monthly P&I
- —
- Monthly cashflow
- —
- DSCR
- —
- Eligible?
- —
Short-term bridge; refi at stabilization.
Rent comps 5 comps
| Address | Beds | Baths | Sqft | Rent | $/sqft | DOM | Units | Dist |
|---|---|---|---|---|---|---|---|---|
| 75 Redwood Dr #708 East Haven, CT | 2.0 | 2.0 | 1265 | $2,500 | $1.98 | 2d | 1 | 0.50mi |
| 430 Eastern St New Haven, CT | 1.0–3.0 | 1.0–1.5 | 900 | $1,832 | $2.04 | 2d | 2 | 1.13mi |
| 1425 Quinnipiac Ave #112 New Haven, CT | 2.0 | 1.5 | 1212 | $2,000 | $1.65 | 43d | 1 | 1.15mi |
| 1425 Quinnipiac Ave #302 New Haven, CT | 2.0 | 1.5 | 1212 | $2,000 | $1.65 | 18d | 1 | 1.15mi |
| 1314 Quinnipiac Ave New Haven, CT | 2.0–3.0 | 1.0 | 1150 | $1,695 | $1.47 | 3d | 8 | 1.25mi |
Listing history 6 events
-
2026-06-07statusdays on market $175,000 Under Contract 4 DOM
-
2026-06-05days on market $175,000 Active 3 DOM
-
2026-06-03remarks 592-char remark
-
2026-06-03days on market $175,000 Active 2 DOM
-
2026-06-01remarks 524-char remark
-
2026-06-01$175,000 Active 1 DOM
ⓘ Source: listings_history table (triggers on properties + properties_extension) + one-shot
backfill from property_details.listing_events for pre-trigger history.
Tax reassessment forecast CT · Partial reset (capped growth)
- Current annual tax
- $3,826 · $319/mo
- Projected year-2 tax
- $3,826 · $319/mo
- Expected delta
- $0/yr ($0/mo · 0.0%)
ⓘ Screening estimate from a state-policy table — verify with the county assessor before closing.
Climate risk First Street
- Flood 1/10 Low FEMA zone X (unshaded) · 0% chance over 30 yrs
- Wildfire 2/10 Low
- Heat 6/10 Major 7 d/yr ≥97°F today · 16 d/yr by 30 yrs out
- Wind 6/10 Major 61% chance of damaging wind over 30 yrs
- Air quality 5/10 Major 6 unhealthy d/yr today · 8 by 30 yrs out
Nearby sold comps map
Loading sold comps map…
Walkable amenities ~0.75 mi
Loading nearby amenities…
Taxation est. · year 1
- Rental income
- $25,243
- − Mortgage interest
- −$9,803
- − Property taxes
- −$3,826
- − Insurance
- −$875
- − Repairs & maintenance
- −$2,019
- − Management
- −$2,019
- − Depreciation
- −$5,091
- Taxable income
- $1,610
- Est. tax owed @ 24.0%
- −$386
- After-tax cash flow
- $3,842/yr
For passive investors: Depreciation is non-cash, so a rental often shows a tax loss while cash-flowing — sheltering income. Rental losses are passive: they offset passive income freely, and up to $25,000/yr can offset ordinary (W-2) income if you actively participate and your MAGI is under $100k (phasing out to $0 by $150k); unused losses carry forward. On sale, claimed depreciation is recaptured at up to 25%, and gains may owe capital-gains tax (a 1031 exchange can defer both). Figures are a year-1 estimate at your 24.0% rate — not tax advice; consult a CPA.
Schools (NCES district)
- District
- East Haven School District
- NCES district ID
- 0901290
- Math proficiency
- 25% ▼ -7.00%
- Reading proficiency
- 40% ▼ -7.00%
- Median HH income
- $61,869
- Composite
- 29.35/100
- National rank
- #6534
- State rank
- #118 of 153 in CT
Livability — East Haven
- Score
- 70/100
- State rank
- #99
- US rank
- #7805
Category grades
Schools grade is shown separately in the Schools card above.
Census & demographics
- Census place
- East Haven, CT
- County
- New Haven County · 688,236 people
- City population
- 28,830
- Metro
- New Haven-Milford, CT
- Population (ZIP)
- 28,830
- Household income
- $96,146
- Rent vs Own
- Severe rent burden
- 770.0
Population outlook (South Central Connecticut County) Hauer SSP2
- By 2040
- 608,362
Race, ethnicity, and origin ACS 2023
- Neighborhood character
- Predominantly White (68%)
- Race & ethnicity
- White 68% Hispanic / Latino 19% Two or more races 9% Black 6% Asian 3%
- Hispanic origin (detail)
- Mexican 1% Puerto Rican 8%
- Common ancestry
- Romanian 5% Lithuanian 2% Russian 1%
- Foreign-born
- 12% · Canada, China, Jamaica
- Languages at home
- 81% English-only · Spanish 12% Other Indo-European 3% Other Asian/Pacific 1%
Political lean MEDSL · South Central Connecticut
- 2024 margin
- Strong D (+20.1) · D 59.0% · R 38.9% · Other 2.1%
- All cycles
- 2024: D+20.1
Not yet ingested
- Civics
- —
Market trends
- HPI YoY
- ▼ -302.63%
- Current HPI
- 302.2679
- Rent YoY
- ▲ 0.79%
- Metro
- New Haven-Milford, CT
- State GDP YoY
- ▲ 1.06%
- F500 in state
- 38
Industry mix (Fortune 500 HQ in CT)
| Industry | F500 HQs | Revenue |
|---|---|---|
| Industrial Machinery | 4 | $38B |
|
||
| Insurance | 3 | $71B |
|
||
| Financial Services | 2 | $25B |
|
||
| Transportation / Logistics | 2 | $18B |
|
||
| Healthcare | 1 | $247B |
|
||
| Telecommunications | 1 | $55B |
|
||
Price history
1 event — show timeline
- 2026-06-01 Listed $175,000 Smart MLS
Property tax history
+0.3%/yrLatest (2023): $3,826 · +0.0% YoY. Source: county tax records.
Cash-flow waterfall
monthlySold comps — $/sqft
last 12 mo · ≤1 miLoading sold comps…