4360 Drumheller Rd · Bath, MI
Flood risk 1/10 · Minimal
- FEMA flood zone
- X (unshaded)
- Chance of flooding over 30 yrs
- 0.0%
- Est. flood insurance / yr
- $473 – $860
Fire risk 1/10 · Minimal
- Est. fire insurance / yr
- $784 – $1,456
Heat risk 2/10 · Minimal
- Hot days now (above 96°F)
- 7 days/yr
- Hot days in 30 yrs
- 15 days/yr
Wind risk 2/10 · Minimal
- Chance of severe wind over 30 yrs
- —
Air-quality risk 2/10 · Minimal
- Unhealthy air days now
- 1 days/yr
- Unhealthy air days in 30 yrs
- 2 days/yr
Risk factors via First Street. Map © Google.
Why this score? — see what drove the D grade
The composite is a weighted blend of 9 inputs, each scored 0–100. Each bar is that input's sub-score; the figure is the points it added to the 100-point composite (weight × sub-score).
- ARV discount +14.7/15.0
- Cash flow +11.8/30.0
- DSCR +3.5/10.0
- Livability +3.5/5.0
- Schools +3.2/10.0
- 1% rule +3.0/10.0
- Rent growth +2.5/5.0
- Condition / age +2.5/5.0
- Appreciation +0.0/10.0
$190,000
🖨 Deal sheet 📄 Offer letter ✓ Due diligence
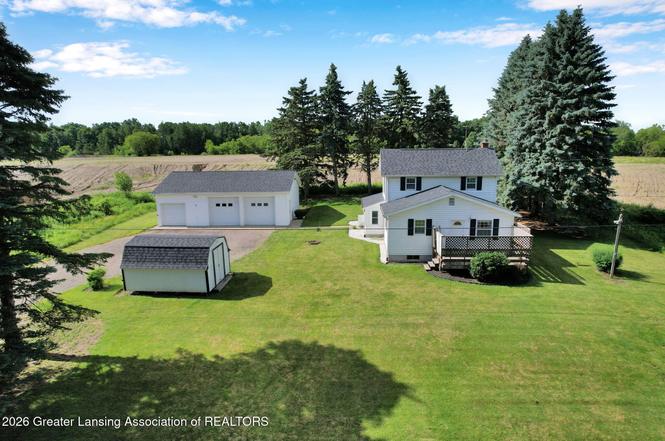
Listing remarks MLS
Bring your vision and make this spacious 1-acre property your own! This charming home offers solid potential for buyers looking for an opportunity to create something special! With generous outdoor space, mature trees, and room to expand, the possibilities are endless. The home features a functional layout with a dining area off the kitchen, a family room, living room and 1st floor laundry! The primary bedroom completes the 1st floor and 2 additional bedrooms on the 2nd floor. A detached 3-car garage (32x40) offers abundant space for vehicles, storage, workshop projects, or hobby enthusiasts! UPDATES INCLUDE: New roofs (house, garage & shed) - (2024), New furnace and A/C (2016) and New Septic Tank AND Drain field (2012). Freezer in bsmt stays w/ home. Home is being sold "as is".
Key facts
- Functional layout
- 1 acre property
- Mature trees
Tags
Property features AI
Exterior
- Parking: Detached oversized garage with 3 spaces; Garage door opener; Floor drain
- Utilities: Septic tank; High-speed internet available
- Home design: Two levels; Living area approximately 1467; Primary use: residential
- Construction: Vinyl siding; Shingle roof; Year built not specified
- Exterior features: Deck; Shed(s)
Interior
- Kitchen: Electric range; Microwave; Refrigerator; Electric water heater
- Bedrooms: Primary bedroom (13.6 x 10.9); Bedroom 2 (13.7 x 10.5); Bedroom 3 (10.9 x 7.4)
- Flooring: Carpet; Hardwood; Vinyl
- Bathrooms: 1 full bathroom
- Heating & cooling: Propane heating; Central air conditioning
- Interior features: Water softener (owned); Daylight full basement with crawl space (Michigan style)
- Laundry & utility: Washer included; Main level laundry
Neighborhood map
What this means for you Summary
Snapshot
- This is a 3-bed/1.0-bath single-family listed at $190k.
Deal economics
- At list price, monthly cash flow is $-53 ($-634/yr) — negative.
- To cash-flow at today's rent, offer at most $181k (4.9% below list).
- To meet the 1% rule (rent ≥ 1% of price), the offer needs to be $153k (19.7% below list).
- Recommended offer: $153k (19.7% below list) — sets the bar for 1% rule.
- Cap rate 6.0% vs local median 2.0% in Bath — top-decile yield for the area; either an underpriced asset or a hidden risk that comps aren't pricing in. Stress-test before assuming the spread holds.
Location & tenants
- Location reads 69/100 on livability (#335 in MI) — a middle-class / working-renter tenant base. Strengths: crime A+, cost of living A+, housing A+; Watch: employment D, amenities F, commute F.
- Bath Community Schools (suburban): math 25% / reading 47% proficiency, ranked #247 of 540 in MI (top 46%) — families likely to look elsewhere, expect single-tenant / working-renter base with shorter leases.
- Market conditions: 24 active listings in the ZIP; 154 units permitted in Clinton County in 2024 (0 in 5+ unit buildings).
Forward outlook
- Local home prices are declining (-3.0%/yr); year-one equity from $1k of loan paydown is wiped out by about $6k of value loss. Plan a longer hold.
Negotiation context
- Only 1 days on market — expect competitive offers; lowballing is unlikely to land.
- 2 sale attempts with the ask held roughly flat each time — persistent listings suggest the price (not the market) is what's stuck; bring a comps-based counter.
Questions for the listing agent
- What do current leases actually rent for vs. the listed asking? Can we see a recent rent roll and the last 12 months of T-12 income?
- Is there a deadline driving the sale (1031 exchange, divorce, estate, relocation)? That informs how much negotiation room exists.
- Schools are B-rated — typically a magnet for longer-tenancy family renters. What's the average tenant stay here, and is there a school-zone premium baked into asking?
- The area grade is low — what's the realistic commute time and amenity access for the typical tenant pool here? Any planned neighborhood developments (good or bad) we should know about?
- What's the average days-on-market for RENTAL listings here right now (not sales)? A rising rental-DOM trend means longer vacancies and softer asking-rent achievability than the comps imply.
- What's the recent tenant-quality profile in this submarket — average credit score on applications, eviction rate, late-payment / NSF rate, and stable-employment percentage? A property-management company in the area should have these aggregated.
- How much new for-sale + rental construction is in the pipeline within 1–3 miles? Heavy new supply typically softens prices + rents 12–24 months out; constrained supply supports both.
Investment metrics
- 1% rule
- 0.80% ✗
- Cap rate
- 5.96%
- Cash-on-cash
- -1.19%
- DSCR
- 0.95
- GRM
- 10.4
CMA / ARV
- ARV (on-the-fly)
- $226,380
- Comps found
- 1
Show comp detail 1 sale within ~0.75 mi
| Address | Dist | Beds/Ba | Sqft | Sold | Price | $/sf | Match |
|---|---|---|---|---|---|---|---|
| 4364 E Clark Rd | 0.53mi | 3/1.0 | 960 (+4%) | 24mo | $235,000 | $245 | 49 |
Match score weights: distance 35% · size 25% · config 20% · recency 20%. Top-matched comps best support the ARV.
Projected returns pro-forma
-3.0% appreciation · 3.0% rent growth · sell at horizon
- IRR
- -18.3%
- Equity multiple
- 0.36×
- Total profit
- $-34,162
- Equity at exit
- $28,330
- IRR
- -10.6%
- Equity multiple
- 0.36×
- Total profit
- $-34,120
- Equity at exit
- $16,428
Cash invested: $53,200 (down + closing). Projections, not guarantees.
Landlord ↔ Tenant lean methodology
- Overall (STATE)
- 62 Landlord-Friendly
- State Michigan
- 62 Landlord-Friendly · EVEN
- County
- — inherits STATE
- City
- — inherits STATE
ZIP-level market 48808
- Home prices YoY
- -22.5%
- Active inventory
- 24
- Price-to-rent
- 10.4×
Monthly cashflow live
- Estimated rent
- $1,526 medium interval (Pro) →
- Mortgage (P&I)
- −$996
- Tax from tax record
- −$183 /mo · $2,198/yr
- Insurance
- −$79
- HOA
- −$0
- Vacancy / Maint / Mgmt
- −$321
- Net cashflow
- $-53
Break-even live
UW: 25.0% down · 7.5% · 30yr · 1.5% tax · 5.0% vac · 8.0% maint · 8.0% mgmt
Financing live
Cash to close
- Down payment
- $47,500
- Closing costs
- $5,700
- Reserves months
- —
- Total cash needed
- —
Loan-product check · same deal, 3 products live
Conventional
25% down · 7.5% · 30yr
- Down + closing
- —
- Monthly P&I
- —
- Monthly cashflow
- —
- DSCR
- —
- Eligible?
- —
Personal DTI + credit; lowest rate.
DSCR
20% down · 8.5% · 30yr
- Down + closing
- —
- Monthly P&I
- —
- Monthly cashflow
- —
- DSCR
- —
- Eligible?
- —
No personal income docs; deal must DSCR.
Hard money
10% down · 12.0% · 12mo
- Down + closing
- —
- Monthly P&I
- —
- Monthly cashflow
- —
- DSCR
- —
- Eligible?
- —
Short-term bridge; refi at stabilization.
Listing history 2 events
-
2026-06-18remarks 695-char remark
-
2026-06-18$190,000 Active 1 DOM
ⓘ Source: listings_history table (triggers on properties + properties_extension) + one-shot
backfill from property_details.listing_events for pre-trigger history.
Tax reassessment forecast MI · Partial reset (capped growth)
- Current annual tax
- $2,198 · $183/mo
- Projected year-2 tax
- $2,562 · $214/mo
- Expected delta
- +$364/yr (+$30/mo · 16.6%)
ⓘ Screening estimate from a state-policy table — verify with the county assessor before closing.
Climate risk First Street
- Flood 1/10 Low FEMA zone X (unshaded) · 0% chance over 30 yrs
- Wildfire 1/10 Low
- Heat 2/10 Low 7 d/yr ≥96°F today · 15 d/yr by 30 yrs out
- Wind 2/10 Low
- Air quality 2/10 Low 1 unhealthy d/yr today · 2 by 30 yrs out
Nearby sold comps map
Loading sold comps map…
Walkable amenities ~0.75 mi
Loading nearby amenities…
Taxation est. · year 1
- Rental income
- $18,318
- − Mortgage interest
- −$10,643
- − Property taxes
- −$2,198
- − Insurance
- −$950
- − Repairs & maintenance
- −$1,465
- − Management
- −$1,465
- − Depreciation
- −$5,527
- Taxable loss
- −$3,931
- Est. tax savings @ 24.0%
- +$944
- After-tax cash flow
- $310/yr
For passive investors: Depreciation is non-cash, so a rental often shows a tax loss while cash-flowing — sheltering income. Rental losses are passive: they offset passive income freely, and up to $25,000/yr can offset ordinary (W-2) income if you actively participate and your MAGI is under $100k (phasing out to $0 by $150k); unused losses carry forward. On sale, claimed depreciation is recaptured at up to 25%, and gains may owe capital-gains tax (a 1031 exchange can defer both). Figures are a year-1 estimate at your 24.0% rate — not tax advice; consult a CPA.
Schools (NCES district)
- District
- Bath Community Schools
- NCES district ID
- 2604170
- Math proficiency
- 25% ▼ -12.00%
- Reading proficiency
- 47% ▼ -4.00%
- Median HH income
- $57,276
- Composite
- 31.78/100
- National rank
- #5889
- State rank
- #247 of 540 in MI
Livability — Bath
- Score
- 69/100
- State rank
- #335
- US rank
- #8214
Category grades
Schools grade is shown separately in the Schools card above.
Census & demographics
- City population
- 6,424
- Population (ZIP)
- 6,424
Population outlook (Clinton County) Hauer SSP2
- Today (2025)
- 81,490 people
- By 2030
- 82,558 · +1.3%
- By 2040
- 82,325 · +1.0%
- By 2050
- 79,133 · -2.9%
- By 2075
- 65,737 · -19.3%
- By 2100
- 51,314 · -37.0%
Race, ethnicity, and origin ACS 2023
- Neighborhood character
- Predominantly White (89%)
- Race & ethnicity
- White 89% Hispanic / Latino 6% Two or more races 4% Asian 1%
- Hispanic origin (detail)
- Mexican 2% Puerto Rican 4%
- Common ancestry
- Lithuanian 4% Romanian 4% Iranian 3%
- Foreign-born
- 3% · Canada, Vietnam
- Languages at home
- 97% English-only · Other Indo-European 1%
Political lean MEDSL · Clinton
- 2024 margin
- Lean R (+8.6) · D 44.9% · R 53.5% · Other 1.5%
- 2008→2024 swing
- -9.3pp toward R · 2008: 0.7pp · 2024: -8.6pp
- All cycles
- 2024: R+8.6 2020: R+6.5 2016: R+12.7 2012: R+6.2 2008: D+0.7
Not yet ingested
- Civics
- —
Market trends
- HPI YoY
- ▼ -74.96%
- Current HPI
- 258.5227
- Rent YoY
- —
- Metro
- —
- State GDP YoY
- ▲ 1.37%
- F500 in state
- 28
Industry mix (Fortune 500 HQ in MI)
| Industry | F500 HQs | Revenue |
|---|---|---|
| Automotive Parts | 3 | $48B |
|
||
| Automotive | 2 | $372B |
|
||
| Chemicals | 1 | $45B |
|
||
| Automotive Retail | 1 | $29B |
|
||
| Healthcare / Medical Devices | 1 | $23B |
|
||
| Automotive Technology | 1 | $20B |
|
||
Price history
+0.0% since first listed2 events — show timeline
- 2026-06-17 Listed $190,000 REALCOMP
- 2026-06-17 Listed $190,000 Greater Lansing AoR
Property tax history
+2.9%/yrLatest (2025): $2,198 · +2.7% YoY. Source: county tax records.
Cash-flow waterfall
monthlySold comps — $/sqft
last 12 mo · ≤1 miLoading sold comps…