7728 Royal Fern Dr · Denton, TX
Flood risk 1/10 · Minimal
- FEMA flood zone
- X (unshaded)
- Chance of flooding over 30 yrs
- 0.0%
- Est. flood insurance / yr
- $507 – $1,088
Fire risk 6/10 · Moderate
- Est. fire insurance / yr
- $1,222 – $2,270
Heat risk 7/10 · Major
- Hot days now (above 109°F)
- 7 days/yr
- Hot days in 30 yrs
- 22 days/yr
Wind risk 6/10 · Moderate
- Chance of severe wind over 30 yrs
- 27.0%
Air-quality risk 4/10 · Minor
- Unhealthy air days now
- 4 days/yr
- Unhealthy air days in 30 yrs
- 5 days/yr
Risk factors via First Street. Map © Google.
Why this score? — see what drove the D+ grade
The composite is a weighted blend of 9 inputs, each scored 0–100. Each bar is that input's sub-score; the figure is the points it added to the 100-point composite (weight × sub-score).
- Cash flow +12.6/30.0
- ARV discount +12.6/15.0
- Livability +4.4/5.0
- Schools +4.1/10.0
- Condition / age +4.0/5.0
- DSCR +3.8/10.0
- 1% rule +3.7/10.0
- Rent growth +2.5/5.0
- Appreciation +0.0/10.0
$305,990
🖨 Deal sheet (PDF) 📄 Offer letter ✓ Due diligence
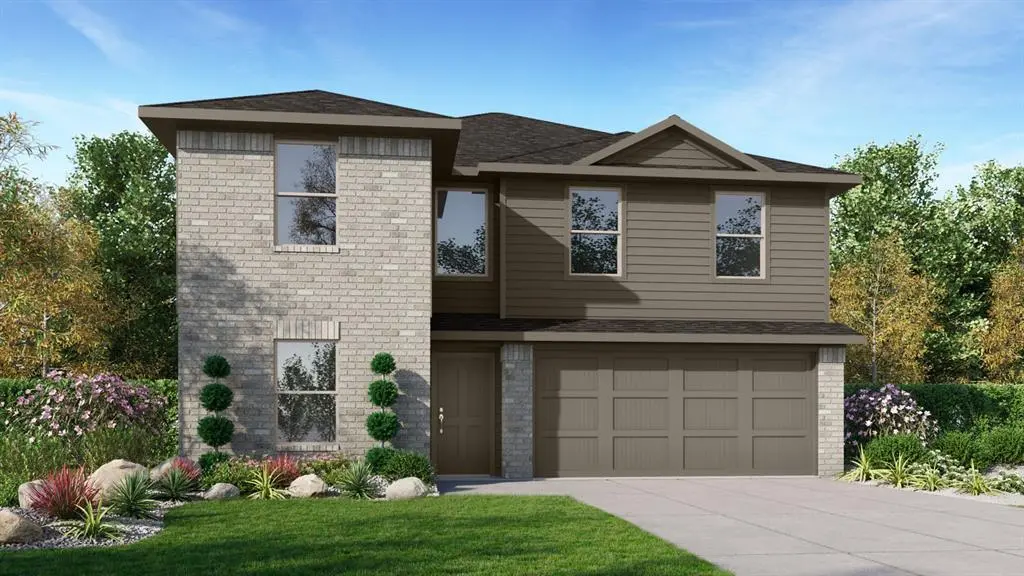
Listing remarks
D. R. Horton America's Builder since 2002 is excited to serve as your new home builder in Monarch at the Meadows, a fabulous unique master planned community in Denton and Krum ISD! The two-story Dawson Floorplan, Elevation A, with an estimated Summer completion, offers 5 bedrooms, 3 bathrooms, an upstairs game room, and a 2-car garage, providing a thoughtfully designed layout ideal for modern living. The open-concept first floor features a welcoming family room that flows seamlessly into the dining area and contemporary kitchen, creating a functional space for everyday living and entertaining. The kitchen is equipped with quartz countertops, 36” upper cabinets with hardware, stainless
Key facts
- Contemporary kitchen
- Quartz countertops
- Walk in pantry
Tags
Neighborhood map
What this means for you Summary
Snapshot
- This is a 5-bed/3.0-bath single-family listed at $306k. Condition is rated good.
Deal economics
- At list price, monthly cash flow is $-39 ($-465/yr) — negative.
- To cash-flow at today's rent, offer at most $300k (1.8% below list).
- To meet the 1% rule (rent ≥ 1% of price), the offer needs to be $268k (12.6% below list).
- Recommended offer: $268k (12.6% below list) — sets the bar for 1% rule.
- Cap rate 6.1% vs local median 3.4% in Denton — top-decile yield for the area; either an underpriced asset or a hidden risk that comps aren't pricing in. Stress-test before assuming the spread holds.
Location & tenants
- Location reads 88/100 on livability (#2 in TX, #210 nationally) — a professional / high-income tenant draw. Strengths: amenities A+, commute A+, housing A+.
- Krum ISD (rural): math 44% / reading 46% proficiency, ranked #218 of 826 in TX (top 26%) — families likely to look elsewhere, expect single-tenant / working-renter base with shorter leases.
- Zoned schools: Krum Early Education Center (430 students, 49% FRL); Krum Middle (math 48% / reading 47%, grade C-, #408 of 1,662 statewide, top 25%, 541 students, 37% FRL); Krum H S (math 37% / reading 52%, grade F, #652 of 1,632 statewide, top 43%, 686 students, 31% FRL).
- Market conditions: 281 active listings in the ZIP; 1 comparable units currently listed for rent nearby; solid renter incomes; 10,531 units permitted in Denton County in 2024 (2,713 in 5+ unit buildings).
- This rent runs 32% of the median local income ($102k/yr) — at the standard rent-burdened threshold; future hikes will face affordability resistance.
Forward outlook
- Local home prices are declining (-3.0%/yr); year-one equity from $2k of loan paydown is wiped out by about $9k of value loss. Plan a longer hold.
- Denton County population projected at +66% by 2050 — long-run rental-demand tailwind backs the buy-and-hold thesis.
Negotiation context
- Only 1 days on market — expect competitive offers; lowballing is unlikely to land.
Risks & watch-outs
- Climate carrying-cost: major wind risk, 27% chance of damaging wind over 30y; major wildfire risk; extreme-heat days projected 7→22/yr by 2055 (HVAC capex compounding) — expect insurance premiums to compound above CPI over the hold.
Questions for the listing agent
- What do current leases actually rent for vs. the listed asking? Can we see a recent rent roll and the last 12 months of T-12 income?
- What does the HOA fee cover, when was the last increase, and are there any pending special assessments or reserve-fund shortfalls?
- Is there a deadline driving the sale (1031 exchange, divorce, estate, relocation)? That informs how much negotiation room exists.
- Schools are B-rated — typically a magnet for longer-tenancy family renters. What's the average tenant stay here, and is there a school-zone premium baked into asking?
- The area grade is low — what's the realistic commute time and amenity access for the typical tenant pool here? Any planned neighborhood developments (good or bad) we should know about?
- What's the average days-on-market for RENTAL listings here right now (not sales)? A rising rental-DOM trend means longer vacancies and softer asking-rent achievability than the comps imply.
- What's the recent tenant-quality profile in this submarket — average credit score on applications, eviction rate, late-payment / NSF rate, and stable-employment percentage? A property-management company in the area should have these aggregated.
- How much new for-sale + rental construction is in the pipeline within 1–3 miles? Heavy new supply typically softens prices + rents 12–24 months out; constrained supply supports both.
Investment metrics
- 1% rule
- 0.87% ✗
- Cap rate
- 6.14%
- Cash-on-cash
- -0.54%
- DSCR
- 0.98
- GRM
- 9.5
CMA / ARV
- ARV (on-the-fly)
- $344,898
- Comps found
- 12
Show comp detail 12 sales within ~0.75 mi
| Address | Dist | Beds/Ba | Sqft | Sold | Price | $/sf | Match |
|---|---|---|---|---|---|---|---|
| 505 Amber Fields Dr | 0.19mi | 5/3.0 | 2,129 (0%) | 2mo | $306,990 | $144 | 90 |
| 616 Amber Fields Dr | 0.14mi | 5/3.0 | 2,093 (-2%) | 3mo | $358,240 | $171 | 88 |
| 540 Amber Fields Dr | 0.14mi | 5/3.0 | 2,093 (-2%) | 2mo | $349,990 | $167 | 88 |
| 548 Shaded Grove Dr | 0.20mi | 4/2.5 (-1) | 2,087 (-2%) | 3mo | $337,990 | $162 | 78 |
| 713 Wildrye Ln | 0.07mi | 5/2.5 | 1,818 (-15%) | 1mo | $299,990 | $165 | 70 |
| 533 Amber Fields Dr | 0.13mi | 5/2.5 | 1,818 (-15%) | 2mo | $293,990 | $162 | 66 |
| 521 Amber Fields Dr | 0.15mi | 5/2.5 | 1,818 (-15%) | 2mo | $297,990 | $164 | 65 |
| 509 Amber Fields Dr | 0.18mi | 5/2.5 | 1,818 (-15%) | 1mo | $290,990 | $160 | 65 |
| 640 Shaded Grv | 0.19mi | 4/2.5 (-1) | 2,367 (+11%) | 3mo | $342,990 | $145 | 63 |
| 553 Red Admiral Ln | 0.25mi | 4/2.5 (-1) | 2,367 (+11%) | 2mo | $340,990 | $144 | 61 |
| 405 Red Admiral Ln | 0.35mi | 4/2.5 (-1) | 2,367 (+11%) | 0mo | $353,990 | $150 | 58 |
| 7524 Lavender Ln | 0.45mi | 4/2.0 (-1) | 1,877 (-12%) | 0mo | $388,334 | $207 | 50 |
Match score weights: distance 35% · size 25% · config 20% · recency 20%. Top-matched comps best support the ARV.
Projected returns pro-forma
-3.0% appreciation · 3.0% rent growth · sell at horizon
- IRR
- -17.2%
- Equity multiple
- 0.39×
- Total profit
- $-51,989
- Equity at exit
- $45,624
- IRR
- -9.1%
- Equity multiple
- 0.44×
- Total profit
- $-48,191
- Equity at exit
- $26,456
Cash invested: $85,677 (down + closing). Projections, not guarantees.
Landlord ↔ Tenant lean methodology
- Overall (STATE)
- 87 Strongly Landlord-Friendly
- State Texas
- 87 Strongly Landlord-Friendly · R+5
- County
- — inherits STATE
- City
- — inherits STATE
ZIP-level market 76259
- Home prices YoY
- -5.2%
- Active inventory
- 281
- Price-to-rent
- 9.5×
Monthly cashflow live
- Estimated rent
- $2,676 medium interval (Pro) →
- Mortgage (P&I)
- −$1,605
- Tax est. 1.5%
- −$382 /mo · $4,590/yr
- Insurance
- −$127
- HOA
- −$38
- Vacancy / Maint / Mgmt
- −$562
- Net cashflow
- $-39
Break-even live
Sensitivity live
| Price | -10% $173 | -5% $67 | +0% $-39 | +5% $-144 | +10% $-250 |
|---|---|---|---|---|---|
| Rent | -10% $-250 | -5% $-144 | +0% $-39 | +5% $67 | +10% $173 |
| Rate | -1.0pp $115 | -0.5pp $39 | base $-39 | +0.5pp $-118 | +1.0pp $-199 |
UW: 25.0% down · 7.5% · 30yr · 1.5% tax · 5.0% vac · 8.0% maint · 8.0% mgmt
Financing live
Cash to close
- Down payment
- $76,498
- Closing costs
- $9,180
- Reserves months
- —
- Total cash needed
- —
Loan-product check · same deal, 3 products live
Conventional
25% down · 7.5% · 30yr
- Down + closing
- —
- Monthly P&I
- —
- Monthly cashflow
- —
- DSCR
- —
- Eligible?
- —
Personal DTI + credit; lowest rate.
DSCR
20% down · 8.5% · 30yr
- Down + closing
- —
- Monthly P&I
- —
- Monthly cashflow
- —
- DSCR
- —
- Eligible?
- —
No personal income docs; deal must DSCR.
Hard money
10% down · 12.0% · 12mo
- Down + closing
- —
- Monthly P&I
- —
- Monthly cashflow
- —
- DSCR
- —
- Eligible?
- —
Short-term bridge; refi at stabilization.
Rent comps 1 comps
| Address | Beds | Baths | Sqft | Rent | $/sqft | DOM | Units | Dist |
|---|---|---|---|---|---|---|---|---|
| 7709 Tuscarora Dr Ponder, TX | 5.0 | 3.0 | 2093 | $2,450 | $1.17 | 13d | 1 | 0.08mi |
HOA detail
- Monthly dues
- $38 · $456/yr
Listing history 2 events
-
2026-03-16status Pending
-
2026-03-15$305,990 Active
ⓘ Source: listings_history table (triggers on properties + properties_extension) + one-shot
backfill from property_details.listing_events for pre-trigger history.
Climate risk First Street
- Flood 1/10 Low FEMA zone X (unshaded) · 0% chance over 30 yrs
- Wildfire 6/10 Major
- Heat 7/10 Severe 7 d/yr ≥109°F today · 22 d/yr by 30 yrs out
- Wind 6/10 Major 27% chance of damaging wind over 30 yrs
- Air quality 4/10 Moderate 4 unhealthy d/yr today · 5 by 30 yrs out
Nearby sold comps map
Loading sold comps map…
Walkable amenities ~0.75 mi
Loading nearby amenities…
Taxation est. · year 1
- Rental income
- $32,109
- − Mortgage interest
- −$17,140
- − Property taxes
- −$4,590
- − Insurance
- −$1,530
- − Repairs & maintenance
- −$2,569
- − Management
- −$2,569
- − HOA
- −$456
- − Depreciation
- −$8,902
- Taxable loss
- −$5,646
- Est. tax savings @ 24.0%
- +$1,355
- After-tax cash flow
- $890/yr
For passive investors: Depreciation is non-cash, so a rental often shows a tax loss while cash-flowing — sheltering income. Rental losses are passive: they offset passive income freely, and up to $25,000/yr can offset ordinary (W-2) income if you actively participate and your MAGI is under $100k (phasing out to $0 by $150k); unused losses carry forward. On sale, claimed depreciation is recaptured at up to 25%, and gains may owe capital-gains tax (a 1031 exchange can defer both). Figures are a year-1 estimate at your 24.0% rate — not tax advice; consult a CPA.
Condition & rehab AI · 2 photos
This single-family home in Monarch at the Meadows is in excellent condition with a good condition score of 80. It is move-in ready with a cosmetic rehab level, featuring modern finishes and a well-maintained exterior. The highest-ROI updates would include painting, new flooring, and new kitchen appliances to enhance both resale and rental value.
Value-add opportunities
- Both Painting and minor landscaping touch-ups — Enhances curb appeal and interior aesthetics.
- Both New flooring in high-traffic areas — Improves durability and appearance.
- Both New kitchen appliances — Modernizes the kitchen and adds value for both resale and rental.
Renovation cost estimate screening
Value-add ROI direction
- Both Painting and minor landscaping touch-ups — Enhances curb appeal and interior aesthetics. ↑
- Both New flooring in high-traffic areas — Improves durability and appearance. ↑
- Both New kitchen appliances — Modernizes the kitchen and adds value for both resale and rental. ↑
ⓘ Cost ranges are severity-bucket heuristics (US national rule-of-thumb). Get contractor quotes + a written scope before underwriting a rehab budget.
Schools (NCES district)
- District
- Krum ISD
- NCES district ID
- 4825980
- Math proficiency
- 44% ▼ -4.00%
- Reading proficiency
- 46% ▬ 0.00%
- Median HH income
- $71,808
- Composite
- 40.72/100
- National rank
- #3664
- State rank
- #218 of 826 in TX
Livability — Denton
- Score
- 88/100
- State rank
- #2
- US rank
- #210
Category grades
Schools grade is shown separately in the Schools card above.
Census & demographics
- County
- Denton County · 901,654 people
- City population
- 127,990
- Metro
- Dallas-Fort Worth-Arlington, TX
- Population (ZIP)
- 6,596
- Household income
- $101,845
- Rent vs Own
- Severe rent burden
- 180.0
Population outlook (Denton County) Hauer SSP2
- Today (2025)
- 1,053,010 people
- By 2030
- 1,192,269 · +13.2%
- By 2040
- 1,472,920 · +39.9%
- By 2050
- 1,746,506 · +65.9%
- By 2075
- 2,358,497 · +124.0%
- By 2100
- 2,779,183 · +163.9%
Race, ethnicity, and origin ACS 2023
- Neighborhood character
- Predominantly White (83%)
- Race & ethnicity
- White 83% Hispanic / Latino 11% Two or more races 8% Black 3%
- Hispanic origin (detail)
- Mexican 8%
- Common ancestry
- Slovak 1% Romanian 1% Lithuanian 1%
- Foreign-born
- 2% · Canada, South Korea
- Languages at home
- 95% English-only · Spanish 4%
Political lean MEDSL · Denton
- 2024 margin
- R (+13.2) · D 42.7% · R 55.8% · Other 1.5%
- 2008→2024 swing
- +11.0pp toward D · 2008: -24.2pp · 2024: -13.2pp
- All cycles
- 2024: R+13.2 2020: R+8.1 2016: R+20.2 2012: R+31.7 2008: R+24.2
Not yet ingested
- Civics
- —
Market trends
- HPI YoY
- ▼ -15.17%
- Current HPI
- 275.4082
- Rent YoY
- —
- Metro
- Dallas-Fort Worth-Arlington, TX
- State GDP YoY
- ▲ 3.95%
- F500 in state
- 110
Industry mix (Fortune 500 HQ in TX)
| Industry | F500 HQs | Revenue |
|---|---|---|
| Energy | 16 | $1,198B |
|
||
| Technology | 5 | $198B |
|
||
| Engineering / Construction | 4 | $72B |
|
||
| Energy Services | 3 | $60B |
|
||
| Utilities | 3 | $41B |
|
||
| Healthcare | 2 | $330B |
|
||
Price history
2 events — show timeline
- 2026-03-16 Pending — NTREIS
- 2026-03-15 Listed $305,990 NTREIS
Cash-flow waterfall
monthlySold comps — $/sqft
last 12 mo · ≤1 miLoading sold comps…