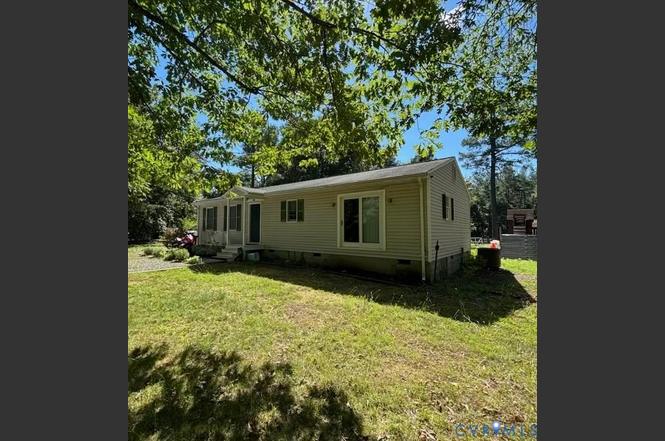
1742 Eastham Rd · Lake Land'Or, VA
Flood risk 1/10 · Minimal
- FEMA flood zone
- X (unshaded)
- Chance of flooding over 30 yrs
- 0.0%
- Est. flood insurance / yr
- $507 – $1,088
Fire risk 4/10 · Minor
- Est. fire insurance / yr
- $666 – $1,236
Heat risk 6/10 · Moderate
- Hot days now (above 106°F)
- 7 days/yr
- Hot days in 30 yrs
- 17 days/yr
Wind risk 4/10 · Minor
- Chance of severe wind over 30 yrs
- 14.0%
Air-quality risk 1/10 · Minimal
- Unhealthy air days now
- 0 days/yr
- Unhealthy air days in 30 yrs
- 0 days/yr
Risk factors via First Street. Map © Google.
Why this score? — see what drove the C+ grade
The composite is a weighted blend of 9 inputs, each scored 0–100. Each bar is that input's sub-score; the figure is the points it added to the 100-point composite (weight × sub-score).
- Cash flow +17.9/30.0
- ARV discount +15.0/15.0
- Schools +6.0/10.0
- DSCR +5.6/10.0
- 1% rule +4.2/10.0
- Appreciation +4.0/10.0
- Rent growth +2.5/5.0
- Livability +2.5/5.0
- Condition / age +2.5/5.0
$240,000
🖨 Deal sheet 📄 Offer letter ✓ Due diligence
Listing remarks MLS
7+ acres at Lake Anna! 3 bed, 2 bath one level rancher with privacy galore. Open concept living room and kitchen, 3 spacious bedrooms, master with on suite and wood stove. Huge back deck, detached garage and storage buildings offer additional space.
Key facts
- Private acres
- Acreage
- Rural setting
Tags
Property features AI
Exterior
- Parking: Detached garage; 2-car garage
- Utilities: Well water; Septic tank
- Home design: Single-story home; Resale property; Shingle roof; A2 zoning
- Construction: Block and drywall construction with vinyl siding
- Exterior features: Deck
Interior
- Kitchen: Eat-in kitchen
- Bedrooms: At least one bedroom on the main level
- Flooring: Vinyl flooring
- Bathrooms: 2 full bathrooms; Full bath with tub and shower (first level)
- Heating & cooling: Heat pump heating (electric); Central electric air conditioning
- Interior features: Ceiling fans; Eat-in kitchen; Bedroom on main level; Crawl space basement
- Laundry & utility: Electric water heater
Neighborhood map
What this means for you Summary
Snapshot
- This is a 3-bed/2.0-bath single-family listed at $240k.
Deal economics
- At list price, monthly cash flow is $202 ($2k/yr) — positive.
- The deal already cash-flows at list — no discount required.
- To meet the 1% rule (rent ≥ 1% of price), the offer needs to be $222k (7.6% below list).
- Recommended offer: $222k (7.6% below list) — sets the bar for 1% rule.
- Cap rate 7.3% vs local median 3.6% in Lake Land'Or — top-decile yield for the area; either an underpriced asset or a hidden risk that comps aren't pricing in. Stress-test before assuming the spread holds.
Location & tenants
- Location reads: area grade C — affects rentability + tenant quality, not the cash-flow math above.
- Louisa County Public School District (rural): math 64% / reading 77% proficiency, ranked #19 of 131 in VA (top 14%) — strong family-tenant draw, lease renewals of 3-5y typical.
- Market conditions: 167 active listings in the ZIP; 408 units permitted in Louisa County in 2024 (0 in 5+ unit buildings).
Forward outlook
- Local home prices are declining (-2.0%/yr); year-one equity from $2k of loan paydown is wiped out by about $5k of value loss. Plan a longer hold.
- Louisa County population projected at +4% by 2050 — modest demand growth; plan on rents tracking national, not racing it.
Negotiation context
- Only 5 days on market — expect competitive offers; lowballing is unlikely to land.
- 6 sale attempts since 9y ago with the ask held roughly flat each time — persistent listings suggest the price (not the market) is what's stuck; bring a comps-based counter.
Risks & watch-outs
- Climate carrying-cost: extreme-heat days projected 7→17/yr by 2055 (HVAC capex compounding) — expect insurance premiums to compound above CPI over the hold.
Questions for the listing agent
- Is there a deadline driving the sale (1031 exchange, divorce, estate, relocation)? That informs how much negotiation room exists.
- What's the average days-on-market for RENTAL listings here right now (not sales)? A rising rental-DOM trend means longer vacancies and softer asking-rent achievability than the comps imply.
- What's the recent tenant-quality profile in this submarket — average credit score on applications, eviction rate, late-payment / NSF rate, and stable-employment percentage? A property-management company in the area should have these aggregated.
- How much new for-sale + rental construction is in the pipeline within 1–3 miles? Heavy new supply typically softens prices + rents 12–24 months out; constrained supply supports both.
Investment metrics
- 1% rule
- 0.92% ✗
- Cap rate
- 7.30%
- Cash-on-cash
- 3.61%
- DSCR
- 1.16
- GRM
- 9.0
CMA / ARV
- ARV (on-the-fly)
- $396,288
- Comps found
- 2
Show comp detail 2 sales within ~0.75 mi
| Address | Dist | Beds/Ba | Sqft | Sold | Price | $/sf | Match |
|---|---|---|---|---|---|---|---|
| 170 Oak Rd | 0.42mi | 3/2.0 | 1,162 (+1%) | 17mo | $399,900 | $344 | 64 |
| 987 Eastham Rd | 0.74mi | 3/2.0 | 1,248 (+8%) | 2mo | $162,500 | $130 | 50 |
Match score weights: distance 35% · size 25% · config 20% · recency 20%. Top-matched comps best support the ARV.
Projected returns pro-forma
-1.99% appreciation · 3.0% rent growth · sell at horizon
- IRR
- -5.8%
- Equity multiple
- 0.77×
- Total profit
- $-15,775
- Equity at exit
- $46,718
- IRR
- 2.1%
- Equity multiple
- 1.18×
- Total profit
- $11,870
- Equity at exit
- $40,027
Cash invested: $67,200 (down + closing). Projections, not guarantees.
Landlord ↔ Tenant lean methodology
- Overall (STATE)
- 55 Moderately Landlord-Leaning
- State Virginia
- 55 Moderately Landlord-Leaning · D+2
- County
- — inherits STATE
- City
- — inherits STATE
ZIP-level market 23024
- Home prices YoY
- -0.6%
- Active inventory
- 167
- Price-to-rent
- 9.0×
Monthly cashflow live
- Estimated rent
- $2,216 medium interval (Pro) →
- Mortgage (P&I)
- −$1,259
- Tax from tax record
- −$190 /mo · $2,284/yr
- Insurance
- −$100
- HOA
- −$0
- Vacancy / Maint / Mgmt
- −$465
- Net cashflow
- $202
Break-even live
UW: 25.0% down · 7.5% · 30yr · 1.5% tax · 5.0% vac · 8.0% maint · 8.0% mgmt
Financing live
Cash to close
- Down payment
- $60,000
- Closing costs
- $7,200
- Reserves months
- —
- Total cash needed
- —
Loan-product check · same deal, 3 products live
Conventional
25% down · 7.5% · 30yr
- Down + closing
- —
- Monthly P&I
- —
- Monthly cashflow
- —
- DSCR
- —
- Eligible?
- —
Personal DTI + credit; lowest rate.
DSCR
20% down · 8.5% · 30yr
- Down + closing
- —
- Monthly P&I
- —
- Monthly cashflow
- —
- DSCR
- —
- Eligible?
- —
No personal income docs; deal must DSCR.
Hard money
10% down · 12.0% · 12mo
- Down + closing
- —
- Monthly P&I
- —
- Monthly cashflow
- —
- DSCR
- —
- Eligible?
- —
Short-term bridge; refi at stabilization.
Listing history 6 events
-
2026-06-18days on market $240,000 Active 5 DOM
-
2026-06-17remarks 699-char remark
-
2026-06-17days on market $240,000 Active 4 DOM
-
2026-06-16days on market $240,000 Active 3 DOM
-
2026-06-15remarks 601-char remark
-
2026-06-15$240,000 Active 2 DOM
ⓘ Source: listings_history table (triggers on properties + properties_extension) + one-shot
backfill from property_details.listing_events for pre-trigger history.
Tax reassessment forecast VA · Resets to sale price
- Current annual tax
- $2,284 · $190/mo
- Projected year-2 tax
- $2,284 · $190/mo
- Expected delta
- $0/yr ($0/mo · 0.0%)
ⓘ Screening estimate from a state-policy table — verify with the county assessor before closing.
Climate risk First Street
- Flood 1/10 Low FEMA zone X (unshaded) · 0% chance over 30 yrs
- Wildfire 4/10 Moderate
- Heat 6/10 Major 7 d/yr ≥106°F today · 17 d/yr by 30 yrs out
- Wind 4/10 Moderate 14% chance of damaging wind over 30 yrs
- Air quality 1/10 Low 0 unhealthy d/yr today · 0 by 30 yrs out
Nearby sold comps map
Loading sold comps map…
Walkable amenities ~0.75 mi
Loading nearby amenities…
Taxation est. · year 1
- Rental income
- $26,598
- − Mortgage interest
- −$13,444
- − Property taxes
- −$2,284
- − Insurance
- −$1,200
- − Repairs & maintenance
- −$2,128
- − Management
- −$2,128
- − Depreciation
- −$6,982
- Taxable loss
- −$1,567
- Est. tax savings @ 24.0%
- +$376
- After-tax cash flow
- $2,801/yr
For passive investors: Depreciation is non-cash, so a rental often shows a tax loss while cash-flowing — sheltering income. Rental losses are passive: they offset passive income freely, and up to $25,000/yr can offset ordinary (W-2) income if you actively participate and your MAGI is under $100k (phasing out to $0 by $150k); unused losses carry forward. On sale, claimed depreciation is recaptured at up to 25%, and gains may owe capital-gains tax (a 1031 exchange can defer both). Figures are a year-1 estimate at your 24.0% rate — not tax advice; consult a CPA.
Schools (NCES district)
- District
- Louisa County Public School District
- NCES district ID
- 5102280
- Math proficiency
- 64% ▼ -21.00%
- Reading proficiency
- 77% ▬ 0.00%
- Median HH income
- $55,036
- Composite
- 60.21/100
- National rank
- #862
- State rank
- #19 of 131 in VA
Livability — Lake Land'Or
No livability data for this city. (Only ~50 U.S. cities are tracked.)
Census & demographics
- Population (ZIP)
- 10,770
Population outlook (Louisa County) Hauer SSP2
- Today (2025)
- 36,941 people
- By 2030
- 37,752 · +2.2%
- By 2040
- 38,605 · +4.5%
- By 2050
- 38,480 · +4.2%
- By 2075
- 38,011 · +2.9%
- By 2100
- 34,748 · -5.9%
Race, ethnicity, and origin ACS 2023
- Neighborhood character
- Predominantly White (87%)
- Race & ethnicity
- White 87% Two or more races 7% Black 5% Hispanic / Latino 2%
- Common ancestry
- Slovak 4% Serbian 3% Scotch-Irish 3%
- Foreign-born
- 3% · Canada, China, Jamaica
- Languages at home
- 95% English-only · Russian/Polish/Slavic 3% German/W. Germanic 1% Spanish 1%
Political lean MEDSL · Louisa
- 2024 margin
- Strong R (+26.2) · D 36.5% · R 62.7%
- 2008→2024 swing
- -18.4pp toward R · 2008: -7.8pp · 2024: -26.2pp
- All cycles
- 2024: R+26.2 2020: R+22.9 2016: R+24.6 2012: R+13.8 2008: R+7.8
Not yet ingested
- Civics
- —
Market trends
- HPI YoY
- ▼ -1.99%
- Current HPI
- 351.4933
- Rent YoY
- —
- Metro
- —
- State GDP YoY
- ▲ 2.40%
- F500 in state
- 50
Industry mix (Fortune 500 HQ in VA)
| Industry | F500 HQs | Revenue |
|---|---|---|
| Aerospace / Defense | 4 | $236B |
|
||
| Technology / Defense | 3 | $32B |
|
||
| Financial Services | 2 | $176B |
|
||
| Utilities | 2 | $27B |
|
||
| Insurance | 2 | $25B |
|
||
| Technology | 2 | $15B |
|
||
Price history
+29.7% since first listed11 events — show timeline
- 2026-06-13 Listed $240,000 CVRMLS
- 2020-04-28 Sold (Public Records) $215,900 Public Records
- 2020-04-24 Sold (MLS) $215,900 BRIGHT MLS
- 2020-04-24 Sold (MLS) $215,900 CVRMLS
- 2020-03-10 Listed $214,700 BRIGHT MLS
- 2020-03-10 Listed $214,700 CVRMLS
- 2020-03-10 Listed $214,700 CAAR
- 2017-10-23 Sold (Public Records) $185,000 Public Records
- 2017-10-20 Sold (MLS) $185,000 CVRMLS
- 2017-06-06 Listed $185,000 CAAR
- 2017-06-06 Listed $185,000 CVRMLS
Property tax history
+7.9%/yrLatest (2024): $2,284 · +14.5% YoY. Source: county tax records.
Cash-flow waterfall
monthlySold comps — $/sqft
last 12 mo · ≤1 miLoading sold comps…