1000 9th Street South #114 · St. James, MN
Flood risk 1/10 · Minimal
- FEMA flood zone
- X (unshaded)
- Chance of flooding over 30 yrs
- 0.0%
- Est. flood insurance / yr
- $507 – $1,088
Fire risk 1/10 · Minimal
- Est. fire insurance / yr
- $888 – $1,650
Heat risk 2/10 · Minimal
- Hot days now (above 101°F)
- 7 days/yr
- Hot days in 30 yrs
- 15 days/yr
Wind risk 2/10 · Minimal
- Chance of severe wind over 30 yrs
- —
Air-quality risk 1/10 · Minimal
- Unhealthy air days now
- 0 days/yr
- Unhealthy air days in 30 yrs
- 0 days/yr
Risk factors via First Street. Map © Google.
Why this score? — see what drove the D grade
The composite is a weighted blend of 9 inputs, each scored 0–100. Each bar is that input's sub-score; the figure is the points it added to the 100-point composite (weight × sub-score).
- ARV discount +15.0/15.0
- Appreciation +9.5/10.0
- 1% rule +6.4/10.0
- Schools +3.4/10.0
- Condition / age +2.8/5.0
- Rent growth +2.5/5.0
- Livability +2.5/5.0
- Cash flow +0.0/30.0
- DSCR +0.0/10.0
$72,500
🖨 Deal sheet (PDF) 📄 Offer letter ✓ Due diligence
Listing remarks MLS
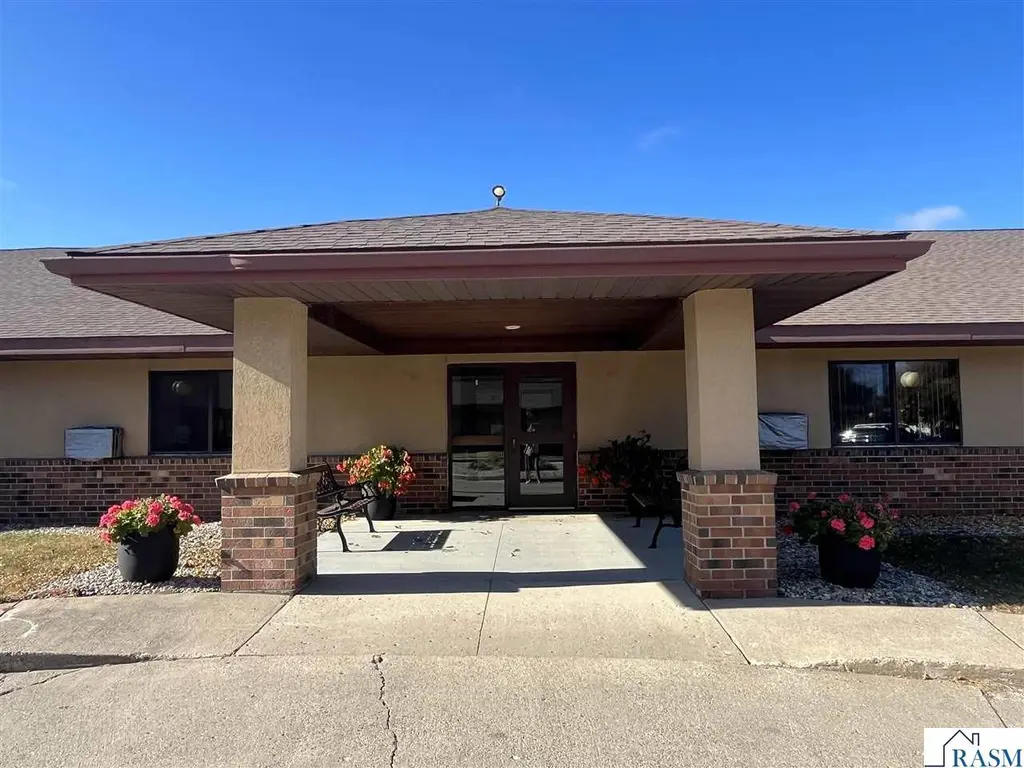
Attractive two-bedroom unit at Homestead Cooperative. This unit has a walk-thru kitchen, dining area, nice sized living room, primary bedroom has a large walk-in closet with organizers, and spacious second bedroom. Homestead Cooperative has many amenities to offer including community room with kitchen, recreation room, exercise room, beauty shop, extra storage area, and an attached garage. Must see to appreciate all the amenities this unit has to offer!
Key facts
- Walk-thru kitchen
- Recreation room
- Walk-in closet
Tags
Neighborhood map
What this means for you Summary
Snapshot
- This is a 2-bed/1.0-bath single-family listed at $72k. Condition is rated average.
Deal economics
- At list price, monthly cash flow is $-469 ($-6k/yr) — negative.
- To cash-flow at today's rent, offer at most $5k (93.7% below list).
- Meets the 1% rule at list price ($825 rent vs $72k).
- Recommended offer: $5k (93.7% below list) — sets the bar for cash-flow.
- Cap rate -1.5% vs local median 3.5% in St. James — below-typical yield; the buyer is paying a premium for something (appreciation thesis, condition, location) that the cap rate doesn't capture.
Location & tenants
- Location reads: area grade D — affects rentability + tenant quality, not the cash-flow math above.
- St. James Public School District (town): math 36% / reading 43% proficiency, ranked #226 of 301 in MN (top 75%) — families likely to look elsewhere, expect single-tenant / working-renter base with shorter leases.
- Zoned schools: St. James Northside Elementary (math 45% / reading 42%, grade F, #569 of 857 statewide, top 67%, 480 students, 66% FRL); St. James Middle/High School (math 29% / reading 43%, grade F, #300 of 471 statewide, top 64%, 551 students, 60% FRL) — zoned schools average 63% FRL vs 43% district-wide (20 pts higher); higher-poverty schools than district average — tighter screening recommended.
- Market conditions: 32 active listings in the ZIP; 1 comparable units currently listed for rent nearby; 4 units permitted in Watonwan County in 2024 (0 in 5+ unit buildings).
Forward outlook
- In year one you build about $7k of equity ($501 loan paydown + $7k appreciation (9.0% local appreciation)).
- Watonwan County population projected to shrink 10% by 2050 — rents likely to lag national; underwrite the cash flow, not the appreciation.
- By year 5, paydown + projected appreciation supports a ~$32k cash-out refi (75% LTV) — recoverable capital for the next deal without selling this one.
Negotiation context
- It's been on market 71 days — a 6% lower offer ($68k) is reasonable based on typical stale-listing flexibility.
Risks & watch-outs
- Watch-outs: HOA is 75% of rent.
Questions for the listing agent
- What do current leases actually rent for vs. the listed asking? Can we see a recent rent roll and the last 12 months of T-12 income?
- It's been on market 71 days. Have you received any prior offers? Is the seller open to a 94% concession, seller financing, or rate buy-down credit?
- What does the HOA fee cover, when was the last increase, and are there any pending special assessments or reserve-fund shortfalls?
- Why hasn't it sold? Are there any deal-killer items the seller is aware of (foundation, flood, title, zoning, code violations)?
- Is there a deadline driving the sale (1031 exchange, divorce, estate, relocation)? That informs how much negotiation room exists.
- The area grade is low — what's the realistic commute time and amenity access for the typical tenant pool here? Any planned neighborhood developments (good or bad) we should know about?
- What's the average days-on-market for RENTAL listings here right now (not sales)? A rising rental-DOM trend means longer vacancies and softer asking-rent achievability than the comps imply.
- What's the recent tenant-quality profile in this submarket — average credit score on applications, eviction rate, late-payment / NSF rate, and stable-employment percentage? A property-management company in the area should have these aggregated.
- How much new for-sale + rental construction is in the pipeline within 1–3 miles? Heavy new supply typically softens prices + rents 12–24 months out; constrained supply supports both.
Investment metrics
- 1% rule
- 1.14% ✓
- Cap rate
- -1.47%
- Cash-on-cash
- -27.74%
- DSCR
- -0.23
- GRM
- 7.3
CMA / ARV
- ARV (median comp)
- $94,900
- List price
- $72,500
- Delta
- -23.60%
- Verdict
- UNDERPRICED
- Comps
- 20 within 1.0 mi
Show comp detail 5 sales within ~0.75 mi
| Address | Dist | Beds/Ba | Sqft | Sold | Price | $/sf | Match |
|---|---|---|---|---|---|---|---|
| 1000 S 9th St #115 | 0.00mi | 2/1.0 | 844 (-4%) | 2mo | $65,000 | $77 | 91 |
| 920 S Armstrong Blvd | 0.22mi | 1/1.0 (-1) | 984 (+11%) | 1mo | $97,850 | $99 | 65 |
| 925 7th Street South St | 0.12mi | 2/1.0 | 952 (+8%) | 21mo | $85,000 | $89 | 64 |
| 217 S 4th Street St | 0.48mi | 2/1.0 | 940 (+6%) | 14mo | $95,200 | $101 | 56 |
| 1003 5th Avenue South Ave | 0.43mi | 2/— | 1,012 (+14%) | 22mo | $120,000 | $119 | 37 |
Match score weights: distance 35% · size 25% · config 20% · recency 20%. Top-matched comps best support the ARV.
Projected returns pro-forma
9.04% appreciation · 3.0% rent growth · sell at horizon
- IRR
- 3.2%
- Equity multiple
- 1.26×
- Total profit
- $5,286
- Equity at exit
- $60,309
- IRR
- 6.7%
- Equity multiple
- 2.92×
- Total profit
- $38,877
- Equity at exit
- $125,076
Cash invested: $20,300 (down + closing). Projections, not guarantees.
Landlord ↔ Tenant lean methodology
- Overall (STATE)
- 46 Balanced
- State Minnesota
- 46 Balanced · D+2
- County
- — inherits STATE
- City
- — inherits STATE
ZIP-level market 56081
- Home prices YoY
- 3.2%
- Active inventory
- 32
- Price-to-rent
- 7.3×
Monthly cashflow live
- Estimated rent
- $825 medium interval (Pro) →
- Mortgage (P&I)
- −$380
- Tax est. 1.5%
- −$91 /mo · $1,088/yr
- Insurance
- −$30
- HOA
- −$620
- Vacancy / Maint / Mgmt
- −$173
- Net cashflow
- $-469
Break-even live
Sensitivity live
| Price | -10% $-419 | -5% $-444 | +0% $-469 | +5% $-494 | +10% $-519 |
|---|---|---|---|---|---|
| Rent | -10% $-534 | -5% $-502 | +0% $-469 | +5% $-437 | +10% $-404 |
| Rate | -1.0pp $-433 | -0.5pp $-451 | base $-469 | +0.5pp $-488 | +1.0pp $-507 |
UW: 25.0% down · 7.5% · 30yr · 1.5% tax · 5.0% vac · 8.0% maint · 8.0% mgmt
Financing live
Cash to close
- Down payment
- $18,125
- Closing costs
- $2,175
- Reserves months
- —
- Total cash needed
- —
Loan-product check · same deal, 3 products live
Conventional
25% down · 7.5% · 30yr
- Down + closing
- —
- Monthly P&I
- —
- Monthly cashflow
- —
- DSCR
- —
- Eligible?
- —
Personal DTI + credit; lowest rate.
DSCR
20% down · 8.5% · 30yr
- Down + closing
- —
- Monthly P&I
- —
- Monthly cashflow
- —
- DSCR
- —
- Eligible?
- —
No personal income docs; deal must DSCR.
Hard money
10% down · 12.0% · 12mo
- Down + closing
- —
- Monthly P&I
- —
- Monthly cashflow
- —
- DSCR
- —
- Eligible?
- —
Short-term bridge; refi at stabilization.
Rent comps 1 comps
| Address | Beds | Baths | Sqft | Rent | $/sqft | DOM | Units | Dist |
|---|---|---|---|---|---|---|---|---|
| 1212 Heckman Ct Unit 1 St James, MN | 1.0 | 1.0 | 1100 | $825 | $0.75 | 45d | 1 | 0.42mi |
HOA detail
- Monthly dues
- $620 · $7,440/yr
Listing history 11 events
-
2026-06-12statusdays on market $72,500 Pending 71 DOM
-
2026-06-09days on market $72,500 Active 68 DOM
-
2026-06-08days on market $72,500 Active 67 DOM
-
2026-06-07days on market $72,500 Active 66 DOM
-
2026-06-05days on market $72,500 Active 64 DOM
-
2026-06-04days on market $72,500 Active 62 DOM
-
2026-06-02days on market $72,500 Active 61 DOM
-
2026-06-01days on market $72,500 Active 60 DOM
-
2026-05-31days on market $72,500 Active 59 DOM
-
2026-05-31days on market $72,500 Active 58 DOM
-
2026-03-31$74,500 Active 457-char remark
Show marketing remark (457 chars)
Attractive two-bedroom unit at Homestead Cooperative. This unit has a walk-thru kitchen, dining area, nice sized living room, primary bedroom has a large walk-in closet with organizers, and spacious second bedroom. Homestead Cooperative has many amenities to offer including community room with kitchen, recreation room, exercise room, beauty shop, extra storage area, and an attached garage. Must see to appreciate all the amenities this unit has to offer!
ⓘ Source: listings_history table (triggers on properties + properties_extension) + one-shot
backfill from property_details.listing_events for pre-trigger history.
Climate risk First Street
- Flood 1/10 Low FEMA zone X (unshaded) · 0% chance over 30 yrs
- Wildfire 1/10 Low
- Heat 2/10 Low 7 d/yr ≥101°F today · 15 d/yr by 30 yrs out
- Wind 2/10 Low
- Air quality 1/10 Low 0 unhealthy d/yr today · 0 by 30 yrs out
Nearby sold comps map
Loading sold comps map…
Walkable amenities ~0.75 mi
Loading nearby amenities…
Taxation est. · year 1
- Rental income
- $9,900
- − Mortgage interest
- −$4,061
- − Property taxes
- −$1,088
- − Insurance
- −$362
- − Repairs & maintenance
- −$792
- − Management
- −$792
- − HOA
- −$7,440
- − Depreciation
- −$2,109
- Taxable loss
- −$6,744
- Est. tax savings @ 24.0%
- +$1,619
- After-tax cash flow
- $-4,013/yr
For passive investors: Depreciation is non-cash, so a rental often shows a tax loss while cash-flowing — sheltering income. Rental losses are passive: they offset passive income freely, and up to $25,000/yr can offset ordinary (W-2) income if you actively participate and your MAGI is under $100k (phasing out to $0 by $150k); unused losses carry forward. On sale, claimed depreciation is recaptured at up to 25%, and gains may owe capital-gains tax (a 1031 exchange can defer both). Figures are a year-1 estimate at your 24.0% rate — not tax advice; consult a CPA.
Condition & rehab AI · 12 photos
This two-bedroom unit at Homestead Cooperative is in average condition with moderate rehab needs. It offers a walk-through kitchen, dining area, and spacious living areas. Updates to the interior walls, ceiling fans, and kitchen and bathroom fixtures would significantly enhance its value and appeal to potential buyers or renters.
Repairs flagged
- Minor kitchen cabinets — slight wear
- Minor kitchen countertops — laminate wear
- Minor bathroom fixtures — standard, no visible damage
Value-add opportunities
- Both paint interior walls — enhances curb appeal and interior aesthetics
- Both replace ceiling fans — modernizes the space and improves air circulation
- Both update kitchen cabinets and countertops — modernizes the kitchen and improves functionality
- Both update bathroom fixtures — modernizes the bathroom and improves functionality
Renovation cost estimate screening
| Repair item | Severity | Est. cost |
|---|---|---|
| kitchen cabinets · slight wear | Minor | $500–3,000 |
| kitchen countertops · laminate wear | Minor | $500–3,000 |
| bathroom fixtures · standard, no visible damage | Minor | $500–3,000 |
| Total estimated repair cost · 3 items | $1,500–9,000 |
Value-add ROI direction
- Both paint interior walls — enhances curb appeal and interior aesthetics ↑
- Both replace ceiling fans — modernizes the space and improves air circulation ↑
- Both update kitchen cabinets and countertops — modernizes the kitchen and improves functionality ↑
- Both update bathroom fixtures — modernizes the bathroom and improves functionality ↑
ⓘ Cost ranges are severity-bucket heuristics (US national rule-of-thumb). Get contractor quotes + a written scope before underwriting a rehab budget.
Schools (NCES district)
- District
- St. James Public School District
- NCES district ID
- 2733600
- Math proficiency
- 36% ▼ -20.00%
- Reading proficiency
- 43% ▼ -14.00%
- Median HH income
- $48,256
- Composite
- 33.89/100
- National rank
- #5345
- State rank
- #226 of 301 in MN
Livability — St. James
No livability data for this city. (Only ~50 U.S. cities are tracked.)
Census & demographics
- Census place
- St. James, MN
- City population
- 6,092
- Population (ZIP)
- 6,092
Population outlook (Watonwan County) Hauer SSP2
- Today (2025)
- 10,579 people
- By 2030
- 10,354 · -2.1%
- By 2040
- 9,923 · -6.2%
- By 2050
- 9,558 · -9.7%
- By 2075
- 9,236 · -12.7%
- By 2100
- 8,812 · -16.7%
Race, ethnicity, and origin ACS 2023
- Neighborhood character
- Majority White (64%)
- Race & ethnicity
- White 64% Hispanic / Latino 35% Two or more races 9%
- Hispanic origin (detail)
- Mexican 25%
- Common ancestry
- Portuguese 15% Italian 1% Romanian 1%
- Foreign-born
- 14% · Canada
- Languages at home
- 71% English-only · Spanish 29%
Political lean MEDSL · Watonwan
- 2024 margin
- Strong R (+27.8) · D 35.1% · R 62.9% · Other 2.0%
- 2008→2024 swing
- -28.5pp toward R · 2008: 0.7pp · 2024: -27.8pp
- All cycles
- 2024: R+27.8 2020: R+21.5 2016: R+19.2 2012: R+0.5 2008: D+0.7
Not yet ingested
- Civics
- —
Market trends
- HPI YoY
- ▲ 9.04%
- Current HPI
- 292.2265
- Rent YoY
- —
- Metro
- —
- State GDP YoY
- ▲ 2.41%
- F500 in state
- 34
Industry mix (Fortune 500 HQ in MN)
| Industry | F500 HQs | Revenue |
|---|---|---|
| Healthcare | 2 | $407B |
|
||
| Retail | 2 | $150B |
|
||
| Consumer Goods | 2 | $32B |
|
||
| Industrial Machinery | 2 | $6B |
|
||
| Agriculture | 1 | $40B |
|
||
| Healthcare / Medical Devices | 1 | $32B |
|
||
Price history
1 event — show timeline
- 2026-03-31 Listed $74,500 RASM
Cash-flow waterfall
monthlySold comps — $/sqft
last 12 mo · ≤1 miLoading sold comps…