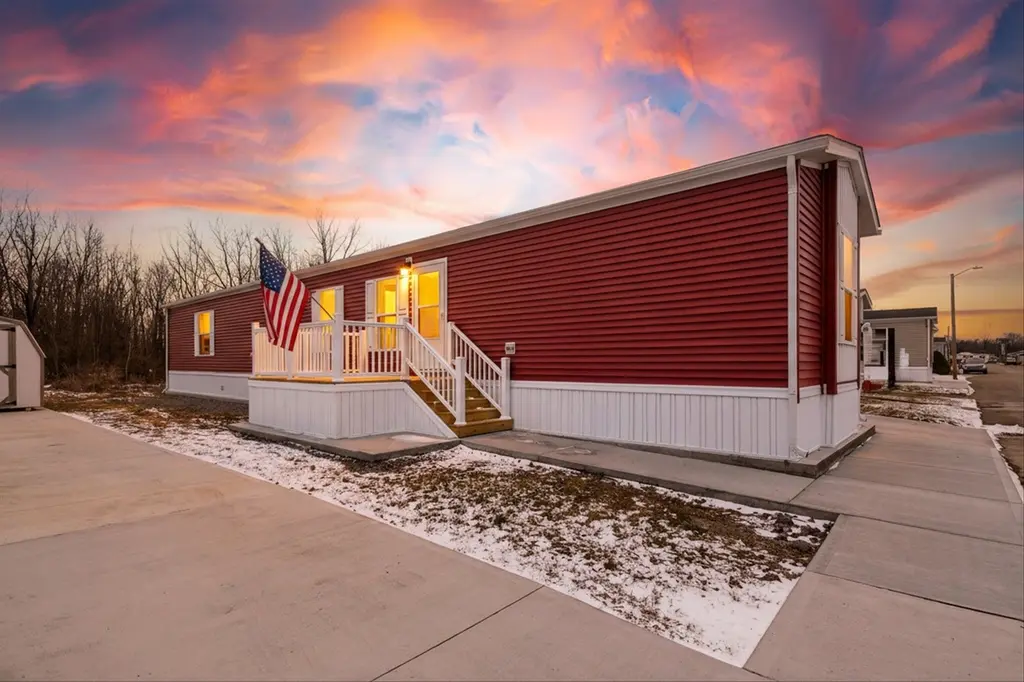
291 Redwood Dr · Marysville, OH
Flood risk 4/10 · Minor
- FEMA flood zone
- X (unshaded)
- Chance of flooding over 30 yrs
- 0.22%
- Est. flood insurance / yr
- $507 – $1,088
Fire risk 1/10 · Minimal
- Est. fire insurance / yr
- $713 – $1,323
Heat risk 3/10 · Minor
- Hot days now (above 99°F)
- 7 days/yr
- Hot days in 30 yrs
- 18 days/yr
Wind risk 2/10 · Minimal
- Chance of severe wind over 30 yrs
- —
Air-quality risk 3/10 · Minor
- Unhealthy air days now
- 2 days/yr
- Unhealthy air days in 30 yrs
- 3 days/yr
Risk factors via First Street. Map © Google.
Why this score? — see what drove the C grade
The composite is a weighted blend of 9 inputs, each scored 0–100. Each bar is that input's sub-score; the figure is the points it added to the 100-point composite (weight × sub-score).
- Cash flow +21.8/30.0
- ARV discount +7.5/15.0
- DSCR +7.0/10.0
- Schools +6.1/10.0
- 1% rule +5.7/10.0
- Condition / age +4.0/5.0
- Livability +3.9/5.0
- Rent growth +2.7/5.0
- Appreciation +0.0/10.0
$136,500
🖨 Deal sheet 📄 Offer letter ✓ Due diligence
Listing remarks MLS
Beautiful 3 bed / 2 bath home
Key facts
- Built 2026
- Listed 132 days
Neighborhood map
What this means for you Summary
Snapshot
- This is a 3-bed/2.0-bath manufactured listed at $136k. Condition is rated good.
Deal economics
- At list price, monthly cash flow is $211 ($3k/yr) — positive.
- The deal already cash-flows at list — no discount required.
- Meets the 1% rule at list price ($1k rent vs $136k).
- Recommended offer: $120k (12.0% below list) — sets the bar for market timing.
- Cap rate 8.1% vs local median 2.2% in Marysville — top-decile yield for the area; either an underpriced asset or a hidden risk that comps aren't pricing in. Stress-test before assuming the spread holds.
Location & tenants
- Location reads 78/100 on livability (#157 in OH, #2,377 nationally) — a middle-class / working-renter tenant base. Strengths: crime A+, employment A+, cost of living A+; Watch: amenities F, commute F.
- Marysville Exempted Village (town): math 67% / reading 73% proficiency, ranked #137 of 656 in OH (top 21%) — strong family-tenant draw, lease renewals of 3-5y typical.
- Market conditions: Rents flat; 222 active listings in the ZIP; 21 comparable units currently listed for rent nearby; rentals leasing fast (median 2d on market — plan ~1-2 weeks tenant-placement turnaround); solid renter incomes; 1,498 units permitted in Union County in 2024 (831 in 5+ unit buildings).
- This rent is only 18% of the median local income ($99k/yr) — well below the 30% rent-burden line; pricing power to push rent on renewal without tenant pushback.
Forward outlook
- Local home prices are declining (-3.0%/yr); year-one equity from $944 of loan paydown is wiped out by about $4k of value loss. Plan a longer hold.
- Union County population projected at +10% by 2050 — modest demand growth; plan on rents tracking national, not racing it.
Negotiation context
- It's been on market 132 days — a 12% lower offer ($120k) is reasonable based on typical stale-listing flexibility.
Questions for the listing agent
- It's been on market 132 days. Have you received any prior offers? Is the seller open to a 12% concession, seller financing, or rate buy-down credit?
- Why hasn't it sold? Are there any deal-killer items the seller is aware of (foundation, flood, title, zoning, code violations)?
- Is there a deadline driving the sale (1031 exchange, divorce, estate, relocation)? That informs how much negotiation room exists.
- Schools are B-rated — typically a magnet for longer-tenancy family renters. What's the average tenant stay here, and is there a school-zone premium baked into asking?
- What's the average days-on-market for RENTAL listings here right now (not sales)? A rising rental-DOM trend means longer vacancies and softer asking-rent achievability than the comps imply.
- What's the recent tenant-quality profile in this submarket — average credit score on applications, eviction rate, late-payment / NSF rate, and stable-employment percentage? A property-management company in the area should have these aggregated.
- How much new for-sale + rental construction is in the pipeline within 1–3 miles? Heavy new supply typically softens prices + rents 12–24 months out; constrained supply supports both.
Investment metrics
- 1% rule
- 1.07% ✓
- Cap rate
- 8.15%
- Cash-on-cash
- 6.63%
- DSCR
- 1.30
- GRM
- 7.8
CMA / ARV
No comps found within radius.
Projected returns pro-forma
-3.0% appreciation · 0.75% rent growth · sell at horizon
- IRR
- -8.7%
- Equity multiple
- 0.69×
- Total profit
- $-11,883
- Equity at exit
- $20,353
- IRR
- -2.4%
- Equity multiple
- 0.85×
- Total profit
- $-5,631
- Equity at exit
- $11,802
Cash invested: $38,220 (down + closing). Projections, not guarantees.
Landlord ↔ Tenant lean methodology
- Overall (STATE)
- 73 Landlord-Friendly
- State Ohio
- 73 Landlord-Friendly · R+6
- County
- — inherits STATE
- City
- — inherits STATE
ZIP-level market 43040
- Rents YoY
- 0.8%
- Active inventory
- 222
- Price-to-rent
- 7.8×
Monthly cashflow live
- Estimated rent
- $1,461 high interval (Pro) →
- Mortgage (P&I)
- −$716
- Tax est. 1.5%
- −$171 /mo · $2,048/yr
- Insurance
- −$57
- HOA
- −$0
- Vacancy / Maint / Mgmt
- −$307
- Net cashflow
- $211
Break-even live
UW: 25.0% down · 7.5% · 30yr · 1.5% tax · 5.0% vac · 8.0% maint · 8.0% mgmt
Financing live
Cash to close
- Down payment
- $34,125
- Closing costs
- $4,095
- Reserves months
- —
- Total cash needed
- —
Loan-product check · same deal, 3 products live
Conventional
25% down · 7.5% · 30yr
- Down + closing
- —
- Monthly P&I
- —
- Monthly cashflow
- —
- DSCR
- —
- Eligible?
- —
Personal DTI + credit; lowest rate.
DSCR
20% down · 8.5% · 30yr
- Down + closing
- —
- Monthly P&I
- —
- Monthly cashflow
- —
- DSCR
- —
- Eligible?
- —
No personal income docs; deal must DSCR.
Hard money
10% down · 12.0% · 12mo
- Down + closing
- —
- Monthly P&I
- —
- Monthly cashflow
- —
- DSCR
- —
- Eligible?
- —
Short-term bridge; refi at stabilization.
Rent comps 21 comps
| Address | Beds | Baths | Sqft | Rent | $/sqft | DOM | Units | Dist |
|---|---|---|---|---|---|---|---|---|
| 548 N Main St Marysville, OH | 2.0–3.0 | 2.0 | 1022 | $1,050 | $1.03 | 1d | 1 | 0.27mi |
| 331 S Walnut St Unit 2nd floor Marysville, OH | 2.0 | 1.0 | 800 | $1,150 | $1.44 | 23d | 1 | 0.56mi |
| 316 W 5th St Marysville, OH | 2.0 | 1.0 | 700 | $950 | $1.36 | 1d | 1 | 0.58mi |
| 316 W 5th St Unit 9 Marysville, OH | 2.0 | 1.0 | 700 | $875 | $1.25 | 1d | 1 | 0.58mi |
| 316 W 5th St Marysville, OH | 2.0 | 1.0 | 700 | $950 | $1.36 | 43d | 1 | 0.58mi |
| 291 Pearlash Rd Marysville, OH | 2.0 | 2.0 | 1223 | $1,834 | $1.50 | 1d | 10 | 0.69mi |
| 1001 Columbus Ave Marysville, OH | 1.0–2.0 | 1.0–2.0 | 775 | $1,466 | $1.89 | 1d | 18 | 0.78mi |
| 650 1/2 Chestnut St Marysville, OH | 2.0 | 1.0 | 1000 | $1,200 | $1.20 | 43d | 1 | 0.81mi |
| 780 Doss DR Marysville, OH | 1.0–2.0 | 1.0–2.0 | 829 | $1,440 | $1.74 | 1d | 34 | 0.94mi |
| 950 Professional Pkwy Marysville, OH | 2.0 | 1.0–2.0 | 812 | $1,655 | $2.04 | 1d | 81 | 0.98mi |
| 722 Collins Ave Unit 722-L Marysville, OH | 2.0 | 1.0 | 780 | $1,099 | $1.41 | 1d | 1 | 1.08mi |
| 201 Professional Pkwy Marysville, OH | 2.0 | 1.0 | 899 | $1,834 | $2.04 | 1d | 1 | 1.08mi |
| 925 W 5th St Marysville, OH | 1.0–2.0 | 1.0 | 812 | $1,204 | $1.48 | 1d | 2 | 1.09mi |
| 259 Honeysuckle Ln Marysville, OH | 2.0 | 2.0 | 1501 | $2,180 | $1.45 | 1d | 8 | 1.15mi |
| 777 Milcrest Dr Unit 779 Marysville, OH | 2.0 | 2.0 | 1000 | $1,350 | $1.35 | 43d | 1 | 1.16mi |
| 777 Milcrest Dr Unit 791 Marysville, OH | 2.0 | 2.0 | 1000 | $1,525 | $1.52 | 1d | 1 | 1.16mi |
| 777 Milcrest Dr Unit 799 Marysville, OH | 2.0 | 2.0 | 1000 | $1,400 | $1.40 | 11d | 1 | 1.16mi |
| 179 Emmaus Rd Marysville, OH | 1.0–2.0 | 1.0–1.5 | 796 | $1,521 | $1.91 | 1d | 7 | 1.21mi |
| 300 Iron Way Marysville, OH | 1.0–2.0 | 1.0–2.0 | 892 | $1,620 | $1.82 | 1d | 24 | 1.27mi |
| 341 Riverwind Dr Marysville, OH | 2.0 | 2.0 | 906 | $1,240 | $1.37 | 1d | 6 | 1.34mi |
| 630 Watkins Glen Blvd Marysville, OH | 1.0–3.0 | 1.0–2.5 | 1009 | $2,585 | $2.56 | 1d | 13 | 1.47mi |
Listing history 15 events
-
2026-06-18days on market $136,500 Active 132 DOM
-
2026-06-17days on market $136,500 Active 131 DOM
-
2026-06-16days on market $136,500 Active 130 DOM
-
2026-06-15days on market $136,500 Active 129 DOM
-
2026-06-13days on market $136,500 Active 127 DOM
-
2026-06-13days on market $136,500 Active 126 DOM
-
2026-06-09days on market $136,500 Active 123 DOM
-
2026-06-08days on market $136,500 Active 122 DOM
-
2026-06-07days on market $136,500 Active 121 DOM
-
2026-06-05days on market $136,500 Active 118 DOM
-
2026-06-03days on market $136,500 Active 117 DOM
-
2026-06-02days on market $136,500 Active 116 DOM
-
2026-06-01days on market $136,500 Active 115 DOM
-
2026-05-31days on market $136,500 Active 114 DOM
-
2026-02-06$136,500 Active 29-char remark
Show marketing remark (29 chars)
Beautiful 3 bed / 2 bath home
ⓘ Source: listings_history table (triggers on properties + properties_extension) + one-shot
backfill from property_details.listing_events for pre-trigger history.
Climate risk First Street
- Flood 4/10 Moderate FEMA zone X (unshaded) · 22% chance over 30 yrs
- Wildfire 1/10 Low
- Heat 3/10 Moderate 7 d/yr ≥99°F today · 18 d/yr by 30 yrs out
- Wind 2/10 Low
- Air quality 3/10 Moderate 2 unhealthy d/yr today · 3 by 30 yrs out
Nearby sold comps map
Loading sold comps map…
Walkable amenities ~0.75 mi
Loading nearby amenities…
Taxation est. · year 1
- Rental income
- $17,537
- − Mortgage interest
- −$7,646
- − Property taxes
- −$2,048
- − Insurance
- −$682
- − Repairs & maintenance
- −$1,403
- − Management
- −$1,403
- − Depreciation
- −$3,971
- Taxable income
- $384
- Est. tax owed @ 24.0%
- −$92
- After-tax cash flow
- $2,442/yr
For passive investors: Depreciation is non-cash, so a rental often shows a tax loss while cash-flowing — sheltering income. Rental losses are passive: they offset passive income freely, and up to $25,000/yr can offset ordinary (W-2) income if you actively participate and your MAGI is under $100k (phasing out to $0 by $150k); unused losses carry forward. On sale, claimed depreciation is recaptured at up to 25%, and gains may owe capital-gains tax (a 1031 exchange can defer both). Figures are a year-1 estimate at your 24.0% rate — not tax advice; consult a CPA.
Condition & rehab AI · 12 photos
This 3-bedroom, 2-bathroom manufactured home is in good condition with a good exterior and interior. It has a good roof, flooring, and HVAC system. The home is move-in ready and has good curb appeal.
Value-add opportunities
- Both Paint exterior trim — Enhances curb appeal and value
- Both Clean gutters — Improves drainage and property value
Renovation cost estimate screening
Value-add ROI direction
- Both Paint exterior trim — Enhances curb appeal and value ↑
- Both Clean gutters — Improves drainage and property value ↑
ⓘ Cost ranges are severity-bucket heuristics (US national rule-of-thumb). Get contractor quotes + a written scope before underwriting a rehab budget.
Schools (NCES district)
- District
- Marysville Exempted Village
- NCES district ID
- 3904547
- Math proficiency
- 67% ▼ -11.00%
- Reading proficiency
- 73% ▼ -5.00%
- Median HH income
- $65,329
- Composite
- 60.81/100
- National rank
- #819
- State rank
- #137 of 656 in OH
Livability — Marysville
- Score
- 78/100
- State rank
- #157
- US rank
- #2377
Category grades
Schools grade is shown separately in the Schools card above.
Census & demographics
- Census place
- Marysville, OH
- County
- Union County · 57,133 people
- City population
- 38,990
- Metro
- Columbus, OH
- Population (ZIP)
- 38,990
- Household income
- $99,321
- Rent vs Own
- Severe rent burden
- 437.0
Population outlook (Union County) Hauer SSP2
- Today (2025)
- 58,316 people
- By 2030
- 60,024 · +2.9%
- By 2040
- 62,846 · +7.8%
- By 2050
- 64,195 · +10.1%
- By 2075
- 65,468 · +12.3%
- By 2100
- 60,748 · +4.2%
Race, ethnicity, and origin ACS 2023
- Neighborhood character
- Predominantly White (88%)
- Race & ethnicity
- White 88% Two or more races 6% Hispanic / Latino 4% Black 2% Asian 1%
- Common ancestry
- Slovak 3% Italian 2% Romanian 2%
- Foreign-born
- 4% · Canada
- Languages at home
- 95% English-only · Spanish 2% Other Asian/Pacific 1% Arabic 1%
Political lean MEDSL · Union
- 2024 margin
- Strong R (+29.6) · D 34.7% · R 64.3% · Other 1.0%
- 2008→2024 swing
- -1.6pp toward R · 2008: -28.0pp · 2024: -29.6pp
- All cycles
- 2024: R+29.6 2020: R+31.5 2016: R+38.0 2012: R+29.7 2008: R+28.0
Not yet ingested
- Civics
- —
Market trends
- HPI YoY
- ▼ -266.67%
- Current HPI
- 237.0968
- Rent YoY
- ▲ 0.75%
- Metro
- Columbus, OH
- State GDP YoY
- ▲ 1.98%
- F500 in state
- 48
Industry mix (Fortune 500 HQ in OH)
| Industry | F500 HQs | Revenue |
|---|---|---|
| Insurance | 3 | $145B |
|
||
| Industrial Machinery | 3 | $49B |
|
||
| Financial Services | 3 | $24B |
|
||
| Consumer Goods | 2 | $93B |
|
||
| Aerospace / Defense | 2 | $47B |
|
||
| Utilities | 2 | $33B |
|
||
Price history
1 event — show timeline
- 2026-02-06 Listed $136,500 Zillow
Cash-flow waterfall
monthlySold comps — $/sqft
last 12 mo · ≤1 miLoading sold comps…