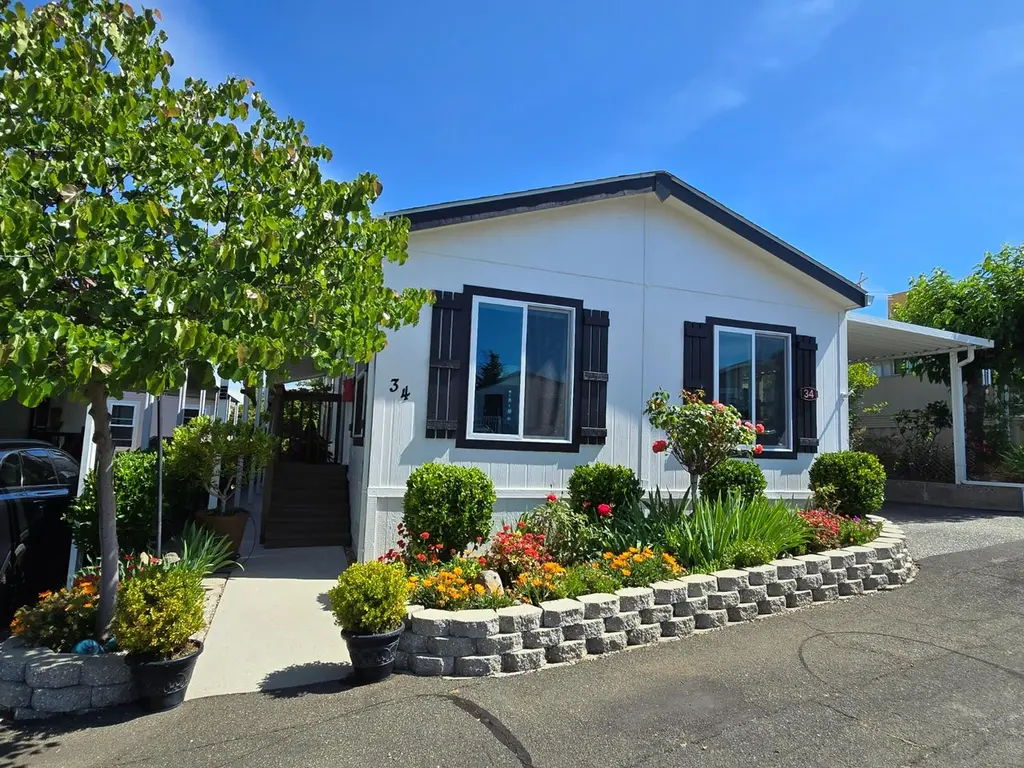
2540 Grass Valley Hwy #34 · North Auburn, CA
Flood risk 1/10 · Minimal
- FEMA flood zone
- X (unshaded)
- Chance of flooding over 30 yrs
- 0.0%
- Est. flood insurance / yr
- $507 – $1,088
Fire risk 10/10 · Severe
- Est. fire insurance / yr
- $659 – $1,223
Heat risk 6/10 · Moderate
- Hot days now (above 99°F)
- 7 days/yr
- Hot days in 30 yrs
- 15 days/yr
Wind risk 1/10 · Minimal
- Chance of severe wind over 30 yrs
- —
Air-quality risk 10/10 · Severe
- Unhealthy air days now
- 34 days/yr
- Unhealthy air days in 30 yrs
- 41 days/yr
Risk factors via First Street. Map © Google.
Why this score? — see what drove the C- grade
The composite is a weighted blend of 9 inputs, each scored 0–100. Each bar is that input's sub-score; the figure is the points it added to the 100-point composite (weight × sub-score).
- Cash flow +24.2/30.0
- DSCR +7.8/10.0
- 1% rule +6.3/10.0
- Schools +4.9/10.0
- Rent growth +3.1/5.0
- Livability +3.1/5.0
- Condition / age +2.5/5.0
- ARV discount +0.0/15.0
- Appreciation +0.0/10.0
$159,900
🖨 Deal sheet 📄 Offer letter ✓ Due diligence
Listing remarks
Pride of ownership shines throughout this exceptional 2016 Fleetwood double-wide, thoughtfully upgraded and meticulously maintained by its original owner. Designed with comfort in mind, nearly every room offers an extra foot of living space beyond standard models, creating an open, spacious feel. Enjoy the benefits of newer south-facing Milgard windows that enhance energy efficiency, reduce outside noise, and provide excellent sun protection. Pleasant neutral paint colors showcase the interior upgrades including Hunter ceiling fans, full mirrored bathroom vanities, newer Whirlpool stainless steel dishwasher and stylish cellular blinds throughout. Outside, impeccable exterior paint and beaut
Key facts
- Covered patios
- Automatic sprinklers
- 3 parking spots
Tags
Property features AI
Finance
- Financial info: Land lease: Yes; amount $825
- HOA & community: No association; Senior community
Exterior
- Parking: Attached covered parking with interior access; Guest parking available
- Utilities: Public water; Public sewer; Natural gas connected; Individual electric and gas meters; 220 volts in kitchen; Cable and internet available
- Home design: Manufactured in park (double wide); Updated/remodeled; Energy Star certified homes
- Construction: Manufactured by Fleetwood (CROWNPOINT XTREME); Wood skirting; Composition roof; Built in 2016
- Exterior features: Patio awning, carport awning and porch awning; Auto sprinkler system front and back; Garden area; Landscaped front and back
Interior
- Kitchen: Free standing gas range; Free standing refrigerator; Hood over range; Dishwasher; Disposal; Microwave; Laminate counters and synthetic counters
- Bedrooms: 2 bedrooms (includes master bedroom)
- Flooring: Carpet; Laminate
- Bathrooms: 2 full bathrooms; Tub with shower over; Low-flow shower(s) and low-flow toilet(s)
- Heating & cooling: Central heating; Central cooling
- Interior features: Cathedral/vaulted living room ceiling; Porch steps and covered patio; Window coverings and screens; Caulked/sealed dual-pane windows with partial low-e glass; Furnished negotiable; Shed(s) on property
- Laundry & utility: Washer and dryer included; Laundry closet located inside
Neighborhood map
What this means for you Summary
Snapshot
- This is a 2-bed/2.0-bath manufactured listed at $160k.
Deal economics
- At list price, monthly cash flow is $320 ($4k/yr) — positive.
- The deal already cash-flows at list — no discount required.
- Meets the 1% rule at list price ($2k rent vs $160k).
- Cap rate 8.7% vs local median 2.6% in North Auburn — top-decile yield for the area; either an underpriced asset or a hidden risk that comps aren't pricing in. Stress-test before assuming the spread holds.
Location & tenants
- Location reads 61/100 on livability (#519 in CA) — a middle-class / working-renter tenant base. Strengths: employment A-, housing A-; Watch: schools F, crime D-, amenities F.
- Placer Union High (suburban): math 39% / reading 72% proficiency, ranked #98 of 517 in CA (top 19%) — acceptable for families but not a draw, mixed tenant base, ~2y average lease.
- Market conditions: Rents rising (+2.3%/yr); 204 active listings in the ZIP; 10 comparable units currently listed for rent nearby; rentals leasing fast (median 7d on market — plan ~1-2 weeks tenant-placement turnaround); solid renter incomes; 3,535 units permitted in Placer County in 2024 (689 in 5+ unit buildings).
Forward outlook
- Local home prices are declining (-3.0%/yr); year-one equity from $1k of loan paydown is wiped out by about $5k of value loss. Plan a longer hold.
- Placer County population projected at +20% by 2050 — long-run rental-demand tailwind backs the buy-and-hold thesis.
Negotiation context
- Only 9 days on market — expect competitive offers; lowballing is unlikely to land.
Risks & watch-outs
- Climate carrying-cost: severe wildfire risk; extreme-heat days projected 7→15/yr by 2055 (HVAC capex compounding) — expect insurance premiums to compound above CPI over the hold.
Questions for the listing agent
- Is there a deadline driving the sale (1031 exchange, divorce, estate, relocation)? That informs how much negotiation room exists.
- Schools are F-rated, which usually means shorter tenancies and higher turnover. Who's the typical renter profile here, and what's been the actual vacancy rate?
- Crime grade is D in this area — have there been break-ins, vandalism, or insurance claims at this property in the last 3 years? What carrier currently insures it and at what premium?
- What's the average days-on-market for RENTAL listings here right now (not sales)? A rising rental-DOM trend means longer vacancies and softer asking-rent achievability than the comps imply.
- What's the recent tenant-quality profile in this submarket — average credit score on applications, eviction rate, late-payment / NSF rate, and stable-employment percentage? A property-management company in the area should have these aggregated.
- How much new for-sale + rental construction is in the pipeline within 1–3 miles? Heavy new supply typically softens prices + rents 12–24 months out; constrained supply supports both.
Investment metrics
- 1% rule
- 1.13% ✓
- Cap rate
- 8.69%
- Cash-on-cash
- 8.57%
- DSCR
- 1.38
- GRM
- 7.4
CMA / ARV
- ARV (on-the-fly)
- $110,400
- Comps found
- 8
Show comp detail 8 sales within ~0.75 mi
| Address | Dist | Beds/Ba | Sqft | Sold | Price | $/sf | Match |
|---|---|---|---|---|---|---|---|
| 2540 Grass Valley Hwy #18 | 0.00mi | 2/2.0 | 960 (0%) | 1mo | $131,000 | $136 | 99 |
| 2540 Grass Valley Hwy #112 | 0.00mi | 2/2.0 | 840 (-12%) | 5mo | $80,000 | $95 | 75 |
| 2540 Grass Valley Hwy #12 | 0.30mi | 2/2.0 | 1,026 (+7%) | 3mo | $115,000 | $112 | 72 |
| 2540 Grass Valley Hwy #27 | 0.30mi | 2/2.0 | 1,040 (+8%) | 2mo | $92,000 | $88 | 70 |
| 2540 Grass Valley Hwy #51 | 0.00mi | 2/1.0 | 840 (-12%) | 13mo | $72,000 | $86 | 64 |
| 2540 Grass Valley Hwy #75 | 0.30mi | 2/2.0 | 1,060 (+10%) | 6mo | $157,000 | $148 | 63 |
| 2540 Grass Valley Hwy #133 | 0.30mi | 2/2.0 | 840 (-12%) | 6mo | $97,000 | $115 | 60 |
| 2540 Grass Valley Hwy #17 | 0.30mi | 2/2.0 | 1,000 (+4%) | 24mo | $165,000 | $165 | 59 |
Match score weights: distance 35% · size 25% · config 20% · recency 20%. Top-matched comps best support the ARV.
Projected returns pro-forma
-3.0% appreciation · 2.34% rent growth · sell at horizon
- IRR
- -4.0%
- Equity multiple
- 0.85×
- Total profit
- $-6,704
- Equity at exit
- $23,842
- IRR
- 4.9%
- Equity multiple
- 1.35×
- Total profit
- $15,682
- Equity at exit
- $13,825
Cash invested: $44,772 (down + closing). Projections, not guarantees.
Landlord ↔ Tenant lean methodology
- Overall (STATE)
- 18 Strongly Tenant-Friendly
- State California
- 18 Strongly Tenant-Friendly · D+13
- County
- — inherits STATE
- City
- — inherits STATE
ZIP-level market 95603
- Rents YoY
- 2.3%
- Active inventory
- 204
- Price-to-rent
- 7.4×
Monthly cashflow live
- Estimated rent
- $1,804 high interval (Pro) →
- Mortgage (P&I)
- −$839
- Tax est. 1.5%
- −$200 /mo · $2,398/yr
- Insurance
- −$67
- HOA
- −$0
- Vacancy / Maint / Mgmt
- −$379
- Net cashflow
- $320
Break-even live
UW: 25.0% down · 7.5% · 30yr · 1.5% tax · 5.0% vac · 8.0% maint · 8.0% mgmt
Financing live
Cash to close
- Down payment
- $39,975
- Closing costs
- $4,797
- Reserves months
- —
- Total cash needed
- —
Loan-product check · same deal, 3 products live
Conventional
25% down · 7.5% · 30yr
- Down + closing
- —
- Monthly P&I
- —
- Monthly cashflow
- —
- DSCR
- —
- Eligible?
- —
Personal DTI + credit; lowest rate.
DSCR
20% down · 8.5% · 30yr
- Down + closing
- —
- Monthly P&I
- —
- Monthly cashflow
- —
- DSCR
- —
- Eligible?
- —
No personal income docs; deal must DSCR.
Hard money
10% down · 12.0% · 12mo
- Down + closing
- —
- Monthly P&I
- —
- Monthly cashflow
- —
- DSCR
- —
- Eligible?
- —
Short-term bridge; refi at stabilization.
Rent comps 10 comps
| Address | Beds | Baths | Sqft | Rent | $/sqft | DOM | Units | Dist |
|---|---|---|---|---|---|---|---|---|
| 11754 Jones St Unit 11754 Auburn, CA | 1.0 | 1.0 | 700 | $1,595 | $2.28 | 3d | 1 | 0.21mi |
| 11752 Jones St Unit 11752 Auburn, CA | 2.0 | 1.0 | 815 | $1,795 | $2.20 | 10d | 1 | 0.21mi |
| 11700 Garnet Way #4 Auburn, CA | 2.0 | 1.0 | 840 | $1,695 | $2.02 | 17d | 1 | 0.64mi |
| 11550 Garnet Way #2 Auburn, CA | 2.0 | 1.5 | 966 | $1,725 | $1.79 | 7d | 1 | 0.74mi |
| 3585 Sapphire Dr #4 Auburn, CA | 2.0 | 1.0 | 900 | $1,375 | $1.53 | 1d | 1 | 0.75mi |
| 3633 Park Dr #2 Auburn, CA | 2.0 | 1.0 | 922 | $1,699 | $1.84 | 1d | 1 | 0.79mi |
| 3713 Park Dr #4 Auburn, CA | 1.0 | 1.0 | 900 | $1,675 | $1.86 | 11d | 1 | 0.88mi |
| 3681 Galena Dr #2 Auburn, CA | 2.0 | 1.5 | 991 | $1,800 | $1.82 | 7d | 1 | 0.92mi |
| 3711 Galena Dr #3 Auburn, CA | 2.0 | 1.5 | 991 | $1,850 | $1.87 | 1d | 1 | 0.94mi |
| 11325 Quartz Dr Auburn, CA | 1.0–2.0 | 1.0 | 775 | $2,069 | $2.67 | 1d | 10 | 0.96mi |
Listing history 7 events
-
2026-06-13statusdays on market $159,900 Pending 9 DOM
-
2026-06-09days on market $159,900 Active 8 DOM
-
2026-06-08days on market $159,900 Active 7 DOM
-
2026-06-07days on market $159,900 Active 6 DOM
-
2026-06-03days on market $159,900 Active 2 DOM
-
2026-06-01remarks 699-char remark
-
2026-06-01$159,900 Active 1 DOM
ⓘ Source: listings_history table (triggers on properties + properties_extension) + one-shot
backfill from property_details.listing_events for pre-trigger history.
Climate risk First Street
- Flood 1/10 Low FEMA zone X (unshaded) · 0% chance over 30 yrs
- Wildfire 10/10 Extreme
- Heat 6/10 Major 7 d/yr ≥99°F today · 15 d/yr by 30 yrs out
- Wind 1/10 Low
- Air quality 10/10 Extreme 34 unhealthy d/yr today · 41 by 30 yrs out
Nearby sold comps map
Loading sold comps map…
Walkable amenities ~0.75 mi
Loading nearby amenities…
Taxation est. · year 1
- Rental income
- $21,643
- − Mortgage interest
- −$8,957
- − Property taxes
- −$2,398
- − Insurance
- −$800
- − Repairs & maintenance
- −$1,731
- − Management
- −$1,731
- − Depreciation
- −$4,652
- Taxable income
- $1,374
- Est. tax owed @ 24.0%
- −$330
- After-tax cash flow
- $3,508/yr
For passive investors: Depreciation is non-cash, so a rental often shows a tax loss while cash-flowing — sheltering income. Rental losses are passive: they offset passive income freely, and up to $25,000/yr can offset ordinary (W-2) income if you actively participate and your MAGI is under $100k (phasing out to $0 by $150k); unused losses carry forward. On sale, claimed depreciation is recaptured at up to 25%, and gains may owe capital-gains tax (a 1031 exchange can defer both). Figures are a year-1 estimate at your 24.0% rate — not tax advice; consult a CPA.
Schools (NCES district)
- District
- Placer Union High
- NCES district ID
- 0630750
- Math proficiency
- 39% ▲ 1.00%
- Reading proficiency
- 72% ▲ 3.00%
- Median HH income
- $69,119
- Composite
- 49.04/100
- National rank
- #2060
- State rank
- #98 of 517 in CA
Livability — North Auburn
- Score
- 61/100
- State rank
- #519
- US rank
- #17512
Category grades
Schools grade is shown separately in the Schools card above.
Census & demographics
- Census place
- North Auburn, CA
- County
- Placer County · 390,510 people
- City population
- 28,195
- Metro
- Sacramento-Roseville-Folsom, CA
- Population (ZIP)
- 28,432
- Household income
- $85,357
- Rent vs Own
- Severe rent burden
- 1017.0
Population outlook (Placer County) Hauer SSP2
- Today (2025)
- 422,709 people
- By 2030
- 444,249 · +5.1%
- By 2040
- 480,192 · +13.6%
- By 2050
- 506,390 · +19.8%
- By 2075
- 550,219 · +30.2%
- By 2100
- 547,760 · +29.6%
Race, ethnicity, and origin ACS 2023
- Neighborhood character
- Predominantly White (73%)
- Race & ethnicity
- White 73% Hispanic / Latino 17% Two or more races 11% Asian 3%
- Hispanic origin (detail)
- Mexican 12%
- Common ancestry
- Italian 3% Slovak 3% Lithuanian 2%
- Foreign-born
- 9% · Canada, South Korea
- Languages at home
- 88% English-only · Spanish 10% Other Indo-European 1% Tagalog/Filipino 1%
Political lean MEDSL · Placer
- 2024 margin
- Lean R (+8.5) · D 44.3% · R 52.8% · Other 2.9%
- 2008→2024 swing
- +2.8pp toward D · 2008: -11.3pp · 2024: -8.5pp
- All cycles
- 2024: R+8.5 2020: R+6.7 2016: R+11.3 2012: R+20.1 2008: R+11.3
Not yet ingested
- Civics
- —
Market trends
- HPI YoY
- ▼ -500.89%
- Current HPI
- 251.4573
- Rent YoY
- ▲ 2.34%
- Metro
- Sacramento-Roseville-Folsom, CA
- State GDP YoY
- ▲ 3.21%
- F500 in state
- 116
Industry mix (Fortune 500 HQ in CA)
| Industry | F500 HQs | Revenue |
|---|---|---|
| Technology | 27 | $1,492B |
|
||
| Financial Services | 3 | $174B |
|
||
| Retail | 3 | $44B |
|
||
| Insurance | 3 | $26B |
|
||
| Media / Entertainment | 2 | $115B |
|
||
| Pharmaceuticals / Biotech | 2 | $62B |
|
||
Cash-flow waterfall
monthlySold comps — $/sqft
last 12 mo · ≤1 miLoading sold comps…