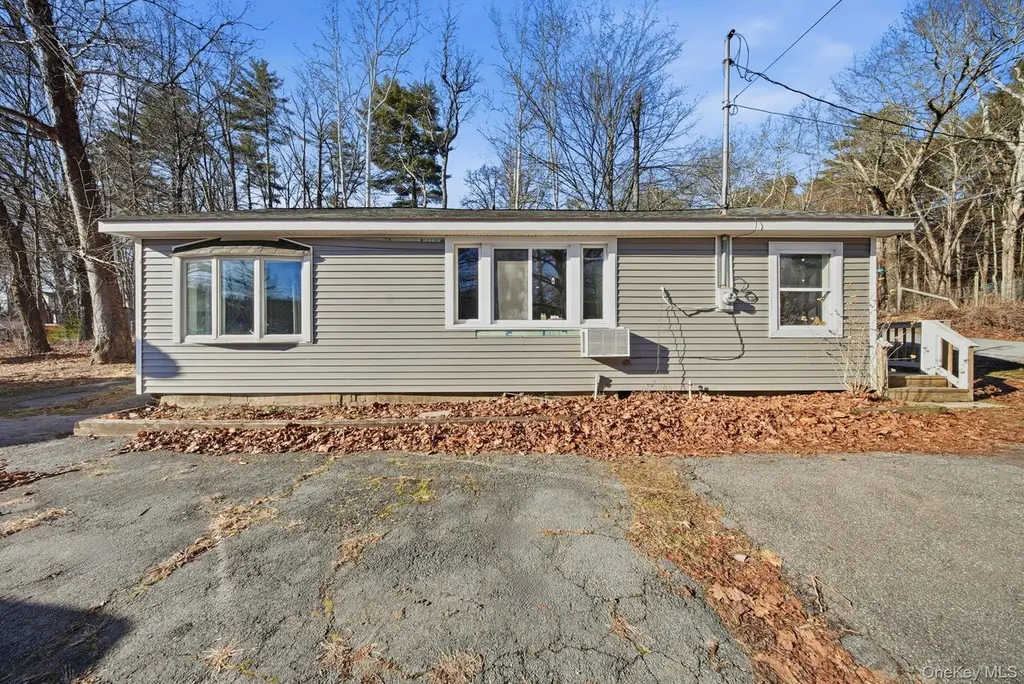
4 Old Rd · Otisville, NY
Flood risk 8/10 · Major
- FEMA flood zone
- X (unshaded)
- Chance of flooding over 30 yrs
- 0.99%
- Est. flood insurance / yr
- $507 – $1,088
Fire risk 3/10 · Minor
- Est. fire insurance / yr
- $691 – $1,283
Heat risk 4/10 · Minor
- Hot days now (above 96°F)
- 7 days/yr
- Hot days in 30 yrs
- 17 days/yr
Wind risk 3/10 · Minor
- Chance of severe wind over 30 yrs
- 7.0%
Air-quality risk 2/10 · Minimal
- Unhealthy air days now
- 1 days/yr
- Unhealthy air days in 30 yrs
- 2 days/yr
Risk factors via First Street. Map © Google.
Why this score? — see what drove the B grade
The composite is a weighted blend of 9 inputs, each scored 0–100. Each bar is that input's sub-score; the figure is the points it added to the 100-point composite (weight × sub-score).
- Cash flow +25.6/30.0
- ARV discount +15.0/15.0
- DSCR +8.5/10.0
- 1% rule +6.6/10.0
- Appreciation +5.0/10.0
- Schools +3.9/10.0
- Livability +3.5/5.0
- Rent growth +2.5/5.0
- Condition / age +2.5/5.0
$229,999
🖨 Deal sheet 📄 Offer letter ✓ Due diligence
Listing remarks MLS
Welcome to 4 Old Road in the quiet charm of Cuddebackville—this cozy, updated cutie proves good things do come in smaller packages. This 2-bed, 1-bath home has been refreshed so you can move right in without lifting more than a finger… Featuring a garage to keep your car safe from the weather (or to store all the hobbies you swear you’ll pick up someday), plus a bonus: there’s even room on the property for an addition if you ever feel like spreading out. Starter home? Downsizing? Savvy investment to pad that portfolio? Yes, yes, and absolutely yes. This home checks boxes you didn’t even know you had. Clean, cute, updated, and flexible… honestly, what more could you want?
Key facts
- 0.27 acre lot
- Garage
- Built 1930
Neighborhood map
What this means for you Summary
Snapshot
- This is a 4-bed/1.0-bath single-family listed at $230k.
Deal economics
- At list price, monthly cash flow is $476 ($6k/yr) — positive.
- The deal already cash-flows at list — no discount required.
- Meets the 1% rule at list price ($3k rent vs $230k).
- Recommended offer: $209k (9.0% below list) — sets the bar for market timing.
- Cap rate 9.1% vs local median 2.4% in Otisville — top-decile yield for the area; either an underpriced asset or a hidden risk that comps aren't pricing in. Stress-test before assuming the spread holds.
Location & tenants
- Location reads 70/100 on livability (#459 in NY) — a middle-class / working-renter tenant base. Strengths: employment A+, housing A+, crime A; Watch: schools D+, amenities F, commute F.
- Port Jervis City School District (rural): math 43% / reading 50% proficiency, ranked #451 of 590 in NY (top 76%) — families likely to look elsewhere, expect single-tenant / working-renter base with shorter leases.
- Market conditions: 20 active listings in the ZIP; 1,746 units permitted in Orange County in 2024 (1,265 in 5+ unit buildings).
Forward outlook
- In year one you build about $2k of equity ($2k loan paydown + $146 appreciation (0.1% local appreciation)).
- At projected returns (0.1% appreciation + 3.0% rent growth), your $64k cash investment doubles in ~7 years — after that, you're playing with house money.
Negotiation context
- It's been on market 105 days — a 9% lower offer ($209k) is reasonable based on typical stale-listing flexibility.
- 17 sale attempts since 10y ago; this cycle's ask is 13429% above the opening price — seller raised mid-cycle; expect resistance to lowballs.
- Current owner paid $60k; list at $230k implies a 283% gain — meaningful room to come down on a strong offer.
Risks & watch-outs
- Watch-outs: flood insurance adds $66/mo; built in 1930 — expect roof / HVAC / electrical / plumbing capex.
- Climate carrying-cost: severe flood risk — expect insurance premiums to compound above CPI over the hold.
Questions for the listing agent
- It's been on market 105 days. Have you received any prior offers? Is the seller open to a 9% concession, seller financing, or rate buy-down credit?
- Built in 1930 — when were the roof, HVAC, electrical panel, plumbing, and water heater last replaced?
- What's the actual annual flood-insurance premium (NFIP or private), and is the property in a SFHA with mandatory coverage?
- Why hasn't it sold? Are there any deal-killer items the seller is aware of (foundation, flood, title, zoning, code violations)?
- Is there a deadline driving the sale (1031 exchange, divorce, estate, relocation)? That informs how much negotiation room exists.
- Schools are D-rated, which usually means shorter tenancies and higher turnover. Who's the typical renter profile here, and what's been the actual vacancy rate?
- What's the average days-on-market for RENTAL listings here right now (not sales)? A rising rental-DOM trend means longer vacancies and softer asking-rent achievability than the comps imply.
- What's the recent tenant-quality profile in this submarket — average credit score on applications, eviction rate, late-payment / NSF rate, and stable-employment percentage? A property-management company in the area should have these aggregated.
- How much new for-sale + rental construction is in the pipeline within 1–3 miles? Heavy new supply typically softens prices + rents 12–24 months out; constrained supply supports both.
Investment metrics
- 1% rule
- 1.16% ✓
- Cap rate
- 9.13%
- Cash-on-cash
- 10.12%
- DSCR
- 1.45
- GRM
- 7.2
CMA / ARV
- ARV (median comp)
- $302,904
- List price
- $229,999
- Delta
- -24.07%
- Verdict
- UNDERPRICED
- Comps
- 6 within 1.0 mi
Show comp detail 2 sales within ~0.75 mi
| Address | Dist | Beds/Ba | Sqft | Sold | Price | $/sf | Match |
|---|---|---|---|---|---|---|---|
| 12 Old Rd | 0.04mi | 3/2.0 (-1) | 1,173 (-4%) | 23mo | $42,000 | $36 | 63 |
| 1554 US Route 209 | 0.41mi | 3/2.0 (-1) | 1,176 (-4%) | 24mo | $335,000 | $285 | 46 |
Match score weights: distance 35% · size 25% · config 20% · recency 20%. Top-matched comps best support the ARV.
Projected returns pro-forma
0.06% appreciation · 3.0% rent growth · sell at horizon
- IRR
- 7.9%
- Equity multiple
- 1.38×
- Total profit
- $24,379
- Equity at exit
- $67,517
- IRR
- 12.9%
- Equity multiple
- 2.42×
- Total profit
- $91,549
- Equity at exit
- $81,745
Cash invested: $64,400 (down + closing). Projections, not guarantees.
Landlord ↔ Tenant lean methodology
- Overall (STATE)
- 15 Strongly Tenant-Friendly
- State New York
- 15 Strongly Tenant-Friendly · D+10
- County
- — inherits STATE
- City
- — inherits STATE
ZIP-level market 12729
- Home prices YoY
- 0.0%
- Active inventory
- 20
- Price-to-rent
- 7.2×
Monthly cashflow live
- Estimated rent
- $2,679 medium interval (Pro) →
- Mortgage (P&I)
- −$1,206
- Tax from tax record
- −$272 /mo · $3,260/yr
- Insurance
- −$96
- Flood insurance flood zone
- −$66 /mo · $798/yr
- HOA
- −$0
- Vacancy / Maint / Mgmt
- −$563
- Net cashflow
- $476
Break-even live
UW: 25.0% down · 7.5% · 30yr · 1.5% tax · 5.0% vac · 8.0% maint · 8.0% mgmt
Financing live
Cash to close
- Down payment
- $57,500
- Closing costs
- $6,900
- Reserves months
- —
- Total cash needed
- —
Loan-product check · same deal, 3 products live
Conventional
25% down · 7.5% · 30yr
- Down + closing
- —
- Monthly P&I
- —
- Monthly cashflow
- —
- DSCR
- —
- Eligible?
- —
Personal DTI + credit; lowest rate.
DSCR
20% down · 8.5% · 30yr
- Down + closing
- —
- Monthly P&I
- —
- Monthly cashflow
- —
- DSCR
- —
- Eligible?
- —
No personal income docs; deal must DSCR.
Hard money
10% down · 12.0% · 12mo
- Down + closing
- —
- Monthly P&I
- —
- Monthly cashflow
- —
- DSCR
- —
- Eligible?
- —
Short-term bridge; refi at stabilization.
Listing history 50 events
-
2026-06-18days on market $229,999 Active 105 DOM
-
2026-06-17days on market $229,999 Active 104 DOM
-
2026-06-16pricedays on market $229,999 Active 103 DOM
-
2026-06-15days on market $239,000 Active 102 DOM
-
2026-06-14days on market $239,000 Active 100 DOM
-
2026-06-13days on market $239,000 Active 99 DOM
-
2026-06-10days on market $239,000 Active 97 DOM
-
2026-06-09days on market $239,000 Active 96 DOM
-
2026-06-08days on market $239,000 Active 95 DOM
-
2026-06-07days on market $239,000 Active 94 DOM
-
2026-06-03days on market $239,000 Active 90 DOM
-
2026-06-02days on market $239,000 Active 89 DOM
-
2026-06-01days on market $239,000 Active 88 DOM
-
2026-05-31days on market $239,000 Active 87 DOM
-
2026-05-30days on market $239,000 Active 86 DOM
-
2026-05-01historical $1,900
-
2026-04-10price $1,900
-
2026-03-15$1,700
-
2026-03-04$239,000 Active 718-char remark
Show marketing remark (718 chars)
Welcome to 4 Old Road in the quiet charm of Cuddebackville—this cozy, updated cutie proves good things do come in smaller packages. This 2-bed, 1-bath home has been refreshed so you can move right in without lifting more than a finger… Featuring a garage to keep your car safe from the weather (or to store all the hobbies you swear you’ll pick up someday), plus a bonus: there’s even room on the property for an addition if you ever feel like spreading out. Starter home? Downsizing? Savvy investment to pad that portfolio? Yes, yes, and absolutely yes. This home checks boxes you didn’t even know you had. Clean, cute, updated, and flexible… honestly, what more could you want?
-
2026-03-04historical
Show marketing remark (718 chars)
Welcome to 4 Old Road in the quiet charm of Cuddebackville—this cozy, updated cutie proves good things do come in smaller packages. This 2-bed, 1-bath home has been refreshed so you can move right in without lifting more than a finger… Featuring a garage to keep your car safe from the weather (or to store all the hobbies you swear you’ll pick up someday), plus a bonus: there’s even room on the property for an addition if you ever feel like spreading out. Starter home? Downsizing? Savvy investment to pad that portfolio? Yes, yes, and absolutely yes. This home checks boxes you didn’t even know you had. Clean, cute, updated, and flexible… honestly, what more could you want?
-
2026-02-09status Active
-
2026-02-09price $239,000
-
2026-02-06historical
-
2025-12-22$249,900 Active
-
2024-02-02historical
-
2024-02-02historical
-
2022-08-22soldstatus $60,000
-
2018-07-12historical
-
2018-07-06price $19,000
-
2018-06-18price $29,900
-
2018-05-29$34,900 Active
-
2018-05-10historical
-
2018-04-11historical
-
2018-04-11$36,900
-
2018-04-11$36,900 Active
-
2018-03-07$36,900
-
2018-03-07$36,900
-
2018-03-07$36,900 Active
-
2018-03-01historical
-
2018-01-08price $36,900
-
2017-12-06price $40,000
-
2017-10-31historical
-
2017-10-31status Active
-
2017-10-31historical
-
2017-10-31$44,900 Active
-
2017-10-30$36,900
-
2017-10-06price $49,900
-
2017-09-05price $54,900
-
2017-07-28$59,900 Active
-
2017-07-27$49,900
ⓘ Source: listings_history table (triggers on properties + properties_extension) + one-shot
backfill from property_details.listing_events for pre-trigger history.
Tax reassessment forecast NY · Partial reset (capped growth)
- Current annual tax
- $3,260 · $272/mo
- Projected year-2 tax
- $3,574 · $298/mo
- Expected delta
- +$313/yr (+$26/mo · 9.6%)
ⓘ Screening estimate from a state-policy table — verify with the county assessor before closing.
Climate risk First Street
- Flood 8/10 Severe FEMA zone X (unshaded) · 99% chance over 30 yrs
- Wildfire 3/10 Moderate
- Heat 4/10 Moderate 7 d/yr ≥96°F today · 17 d/yr by 30 yrs out
- Wind 3/10 Moderate 7% chance of damaging wind over 30 yrs
- Air quality 2/10 Low 1 unhealthy d/yr today · 2 by 30 yrs out
Nearby sold comps map
Loading sold comps map…
Walkable amenities ~0.75 mi
Loading nearby amenities…
Taxation est. · year 1
- Rental income
- $32,151
- − Mortgage interest
- −$12,884
- − Property taxes
- −$3,260
- − Insurance
- −$1,947
- − Repairs & maintenance
- −$2,572
- − Management
- −$2,572
- − Depreciation
- −$6,691
- Taxable income
- $2,224
- Est. tax owed @ 24.0%
- −$534
- After-tax cash flow
- $5,184/yr
For passive investors: Depreciation is non-cash, so a rental often shows a tax loss while cash-flowing — sheltering income. Rental losses are passive: they offset passive income freely, and up to $25,000/yr can offset ordinary (W-2) income if you actively participate and your MAGI is under $100k (phasing out to $0 by $150k); unused losses carry forward. On sale, claimed depreciation is recaptured at up to 25%, and gains may owe capital-gains tax (a 1031 exchange can defer both). Figures are a year-1 estimate at your 24.0% rate — not tax advice; consult a CPA.
Schools (NCES district)
- District
- Port Jervis City School District
- NCES district ID
- 3623520
- Math proficiency
- 43% ▼ -7.00%
- Reading proficiency
- 50% ▲ 5.00%
- Median HH income
- $44,506
- Composite
- 39.33/100
- National rank
- #3984
- State rank
- #451 of 590 in NY
Livability — Otisville
- Score
- 70/100
- State rank
- #459
- US rank
- #7992
Category grades
Schools grade is shown separately in the Schools card above.
Census & demographics
- City population
- 3,940
- Population (ZIP)
- 1,307
Population outlook (Orange County) Hauer SSP2
- Today (2025)
- 379,830 people
- By 2030
- 378,955 · -0.2%
- By 2040
- 375,444 · -1.2%
- By 2050
- 369,311 · -2.8%
- By 2075
- 354,233 · -6.7%
- By 2100
- 318,150 · -16.2%
Race, ethnicity, and origin ACS 2023
- Neighborhood character
- Diverse neighborhood (Simpson 0.61)
- Race & ethnicity
- White 59% Black 14% Asian 12% Hispanic / Latino 9% Two or more races 6%
- Hispanic origin (detail)
- Puerto Rican 9%
- Common ancestry
- Hispanic 13% Romanian 6% Iranian 5%
- Foreign-born
- 16% · China
- Languages at home
- 80% English-only · Chinese 11% Spanish 4% French/Haitian/Cajun 3%
Political lean MEDSL · Orange
- 2024 margin
- Lean R (+8.4) · D 45.8% · R 54.2%
- 2008→2024 swing
- -12.5pp toward R · 2008: 4.1pp · 2024: -8.4pp
- All cycles
- 2024: R+8.4 2020: R+0.2 2016: R+6.5 2012: D+5.2 2008: D+4.1
Not yet ingested
- Civics
- —
Market trends
- HPI YoY
- ▲ 0.06%
- Current HPI
- 341.1758
- Rent YoY
- —
- Metro
- —
- State GDP YoY
- ▲ 2.60%
- F500 in state
- 92
Industry mix (Fortune 500 HQ in NY)
| Industry | F500 HQs | Revenue |
|---|---|---|
| Financial Services | 10 | $950B |
|
||
| Consumer Goods | 9 | $162B |
|
||
| Insurance | 4 | $225B |
|
||
| Telecommunications | 2 | $144B |
|
||
| Pharmaceuticals | 2 | $112B |
|
||
| Media / Entertainment | 2 | $69B |
|
||
Price history
-98.6% since first listed41 events — show timeline
- 2026-05-01 Rental Removed $1,900 ONEKEY
- 2026-04-10 Price Changed $1,900 ONEKEY
- 2026-03-15 Listed for Rent $1,700 ONEKEY
- 2026-03-04 Listing Removed — OneKey® MLS as Distributed by MLS Grid
- 2026-03-04 Listed $239,000 OneKey® MLS as Distributed by MLS Grid
- 2026-02-09 Relisted — OneKey® MLS as Distributed by MLS Grid
- 2026-02-09 Price Changed $239,000 OneKey® MLS as Distributed by MLS Grid
- 2026-02-06 Listing Removed — OneKey® MLS as Distributed by MLS Grid
- 2025-12-22 Listed $249,900 OneKey® MLS as Distributed by MLS Grid
- 2024-02-02 Listing Removed — OneKey® MLS as Distributed by MLS Grid
- 2024-02-02 Listing Removed — OneKey® MLS as Distributed by MLS Grid
- 2022-08-22 Sold (Public Records) $60,000 Public Records
- 2018-07-12 Listing Removed — OneKey® MLS as Distributed by MLS Grid
- 2018-07-06 Price Changed $19,000 OneKey® MLS as Distributed by MLS Grid
- 2018-06-18 Price Changed $29,900 OneKey® MLS as Distributed by MLS Grid
- 2018-05-29 Listed $34,900 OneKey® MLS as Distributed by MLS Grid
- 2018-05-10 Listing Removed — OneKey® MLS as Distributed by MLS Grid
- 2018-04-11 Listing Removed — OneKey® MLS as Distributed by MLS Grid
- 2018-04-11 Listed $36,900 OneKey® MLS as Distributed by MLS Grid
- 2018-04-11 Listed $36,900 HVCRMLS
- 2018-03-07 Listed $36,900 OneKey® MLS as Distributed by MLS Grid
- 2018-03-07 Listed $36,900 OneKey® MLS as Distributed by MLS Grid
- 2018-03-07 Listed $36,900 HVCRMLS
- 2018-03-01 Listing Removed — OneKey® MLS as Distributed by MLS Grid
- 2018-01-08 Price Changed $36,900 OneKey® MLS as Distributed by MLS Grid
- 2017-12-06 Price Changed $40,000 OneKey® MLS as Distributed by MLS Grid
- 2017-10-31 Listing Removed — OneKey® MLS as Distributed by MLS Grid
- 2017-10-31 Relisted — OneKey® MLS as Distributed by MLS Grid
- 2017-10-31 Listing Removed — OneKey® MLS as Distributed by MLS Grid
- 2017-10-31 Listed $44,900 OneKey® MLS as Distributed by MLS Grid
- 2017-10-30 Listed $36,900 HVCRMLS
- 2017-10-06 Price Changed $49,900 OneKey® MLS as Distributed by MLS Grid
- 2017-09-05 Price Changed $54,900 OneKey® MLS as Distributed by MLS Grid
- 2017-07-28 Listed $59,900 OneKey® MLS as Distributed by MLS Grid
- 2017-07-27 Listed $49,900 OneKey® MLS as Distributed by MLS Grid
- 2017-07-27 Listed $49,900 HVCRMLS
- 2017-07-12 Sold (Public Records) $29,800 Public Records
- 2017-01-01 Listing Removed — OneKey® MLS as Distributed by MLS Grid
- 2016-05-20 Listed $55,000 OneKey® MLS as Distributed by MLS Grid
- 2007-04-05 Sold (Public Records) $134,813 Public Records
- 2007-04-05 Sold (Public Records) $134,813 Public Records
Property tax history
+3.5%/yrLatest (2025): $3,260 · -1.3% YoY. Source: county tax records.
Cash-flow waterfall
monthlySold comps — $/sqft
last 12 mo · ≤1 miLoading sold comps…