2080 Greenview Shores Blvd #402 · Wellington, FL
Flood risk 1/10 · Minimal
- FEMA flood zone
- X (unshaded)
- Chance of flooding over 30 yrs
- 0.0%
- Est. flood insurance / yr
- $507 – $1,088
Fire risk 1/10 · Minimal
- Est. fire insurance / yr
- $947 – $1,759
Heat risk 9/10 · Severe
- Hot days now (above 107°F)
- 7 days/yr
- Hot days in 30 yrs
- 25 days/yr
Wind risk 10/10 · Severe
- Chance of severe wind over 30 yrs
- 99.0%
Air-quality risk 2/10 · Minimal
- Unhealthy air days now
- 2 days/yr
- Unhealthy air days in 30 yrs
- 2 days/yr
Risk factors via First Street. Map © Google.
Why this score? — see what drove the D grade
The composite is a weighted blend of 9 inputs, each scored 0–100. Each bar is that input's sub-score; the figure is the points it added to the 100-point composite (weight × sub-score).
- Cash flow +13.5/30.0
- ARV discount +7.5/15.0
- 1% rule +5.8/10.0
- Schools +4.3/10.0
- DSCR +4.1/10.0
- Livability +3.7/5.0
- Rent growth +3.1/5.0
- Condition / age +2.5/5.0
- Appreciation +0.0/10.0
$285,000
🖨 Deal sheet 📄 Offer letter ✓ Due diligence
Listing remarks MLS
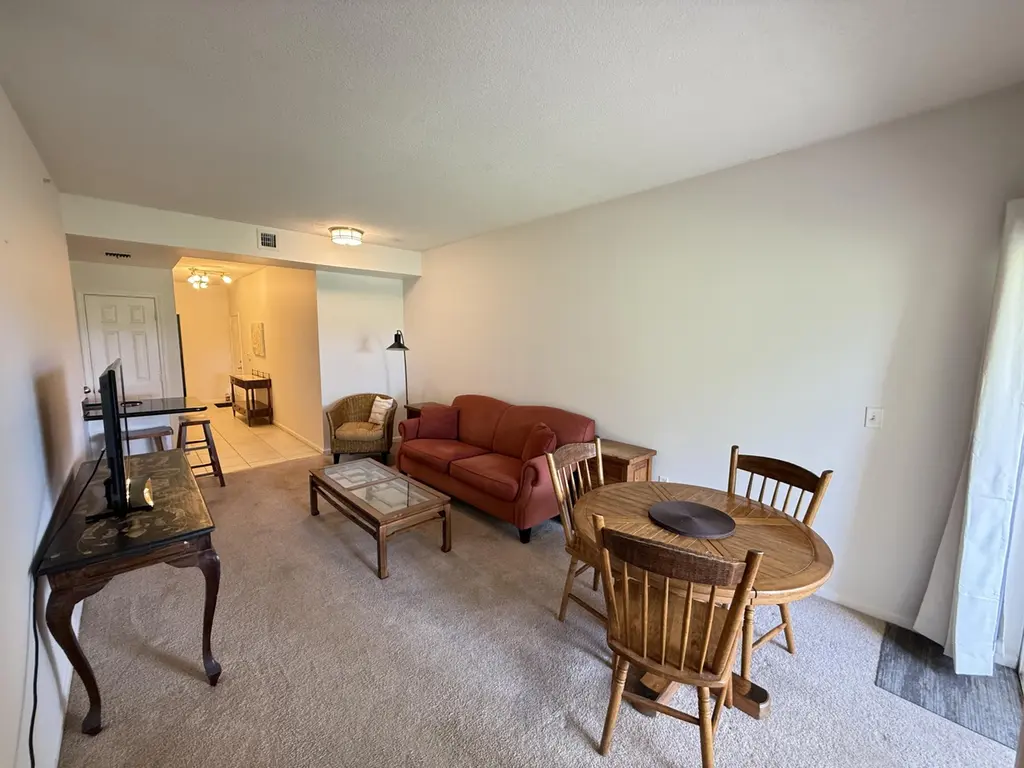
Come see this adorable 2 bedroom/ 2 bath plus den condo. This unit is a sought-after first floor model with attached garage in the most desirable location in rear of complex overlooking water and golf. Unit has been upgraded with granite, new tile in den, kitchen, foyer, hallway and master bath. Brand new Washing Machine. Cute doggie door off rear patio. Walk your dog and enjoy the views. Centrally located and close to horse shows, polo, shopping and restaurants. Gated complex has a pool, volleyball, fitness room and tot lot. It is pet and truck friendly! This is a winner!
Key facts
- Gated community
- Peaceful canal views
- Flexible den
Tags
Property features AI
Finance
- HOA & community: Association managed by Phoenix Property Mgte.; Monthly HOA fee of $377; HOA covers grounds maintenance, sewer, trash, water, common areas, roof repairs, pool service; Community amenities: Fitness center, pool, playground, picnic area, parking, street lights, gated; 112 units in the community; Pets allowed (cats and dogs, with limits on number and size)
Exterior
- Parking: 2 total parking spaces; 1 covered/garage space (attached); 1 open parking space; Assigned parking; Garage door opener
- Security: Fire sprinkler system; Smoke detectors; Gated community (no guard)
- Utilities: Public water; Public sewer; Water connected
- Home design: Condominium; Single-story; Resale property; Faces west
- Construction: CBS construction; Barrel/concrete roof
- Exterior features: Covered patio; Patio; Waterfront (no specific waterfront features listed)
Interior
- Kitchen: Dishwasher; Disposal; Electric range; Microwave; Refrigerator
- Bedrooms: 2 bedrooms on the main level
- Flooring: Carpet; Ceramic tile
- Bathrooms: 2 full bathrooms
- Heating & cooling: Central heating (electric); Central air conditioning (electric)
- Interior features: Walk-in closets; Split bedroom layout; Roman tub; Furnished
- Laundry & utility: Inside laundry; Electric water heater
Neighborhood map
What this means for you Summary
Snapshot
- This is a 3-bed/2.0-bath condo listed at $285k.
Deal economics
- At list price, monthly cash flow is $12 ($139/yr) — positive.
- The deal already cash-flows at list — no discount required.
- Meets the 1% rule at list price ($3k rent vs $285k).
- Recommended offer: $281k (1.5% below list) — sets the bar for market timing.
- Cap rate 6.3% vs local median 3.4% in Wellington — top-decile yield for the area; either an underpriced asset or a hidden risk that comps aren't pricing in. Stress-test before assuming the spread holds.
Location & tenants
- Location reads 73/100 on livability (#294 in FL, #4,986 nationally) — a middle-class / working-renter tenant base. Strengths: crime A+, employment A+, housing A+; Watch: amenities F, commute F, cost of living F.
- Palm Beach (suburban): math 46% / reading 53% proficiency, ranked #34 of 73 in FL (top 47%) — families likely to look elsewhere, expect single-tenant / working-renter base with shorter leases.
- Zoned schools: New Horizons Elementary School (math 55% / reading 64%, grade B-, #690 of 2,144 statewide, top 34%, 727 students, 45% FRL); Polo Park Middle School (math 65% / reading 68%, grade A-, #84 of 571 statewide, top 16%, 1,156 students, 33% FRL); Wellington High School (math 57% / reading 65%, grade C+, #102 of 667 statewide, top 15%, 2,688 students, 29% FRL) — zoned schools average 36% FRL vs 52% district-wide (16 pts lower); this property's tenant base skews higher-income than the district average.
- Zoned-school proficiency averages 62% at this address vs 50% district-wide (+13 pts) — the actual schools serving this property are materially stronger than the Palm Beach average implies; a family-tenant draw the district grade alone would hide.
- Market conditions: Rents rising (+2.3%/yr); 616 active listings in the ZIP; 40 comparable units currently listed for rent nearby; rentals at typical pace (median 24d on market — plan ~3-4 weeks tenant-placement turnaround); high-income renter base; 3,974 units permitted in Palm Beach County in 2024 (1,012 in 5+ unit buildings).
- This rent runs 33% of the median local income ($112k/yr) — at the standard rent-burdened threshold; future hikes will face affordability resistance.
Forward outlook
- Local home prices are declining (-3.0%/yr); year-one equity from $2k of loan paydown is wiped out by about $9k of value loss. Plan a longer hold.
- Palm Beach County population projected at +30% by 2050 — long-run rental-demand tailwind backs the buy-and-hold thesis.
Negotiation context
- It's been on market 16 days — a 2% lower offer ($281k) is reasonable based on typical stale-listing flexibility.
- 6 sale attempts since 19y ago with the ask held roughly flat each time — persistent listings suggest the price (not the market) is what's stuck; bring a comps-based counter.
- Current owner paid $180k; list at $285k implies a 58% gain — meaningful room to come down on a strong offer.
Risks & watch-outs
- Climate carrying-cost: severe wind risk, 99% chance of damaging wind over 30y; extreme-heat days projected 7→25/yr by 2055 (HVAC capex compounding) — expect insurance premiums to compound above CPI over the hold.
Questions for the listing agent
- What does the HOA fee cover, when was the last increase, and are there any pending special assessments or reserve-fund shortfalls?
- Any open or pending special assessments — roof, HVAC, plumbing, elevator, façade? What's the per-unit balance and payoff schedule, and is the seller paying it off at close or rolling it to the buyer?
- Is there a deadline driving the sale (1031 exchange, divorce, estate, relocation)? That informs how much negotiation room exists.
- Schools are A-rated — typically a magnet for longer-tenancy family renters. What's the average tenant stay here, and is there a school-zone premium baked into asking?
- The area grade is low — what's the realistic commute time and amenity access for the typical tenant pool here? Any planned neighborhood developments (good or bad) we should know about?
- What's the average days-on-market for RENTAL listings here right now (not sales)? A rising rental-DOM trend means longer vacancies and softer asking-rent achievability than the comps imply.
- What's the recent tenant-quality profile in this submarket — average credit score on applications, eviction rate, late-payment / NSF rate, and stable-employment percentage? A property-management company in the area should have these aggregated.
- How much new apartment / multifamily construction is in the pipeline within 1–3 miles? Heavy new supply (>2% of stock underway) typically softens rents 12–24 months out; light construction supports rent growth.
Investment metrics
- 1% rule
- 1.08% ✓
- Cap rate
- 6.34%
- Cash-on-cash
- 0.17%
- DSCR
- 1.01
- GRM
- 7.7
CMA / ARV
No comps found within radius.
Projected returns pro-forma
-3.0% appreciation · 2.31% rent growth · sell at horizon
- IRR
- -16.8%
- Equity multiple
- 0.41×
- Total profit
- $-47,243
- Equity at exit
- $42,494
- IRR
- -10.1%
- Equity multiple
- 0.41×
- Total profit
- $-47,464
- Equity at exit
- $24,642
Cash invested: $79,800 (down + closing). Projections, not guarantees.
Landlord ↔ Tenant lean methodology
- Overall (STATE)
- 87 Strongly Landlord-Friendly
- State Florida
- 87 Strongly Landlord-Friendly · R+3
- County
- — inherits STATE
- City
- — inherits STATE
ZIP-level market 33414
- Home prices YoY
- -30.2%
- Rents YoY
- 2.3%
- Active inventory
- 616
- Price-to-rent
- 7.7×
Monthly cashflow live
- Estimated rent
- $3,079 high interval (Pro) →
- Mortgage (P&I)
- −$1,495
- Tax from tax record
- −$431 /mo · $5,168/yr
- Insurance
- −$119
- HOA
- −$377
- Vacancy / Maint / Mgmt
- −$647
- Net cashflow
- $12
Break-even live
UW: 25.0% down · 7.5% · 30yr · 1.5% tax · 5.0% vac · 8.0% maint · 8.0% mgmt
Financing live
Cash to close
- Down payment
- $71,250
- Closing costs
- $8,550
- Reserves months
- —
- Total cash needed
- —
Loan-product check · same deal, 3 products live
Conventional
25% down · 7.5% · 30yr
- Down + closing
- —
- Monthly P&I
- —
- Monthly cashflow
- —
- DSCR
- —
- Eligible?
- —
Personal DTI + credit; lowest rate.
DSCR
20% down · 8.5% · 30yr
- Down + closing
- —
- Monthly P&I
- —
- Monthly cashflow
- —
- DSCR
- —
- Eligible?
- —
No personal income docs; deal must DSCR.
Hard money
10% down · 12.0% · 12mo
- Down + closing
- —
- Monthly P&I
- —
- Monthly cashflow
- —
- DSCR
- —
- Eligible?
- —
Short-term bridge; refi at stabilization.
Rent comps 40 comps
| Address | Beds | Baths | Sqft | Rent | $/sqft | DOM | Units | Dist |
|---|---|---|---|---|---|---|---|---|
| 2100 Greenview Shores Blvd #519 Wellington, FL | 3.0 | 2.0 | 1200 | $2,500 | $2.08 | 24d | 1 | 0.04mi |
| 2060 Greenview Shores Blvd Wellington, FL | 1.0–3.0 | 1.0–2.0 | 972 | $3,350 | $3.44 | 10d | 4 | 0.04mi |
| 2100 Greenview Shores Blvd Wellington, FL | 3.0 | 2.0 | 1200 | $2,200 | $1.83 | 12d | 2 | 0.04mi |
| 2080 Greenview Shores Blvd Wellington, FL | 3.0 | 2.0 | 1156 | $2,675 | $2.31 | 5d | 3 | 0.04mi |
| 2040 Greenview Shores Blvd Wellington, FL | 1.0–2.0 | 1.0–2.0 | 929 | $4,000 | $4.31 | 24d | 2 | 0.06mi |
| 2474 Bedford Mews Dr Wellington, FL | 2.0 | 2.0 | 1231 | $7,000 | $5.69 | 14d | 1 | 0.37mi |
| 2514 Bedford Mews Dr Wellington, FL | 2.0 | 2.5 | 1231 | $3,000 | $2.44 | 24d | 1 | 0.39mi |
| 2555 Bedford Mews Dr Wellington, FL | 3.0 | 2.0 | 1406 | $3,700 | $2.63 | 7d | 1 | 0.40mi |
| 13675 Yarmouth Ct Wellington, FL | 3.0 | 2.0 | 1427 | $2,850 | $2.00 | 24d | 1 | 0.43mi |
| 13671 Yarmouth Ct Wellington, FL | 3.0 | 2.0 | 1450 | $2,750 | $1.90 | 24d | 1 | 0.44mi |
| 13671 Yarmouth Ct Wellington, FL | 3.0 | 2.0 | 1450 | $2,850 | $1.97 | 10d | 1 | 0.44mi |
| 1654 Hawthorne Pl Wellington, FL | 3.0 | 2.0 | 1250 | $2,200 | $1.76 | 2d | 1 | 0.46mi |
| 13647 Yarmouth Ct Wellington, FL | 4.0 | 2.0 | 1460 | $2,500 | $1.71 | 24d | 1 | 0.46mi |
| 13769 Yarmouth Dr Wellington, FL | 3.0 | 2.0 | 1429 | $2,600 | $1.82 | 16d | 1 | 0.47mi |
| 13769 Yarmouth Dr Wellington, FL | 3.0 | 2.0 | 1429 | $2,600 | $1.82 | 15d | 1 | 0.47mi |
| 1646 Hawthorne Pl Wellington, FL | 3.0 | 2.0 | 1133 | $2,400 | $2.12 | 16d | 1 | 0.48mi |
| 13644 Yarmouth Ct Unit A Wellington, FL | 2.0 | 2.0 | 1001 | $2,400 | $2.40 | 24d | 1 | 0.48mi |
| 13491 Fountain View Blvd Wellington, FL | 3.0 | 2.5 | 1481 | $3,000 | $2.03 | 24d | 1 | 0.50mi |
| 13792 Creston Pl Wellington, FL | 2.0 | 2.5 | 1219 | $3,000 | $2.46 | 7d | 1 | 0.50mi |
| 13796 Yarmouth Dr Wellington, FL | 3.0 | 2.0 | 1384 | $2,500 | $1.81 | 24d | 1 | 0.51mi |
| 2606 Bedford Mews Dr Unit (off-season Furnished Rental) Wellington, FL | 3.0 | 2.0 | 1219 | $2,350 | $1.93 | 24d | 1 | 0.53mi |
| 1543 Westchester Ave Wellington, FL | 2.0 | 2.5 | 1219 | $4,500 | $3.69 | 20d | 1 | 0.53mi |
| 13501 Fountain View Blvd Wellington, FL | 3.0 | 2.0 | 1481 | $3,500 | $2.36 | 24d | 1 | 0.53mi |
| 13324 Bedford Mews Ct Wellington, FL | 2.0 | 2.0 | 1489 | $6,000 | $4.03 | 18d | 1 | 0.54mi |
| 1598 Hawthorne Pl Wellington, FL | 3.0 | 2.0 | 1365 | $3,600 | $2.64 | 24d | 1 | 0.54mi |
| 13526 Fountain View Blvd Wellington, FL | 3.0 | 2.0 | 1436 | $3,600 | $2.51 | 24d | 1 | 0.62mi |
| 13868 York Ct Unit C Wellington, FL | 2.0 | 2.0 | 1031 | $2,250 | $2.18 | 24d | 1 | 0.63mi |
| 1168 Amaryllis Ct Wellington, FL | 2.0 | 2.0 | 1087 | $1,800 | $1.66 | 24d | 1 | 0.65mi |
| 1440 Hawthorne Pl Wellington, FL | 2.0 | 2.0 | 1100 | $2,595 | $2.36 | 24d | 1 | 0.67mi |
| 1511 Hawthorne Pl Wellington, FL | 2.0 | 2.0 | 1089 | $2,000 | $1.84 | 24d | 1 | 0.68mi |
| 1509 Hawthorne Pl Wellington, FL | 2.0 | 2.0 | 1089 | $2,300 | $2.11 | 24d | 1 | 0.68mi |
| 14032 Wellington Trce Wellington, FL | 3.0 | 2.5 | 1300 | $2,500 | $1.92 | 24d | 1 | 0.74mi |
| 1317 Periwinkle Pl Wellington, FL | 3.0 | 2.0 | 1275 | $5,500 | $4.31 | 24d | 1 | 0.82mi |
| 1368 Periwinkle Pl Wellington, FL | 2.0 | 2.0 | 1037 | $2,800 | $2.70 | 24d | 1 | 0.84mi |
| 13009 Meadowbreeze Dr Wellington, FL | 2.0 | 2.0 | 1436 | $3,775 | $2.63 | 24d | 1 | 0.84mi |
| 1215 Hyacinth Pl Unit 1215 Wellington, FL | 3.0 | 2.0 | 1302 | $3,000 | $2.30 | 24d | 1 | 0.84mi |
| 13785 Sunflower Ct Unit A Wellington, FL | 3.0 | 2.0 | 1440 | $2,600 | $1.81 | 7d | 1 | 0.84mi |
| 1910 Capeside Cir Wellington, FL | 3.0 | 2.0 | 1208 | $2,530 | $2.09 | 15d | 1 | 0.87mi |
| 1289 Periwinkle Pl Wellington, FL | 2.0 | 2.0 | 1054 | $2,500 | $2.37 | 24d | 1 | 0.87mi |
| 13838 Bottlebrush Ct #13838 Wellington, FL | 2.0 | 2.0 | 1000 | $3,000 | $3.00 | 24d | 1 | 0.88mi |
HOA detail condo
- Monthly dues
- $377 · $4,524/yr
- Likely covers
- waterpoolsecurity
- Assessments
- None detected in remarks — confirm with the listing agent.
Listing history 11 events
-
2026-06-18days on market $285,000 Active 16 DOM
-
2026-06-17days on market $285,000 Active 15 DOM
-
2026-06-16days on market $285,000 Active 14 DOM
-
2026-06-15days on market $285,000 Active 13 DOM
-
2026-06-13days on market $285,000 Active 11 DOM
-
2026-06-09days on market $285,000 Active 7 DOM
-
2026-06-08days on market $285,000 Active 6 DOM
-
2026-06-07days on market $285,000 Active 5 DOM
-
2026-06-04days on market $285,000 Active 2 DOM
-
2026-06-03remarks 699-char remark
-
2026-06-03$285,000 Active 1 DOM
ⓘ Source: listings_history table (triggers on properties + properties_extension) + one-shot
backfill from property_details.listing_events for pre-trigger history.
Tax reassessment forecast FL · Resets to sale price
- Current annual tax
- $5,168 · $431/mo
- Projected year-2 tax
- $5,168 · $431/mo
- Expected delta
- $0/yr ($0/mo · 0.0%)
ⓘ Screening estimate from a state-policy table — verify with the county assessor before closing.
Climate risk First Street
- Flood 1/10 Low FEMA zone X (unshaded) · 0% chance over 30 yrs
- Wildfire 1/10 Low
- Heat 9/10 Extreme 7 d/yr ≥107°F today · 25 d/yr by 30 yrs out
- Wind 10/10 Extreme 99% chance of damaging wind over 30 yrs
- Air quality 2/10 Low 2 unhealthy d/yr today · 2 by 30 yrs out
Nearby sold comps map
Loading sold comps map…
Walkable amenities ~0.75 mi
Loading nearby amenities…
Taxation est. · year 1
- Rental income
- $36,951
- − Mortgage interest
- −$15,964
- − Property taxes
- −$5,168
- − Insurance
- −$1,425
- − Repairs & maintenance
- −$2,956
- − Management
- −$2,956
- − HOA
- −$4,524
- − Depreciation
- −$8,291
- Taxable loss
- −$4,334
- Est. tax savings @ 24.0%
- +$1,040
- After-tax cash flow
- $1,179/yr
For passive investors: Depreciation is non-cash, so a rental often shows a tax loss while cash-flowing — sheltering income. Rental losses are passive: they offset passive income freely, and up to $25,000/yr can offset ordinary (W-2) income if you actively participate and your MAGI is under $100k (phasing out to $0 by $150k); unused losses carry forward. On sale, claimed depreciation is recaptured at up to 25%, and gains may owe capital-gains tax (a 1031 exchange can defer both). Figures are a year-1 estimate at your 24.0% rate — not tax advice; consult a CPA.
Schools (NCES district)
- District
- Palm Beach
- NCES district ID
- 1201500
- Math proficiency
- 46% ▼ -16.00%
- Reading proficiency
- 53% ▼ -4.00%
- Median HH income
- $53,943
- Composite
- 42.72/100
- National rank
- #3160
- State rank
- #34 of 73 in FL
Livability — Wellington
- Score
- 73/100
- State rank
- #294
- US rank
- #4986
Category grades
Schools grade is shown separately in the Schools card above.
Census & demographics
- Census place
- Wellington, FL
- County
- Palm Beach County · 1,438,312 people
- City population
- 60,184
- Metro
- Miami-Fort Lauderdale-Pompano Beach, FL
- Population (ZIP)
- 60,184
- Household income
- $112,241
- Rent vs Own
- Severe rent burden
- 1566.0
Population outlook (Palm Beach County) Hauer SSP2
- Today (2025)
- 1,637,487 people
- By 2030
- 1,743,255 · +6.5%
- By 2040
- 1,948,712 · +19.0%
- By 2050
- 2,132,979 · +30.3%
- By 2075
- 2,530,027 · +54.5%
- By 2100
- 2,706,979 · +65.3%
Race, ethnicity, and origin ACS 2023
- Neighborhood character
- Diverse neighborhood (Simpson 0.67)
- Race & ethnicity
- White 47% Hispanic / Latino 29% Two or more races 20% Black 13% Asian 6%
- Hispanic origin (detail)
- Mexican 4% Puerto Rican 5% Cuban 6% Dominican 1% Salvadoran 1%
- Common ancestry
- Hispanic 4% Romanian 3% Lithuanian 2%
- Foreign-born
- 26% · Canada, Jamaica, China
- Languages at home
- 67% English-only · Spanish 23% French/Haitian/Cajun 3% Other Indo-European 3%
Political lean MEDSL · Palm Beach
- 2024 margin
- Toss-up / Even · D 50.0% · R 49.2%
- 2008→2024 swing
- -22.1pp toward R · 2008: 22.9pp · 2024: 0.8pp
- All cycles
- 2024: D+0.8 2020: D+12.8 2016: D+15.3 2012: D+17.0 2008: D+22.9
Not yet ingested
- Civics
- —
Market trends
- HPI YoY
- ▼ -152.58%
- Current HPI
- 352.9366
- Rent YoY
- ▲ 2.31%
- Metro
- Miami-Fort Lauderdale-Pompano Beach, FL
- State GDP YoY
- ▲ 3.28%
- F500 in state
- 36
Industry mix (Fortune 500 HQ in FL)
| Industry | F500 HQs | Revenue |
|---|---|---|
| Industrial Technology | 2 | $29B |
|
||
| Insurance | 2 | $17B |
|
||
| Retail | 1 | $60B |
|
||
| Technology Distribution | 1 | $58B |
|
||
| Homebuilding | 1 | $35B |
|
||
| Technology Manufacturing | 1 | $35B |
|
||
Price history
+63.0% since first listed15 events — show timeline
- 2026-05-29 Listed $285,000 Beaches MLS
- 2026-03-01 Rental Removed $3,450 RMLSFL
- 2025-10-11 Listed for Rent $3,450 RMLSFL
- 2025-01-06 Rental Removed $3,700 RMLSFL
- 2024-11-12 Listed for Rent $3,700 RMLSFL
- 2018-01-23 Sold (Public Records) $179,975 Public Records
- 2013-08-31 Listed $130,000 Beaches MLS
- 2013-08-31 Sold (MLS) $130,000 Beaches MLS
- 2013-07-10 Sold (Public Records) $130,000 Public Records
- 2011-05-16 Sold (Public Records) $90,000 Public Records
- 2011-05-13 Sold (MLS) $90,000 Beaches MLS
- 2011-05-11 Listing Removed — Beaches MLS
- 2011-02-24 Listed $99,999 Beaches MLS
- 2008-09-01 Listing Removed — Beaches MLS
- 2007-10-11 Listed $174,900 Beaches MLS
Property tax history
+7.5%/yrLatest (2025): $5,168 · +3.4% YoY. Source: county tax records.
Cash-flow waterfall
monthlySold comps — $/sqft
last 12 mo · ≤1 miLoading sold comps…