 Triplex
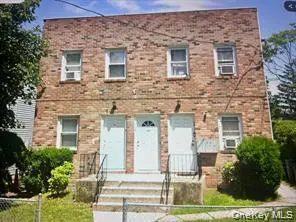
22 Virginia Ave · Hempstead, NY
Flood risk 1/10 · Minimal
- FEMA flood zone
- X (unshaded)
- Chance of flooding over 30 yrs
- 0.0%
- Est. flood insurance / yr
- $473 – $860
Fire risk 1/10 · Minimal
- Est. fire insurance / yr
- $691 – $1,283
Heat risk 6/10 · Moderate
- Hot days now (above 96°F)
- 7 days/yr
- Hot days in 30 yrs
- 16 days/yr
Wind risk 6/10 · Moderate
- Chance of severe wind over 30 yrs
- 54.0%
Air-quality risk 4/10 · Minor
- Unhealthy air days now
- 5 days/yr
- Unhealthy air days in 30 yrs
- 8 days/yr
Risk factors via First Street. Map © Google.
Why this score? — see what drove the D grade
The composite is a weighted blend of 9 inputs, each scored 0–100. Each bar is that input's sub-score; the figure is the points it added to the 100-point composite (weight × sub-score).
- Cash flow +16.2/30.0
- ARV discount +7.5/15.0
- DSCR +5.0/10.0
- 1% rule +4.2/10.0
- Livability +4.0/5.0
- Schools +2.8/10.0
- Rent growth +2.5/5.0
- Condition / age +2.5/5.0
- Appreciation +0.0/10.0
$1,399,999
🖨 Deal sheet (PDF) 📄 Offer letter ✓ Due diligence
Multi-family units
County records classify this as Multi-Family (5+ Unit). Listing-text estimate: 3 units. estimate disagrees with records
5+ unit building — per-unit beds/baths from public records are typically unavailable; the breakdown below (if shown) is an estimate from the listing text.
Listing remarks MLS
Calling all savvy investors! This well-maintained, tenant-occupied property is a rare find. Located just minutes from the Southern State Parkway, Mercy Hospital, and local schools, it offers the perfect combination of convenience and steady rental income. The building features four two-bedroom apartments, all currently leased. Three of the units have been beautifully renovated between 2022 and 2024, ensuring modern, attractive living spaces for tenants. A new roof, installed 3 years ago, adds to the property's appeal, along with upgraded utilities, including four separate gas and electric meters, heating systems, and hot water heaters-all updated within the past five years. Please note that the property is tenant-occupied, and access is limited to the basement only by appointment. Street parking is available. Whether you're looking to expand your portfolio or secure a property with strong investment potential, this opportunity is not to be missed! Annual Rental Income: $106,200 Property Taxes: $30,388 (Includes Hempstead Village taxes of $12,564) Insurance: $3,600 Water: $900
Key facts
- Upgraded utilities
- New roof
- 4,000 sq ft lot
Tags
Neighborhood map
What this means for you Summary
Snapshot
- This is a 3 × 3-bed/?-bath units multifamily listed at $1.40M.
Deal economics
- At list price, monthly cash flow is $750 ($9k/yr) — positive. Per door: $250/mo.
- The deal already cash-flows at list — no discount required.
- To meet the 1% rule (rent ≥ 1% of price), the offer needs to be $1.28M (8.4% below list).
- Recommended offer: $1.28M (8.4% below list) — sets the bar for 1% rule.
- Cap rate 6.9% vs local median 5.1% in Hempstead — top-decile yield for the area; either an underpriced asset or a hidden risk that comps aren't pricing in. Stress-test before assuming the spread holds.
Location & tenants
- Location reads 79/100 on livability (#123 in NY, #2,002 nationally) — a middle-class / working-renter tenant base. Strengths: amenities A+, commute A+, health & safety A; Watch: crime C-, cost of living F.
- Hempstead Union Free School District (suburban): math 27% / reading 38% proficiency, ranked #567 of 590 in NY (top 96%) — families likely to look elsewhere, expect single-tenant / working-renter base with shorter leases; 72% free/reduced lunch — lower-income household profile, screen leases tightly.
- Zoned schools: Prospect Elementary School (414 students, 73% FRL); Alverta B Gray Schultz Middle School (math 11% / reading 27%, grade F, #688 of 729 statewide, top 94%, 938 students, 73% FRL); Hempstead High School (math 50% / reading 69%, grade C+, #851 of 1,100 statewide, top 80%, 1,866 students, 63% FRL) — zoned schools at 70% FRL track the district average.
- Market conditions: 170 active listings in the ZIP; solid renter incomes; 824 units permitted in Nassau County in 2024 (153 in 5+ unit buildings).
- At $12,824/mo this rent would consume 166% of the median local household income ($93k/yr) (locally 2535% of renters already pay >50% of income on rent) — very limited rent-growth headroom before tenants either downsize or default.
Forward outlook
- Local home prices are declining (-3.0%/yr); year-one equity from $10k of loan paydown is wiped out by about $42k of value loss. Plan a longer hold.
- Nassau County population projected at +7% by 2050 — modest demand growth; plan on rents tracking national, not racing it.
Negotiation context
- It's been on market 88 days — a 6% lower offer ($1.32M) is reasonable based on typical stale-listing flexibility.
- 5 sale attempts since 12y ago with the ask held roughly flat each time — persistent listings suggest the price (not the market) is what's stuck; bring a comps-based counter.
- Current owner paid $495k; list at $1.40M implies a 183% gain — meaningful room to come down on a strong offer.
Risks & watch-outs
- Watch-outs: built in 1950 — expect roof / HVAC / electrical / plumbing capex.
- Climate carrying-cost: major wind risk, 54% chance of damaging wind over 30y; extreme-heat days projected 7→16/yr by 2055 (HVAC capex compounding) — expect insurance premiums to compound above CPI over the hold.
Questions for the listing agent
- It's been on market 88 days. Have you received any prior offers? Is the seller open to a 8% concession, seller financing, or rate buy-down credit?
- Can we see the unit-by-unit rent roll, current vacancy, and any below-market leases? What's the average tenancy length?
- What capital expenditures (roof, boiler, parking lot, exteriors) have been made in the last 5 years, and what's planned in the next 2?
- Built in 1950 — when were the roof, HVAC, electrical panel, plumbing, and water heater last replaced?
- Why hasn't it sold? Are there any deal-killer items the seller is aware of (foundation, flood, title, zoning, code violations)?
- Is there a deadline driving the sale (1031 exchange, divorce, estate, relocation)? That informs how much negotiation room exists.
- Schools are D-rated, which usually means shorter tenancies and higher turnover. Who's the typical renter profile here, and what's been the actual vacancy rate?
- The area grade is low — what's the realistic commute time and amenity access for the typical tenant pool here? Any planned neighborhood developments (good or bad) we should know about?
- What's the average days-on-market for RENTAL listings here right now (not sales)? A rising rental-DOM trend means longer vacancies and softer asking-rent achievability than the comps imply.
- What's the recent tenant-quality profile in this submarket — average credit score on applications, eviction rate, late-payment / NSF rate, and stable-employment percentage? A property-management company in the area should have these aggregated.
- How much new apartment / multifamily construction is in the pipeline within 1–3 miles? Heavy new supply (>2% of stock underway) typically softens rents 12–24 months out; light construction supports rent growth.
Investment metrics
- 1% rule
- 0.92% ✗
- Cap rate
- 6.94%
- Cash-on-cash
- 2.30%
- DSCR
- 1.10
- GRM
- 9.1
CMA / ARV
- ARV (median comp)
- $850,000
- List price
- $1,399,999
- Delta
- 64.71%
- Verdict
- OVERPRICED
- Comps
- 1 within 2.0 mi
Projected returns pro-forma
-3.0% appreciation · 3.0% rent growth · sell at horizon
- IRR
- -12.7%
- Equity multiple
- 0.54×
- Total profit
- $-179,050
- Equity at exit
- $208,744
- IRR
- -3.6%
- Equity multiple
- 0.76×
- Total profit
- $-94,315
- Equity at exit
- $121,046
Cash invested: $392,000 (down + closing). Projections, not guarantees.
Landlord ↔ Tenant lean methodology
- Overall (STATE)
- 15 Strongly Tenant-Friendly
- State New York
- 15 Strongly Tenant-Friendly · D+10
- County
- — inherits STATE
- City
- — inherits STATE
ZIP-level market 11550
- Active inventory
- 170
- Price-to-rent
- 27.3×
Monthly cashflow live
- Estimated rent
- $12,824 high interval (Pro) →
- Mortgage (P&I)
- −$7,342
- Tax from tax record
- −$1,455 /mo · $17,465/yr
- Insurance
- −$583
- HOA
- −$0
- Vacancy / Maint / Mgmt
- −$2,693
- Net cashflow
- $750
Break-even live
Sensitivity live
| Price | -10% $1,543 | -5% $1,147 | +0% $750 | +5% $354 | +10% $-42 |
|---|---|---|---|---|---|
| Rent | -10% $-263 | -5% $244 | +0% $750 | +5% $1,257 | +10% $1,764 |
| Rate | -1.0pp $1,456 | -0.5pp $1,107 | base $750 | +0.5pp $388 | +1.0pp $19 |
3-unit breakdown (identical units grouped — click to expand)
| Units | Beds | Baths | Est. rent |
|---|---|---|---|
| 3× units | 3 | — | $12,825 |
| #1 | 3 | — | $4,275 |
| #2 | 3 | — | $4,275 |
| #3 | 3 | — | $4,275 |
| Total (3 units) | $12,824 | ||
UW: 25.0% down · 7.5% · 30yr · 1.5% tax · 5.0% vac · 8.0% maint · 8.0% mgmt
Financing live
Cash to close
- Down payment
- $350,000
- Closing costs
- $42,000
- Reserves months
- —
- Total cash needed
- —
Loan-product check · same deal, 3 products live
Conventional
25% down · 7.5% · 30yr
- Down + closing
- —
- Monthly P&I
- —
- Monthly cashflow
- —
- DSCR
- —
- Eligible?
- —
Personal DTI + credit; lowest rate.
DSCR
20% down · 8.5% · 30yr
- Down + closing
- —
- Monthly P&I
- —
- Monthly cashflow
- —
- DSCR
- —
- Eligible?
- —
No personal income docs; deal must DSCR.
Hard money
10% down · 12.0% · 12mo
- Down + closing
- —
- Monthly P&I
- —
- Monthly cashflow
- —
- DSCR
- —
- Eligible?
- —
Short-term bridge; refi at stabilization.
Listing history 30 events
-
2026-06-21days on market $1,399,999 Active 88 DOM
-
2026-06-18days on market $1,399,999 Active 85 DOM
-
2026-06-17days on market $1,399,999 Active 84 DOM
-
2026-06-16days on market $1,399,999 Active 83 DOM
-
2026-06-15days on market $1,399,999 Active 82 DOM
-
2026-06-13days on market $1,399,999 Active 80 DOM
-
2026-06-13days on market $1,399,999 Active 79 DOM
-
2026-06-09days on market $1,399,999 Active 76 DOM
-
2026-06-08days on market $1,399,999 Active 75 DOM
-
2026-06-07days on market $1,399,999 Active 74 DOM
-
2026-06-04days on market $1,399,999 Active 71 DOM
-
2026-06-03days on market $1,399,999 Active 70 DOM
-
2026-06-02days on market $1,399,999 Active 69 DOM
-
2026-06-01days on market $1,399,999 Active 68 DOM
-
2026-05-31days on market $1,399,999 Active 67 DOM
-
2026-03-25$1,399,999 Active 1093-char remark
Show marketing remark (1093 chars)
Calling all savvy investors! This well-maintained, tenant-occupied property is a rare find. Located just minutes from the Southern State Parkway, Mercy Hospital, and local schools, it offers the perfect combination of convenience and steady rental income. The building features four two-bedroom apartments, all currently leased. Three of the units have been beautifully renovated between 2022 and 2024, ensuring modern, attractive living spaces for tenants. A new roof, installed 3 years ago, adds to the property's appeal, along with upgraded utilities, including four separate gas and electric meters, heating systems, and hot water heaters-all updated within the past five years. Please note that the property is tenant-occupied, and access is limited to the basement only by appointment. Street parking is available. Whether you're looking to expand your portfolio or secure a property with strong investment potential, this opportunity is not to be missed! Annual Rental Income: $106,200 Property Taxes: $30,388 (Includes Hempstead Village taxes of $12,564) Insurance: $3,600 Water: $900
-
2026-02-17historical
-
2026-01-09price $1,199,000
-
2025-12-01$1,300,000 Active
-
2025-08-25historical
-
2025-07-29$1,400,000 Active
-
2025-02-01historical
-
2024-12-05price $1,300,000
-
2024-07-24$1,250,000 Active
-
2015-01-31historical
-
2014-08-23$550,000
-
2006-08-16soldstatus $495,000
-
2006-08-16soldstatus $495,000
-
1995-06-02soldstatus $120,000
-
1978-07-01soldstatus $60,000
ⓘ Source: listings_history table (triggers on properties + properties_extension) + one-shot
backfill from property_details.listing_events for pre-trigger history.
Tax reassessment forecast NY · Partial reset (capped growth)
- Current annual tax
- $17,465 · $1,455/mo
- Projected year-2 tax
- $20,562 · $1,714/mo
- Expected delta
- +$3,098/yr (+$258/mo · 17.7%)
ⓘ Screening estimate from a state-policy table — verify with the county assessor before closing.
Climate risk First Street
- Flood 1/10 Low FEMA zone X (unshaded) · 0% chance over 30 yrs
- Wildfire 1/10 Low
- Heat 6/10 Major 7 d/yr ≥96°F today · 16 d/yr by 30 yrs out
- Wind 6/10 Major 54% chance of damaging wind over 30 yrs
- Air quality 4/10 Moderate 5 unhealthy d/yr today · 8 by 30 yrs out
Nearby sold comps map
Loading sold comps map…
Walkable amenities ~0.75 mi
Loading nearby amenities…
Taxation est. · year 1
- Rental income
- $153,888
- − Mortgage interest
- −$78,422
- − Property taxes
- −$17,465
- − Insurance
- −$7,000
- − Repairs & maintenance
- −$12,311
- − Management
- −$12,311
- − Depreciation
- −$40,727
- Taxable loss
- −$14,348
- Est. tax savings @ 24.0%
- +$3,444
- After-tax cash flow
- $12,449/yr
For passive investors: Depreciation is non-cash, so a rental often shows a tax loss while cash-flowing — sheltering income. Rental losses are passive: they offset passive income freely, and up to $25,000/yr can offset ordinary (W-2) income if you actively participate and your MAGI is under $100k (phasing out to $0 by $150k); unused losses carry forward. On sale, claimed depreciation is recaptured at up to 25%, and gains may owe capital-gains tax (a 1031 exchange can defer both). Figures are a year-1 estimate at your 24.0% rate — not tax advice; consult a CPA.
Schools (NCES district)
- District
- Hempstead Union Free School District
- NCES district ID
- 3614130
- Math proficiency
- 27% ▼ -4.00%
- Reading proficiency
- 38% ▲ 5.00%
- Median HH income
- $48,774
- Composite
- 28.12/100
- National rank
- #6821
- State rank
- #567 of 590 in NY
Livability — Hempstead
- Score
- 79/100
- State rank
- #123
- US rank
- #2002
Category grades
Schools grade is shown separately in the Schools card above.
Census & demographics
- Census place
- Hempstead, NY
- County
- Nassau County · 653,051 people
- City population
- 60,960
- Metro
- New York-Newark-Jersey City, NY-NJ-PA
- Population (ZIP)
- 60,960
- Household income
- $92,677
- Rent vs Own
- Severe rent burden
- 2535.0
Population outlook (Nassau County) Hauer SSP2
- Today (2025)
- 1,409,302 people
- By 2030
- 1,431,482 · +1.6%
- By 2040
- 1,471,607 · +4.4%
- By 2050
- 1,502,845 · +6.6%
- By 2075
- 1,575,403 · +11.8%
- By 2100
- 1,554,356 · +10.3%
Race, ethnicity, and origin ACS 2023
- Neighborhood character
- Diverse neighborhood (Simpson 0.62)
- Race & ethnicity
- Hispanic / Latino 44% Black 43% Two or more races 14% White 7% Asian 2%
- Hispanic origin (detail)
- Mexican 1% Puerto Rican 3% Dominican 4%
- Common ancestry
- Hispanic 4%
- Foreign-born
- 37% · Canada, Jamaica
- Languages at home
- 53% English-only · Spanish 40% French/Haitian/Cajun 4% Other Indo-European 1%
Political lean MEDSL · Nassau
- 2024 margin
- Toss-up / Even · D 47.9% · R 52.1%
- 2008→2024 swing
- -12.6pp toward R · 2008: 8.4pp · 2024: -4.2pp
- All cycles
- 2024: R+4.2 2020: D+9.5 2016: D+5.3 2012: D+6.7 2008: D+8.4
Not yet ingested
- Civics
- —
Market trends
- HPI YoY
- ▼ -297.72%
- Current HPI
- 339.055
- Rent YoY
- —
- Metro
- New York-Newark-Jersey City, NY-NJ-PA
- State GDP YoY
- ▲ 2.60%
- F500 in state
- 92
Industry mix (Fortune 500 HQ in NY)
| Industry | F500 HQs | Revenue |
|---|---|---|
| Financial Services | 10 | $950B |
|
||
| Consumer Goods | 9 | $162B |
|
||
| Insurance | 4 | $225B |
|
||
| Telecommunications | 2 | $144B |
|
||
| Pharmaceuticals | 2 | $112B |
|
||
| Media / Entertainment | 2 | $69B |
|
||
Price history
+2233.3% since first listed15 events — show timeline
- 2026-03-25 Listed $1,399,999 OneKey® MLS as Distributed by MLS Grid
- 2026-02-17 Listing Removed — OneKey® MLS as Distributed by MLS Grid
- 2026-01-09 Price Changed $1,199,000 OneKey® MLS as Distributed by MLS Grid
- 2025-12-01 Listed $1,300,000 OneKey® MLS as Distributed by MLS Grid
- 2025-08-25 Listing Removed — OneKey® MLS as Distributed by MLS Grid
- 2025-07-29 Listed $1,400,000 OneKey® MLS as Distributed by MLS Grid
- 2025-02-01 Listing Removed — OneKey® MLS as Distributed by MLS Grid
- 2024-12-05 Price Changed $1,300,000 OneKey® MLS as Distributed by MLS Grid
- 2024-07-24 Listed $1,250,000 OneKey® MLS as Distributed by MLS Grid
- 2015-01-31 Listing Removed — OneKey® MLS as Distributed by MLS Grid
- 2014-08-23 Listed $550,000 OneKey® MLS as Distributed by MLS Grid
- 2006-08-16 Sold (Public Records) $495,000 Public Records
- 2006-08-16 Sold (Public Records) $495,000 Public Records
- 1995-06-02 Sold (Public Records) $120,000 Public Records
- 1978-07-01 Sold (Public Records) $60,000 Public Records
Property tax history
+1.5%/yrLatest (2024): $17,465 · +5.8% YoY. Source: county tax records.
Cash-flow waterfall
monthlySold comps — $/sqft
last 12 mo · ≤1 miLoading sold comps…