208 E 44th #13 · Garden City, ID
Flood risk 1/10 · Minimal
- FEMA flood zone
- X (shaded)
- Chance of flooding over 30 yrs
- 0.0%
- Est. flood insurance / yr
- $507 – $1,088
Fire risk 2/10 · Minimal
- Est. fire insurance / yr
- $584 – $1,086
Heat risk 5/10 · Moderate
- Hot days now (above 96°F)
- 7 days/yr
- Hot days in 30 yrs
- 18 days/yr
Wind risk 1/10 · Minimal
- Chance of severe wind over 30 yrs
- —
Air-quality risk 8/10 · Major
- Unhealthy air days now
- 14 days/yr
- Unhealthy air days in 30 yrs
- 19 days/yr
Risk factors via First Street. Map © Google.
Why this score? — see what drove the D+ grade
The composite is a weighted blend of 9 inputs, each scored 0–100. Each bar is that input's sub-score; the figure is the points it added to the 100-point composite (weight × sub-score).
- ARV discount +15.0/15.0
- Cash flow +8.0/30.0
- 1% rule +6.9/10.0
- Schools +4.2/10.0
- Livability +4.1/5.0
- Rent growth +3.7/5.0
- Condition / age +2.5/5.0
- DSCR +2.0/10.0
- Appreciation +0.0/10.0
$183,500
🖨 Deal sheet 📄 Offer letter ✓ Due diligence
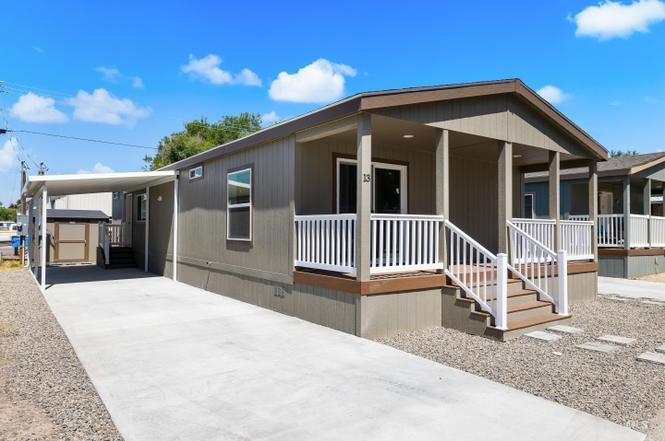
Listing remarks
Welcome to this stunning brand-new manufactured home offering 1,260 square feet of bright, open living space in a beautifully evolving community! With 3 spacious bedrooms, 2 full bathrooms, a separate living room and family room, there’s room for everyone to relax, gather, and enjoy. This low-maintenance home is designed for comfort and convenience, featuring abundant natural light throughout, modern finishes, and a smart layout perfect for everyday living or entertaining. Situated just minutes from the Boise River Greenbelt, local tasting rooms and tap rooms, and all the vibrant happenings in Garden City, you’ll love the lifestyle this location offers. The community itself is u
Key facts
- Thoughtful updates
- Open living space
- 2 parking spots
Tags
Property features AI
Finance
- Other: Property currently in a mobile home park
- HOA & community: Monthly association fee of $650
Exterior
- Parking: Covered carport parking for 2 cars
- Utilities: City water service; Sewer connected
- Home design: Mobile/manufactured home on rented lot; New construction (2025)
- Construction: Composition roof; Crawl space foundation; Built in 2025
- Exterior features: Partial fencing; Paved private road frontage; Located in a mobile home park (rented lot)
Interior
- Kitchen: Dishwasher; Disposal; Built-in oven/range; Microwave; Refrigerator; Breakfast bar; Laminate countertops
- Bedrooms: 3 bedrooms (all on main level); Primary bedroom approx 13 x 11; Second bedroom approx 9 x 11; Third bedroom approx 10 x 11
- Flooring: Carpet; Laminate
- Bathrooms: 2 bathrooms; Private bath in primary bedroom
- Heating & cooling: Forced-air heating; No central air listed
- Interior features: Primary bedroom on main level with private bath; Family room; Breakfast bar; Laminate counters
- Laundry & utility: Electric water heater
Neighborhood map
What this means for you Summary
Snapshot
- This is a 3-bed/2.0-bath manufactured listed at $184k.
Deal economics
- At list price, monthly cash flow is $-190 ($-2k/yr) — negative.
- To cash-flow at today's rent, offer at most $156k (15.0% below list).
- Meets the 1% rule at list price ($2k rent vs $184k).
- Recommended offer: $156k (15.0% below list) — sets the bar for cash-flow.
- Cap rate 5.1% vs local median 2.5% in Garden City — top-decile yield for the area; either an underpriced asset or a hidden risk that comps aren't pricing in. Stress-test before assuming the spread holds.
Location & tenants
- Location reads 82/100 on livability (#11 in ID, #1,264 nationally) — a professional / high-income tenant draw. Strengths: commute A+, health & safety A+, housing A; Watch: crime F.
- Boise Independent District (urban): math 42% / reading 56% proficiency, ranked #36 of 92 in ID (top 39%) — families likely to look elsewhere, expect single-tenant / working-renter base with shorter leases.
- Zoned schools: Whittier Elementary School (math 31% / reading 38%, grade F, #272 of 357 statewide, top 80%, 572 students, 99% FRL); Boise Senior High School (math 58% / reading 75%, grade B, #9 of 169 statewide, top 5%, 1,588 students, 15% FRL) — zoned schools average 57% FRL vs 33% district-wide (24 pts higher); higher-poverty schools than district average — tighter screening recommended.
- Market conditions: Rents rising fast (+4.9%/yr); 445 active listings in the ZIP; 34 comparable units currently listed for rent nearby; rentals at typical pace (median 15d on market — plan ~3-4 weeks tenant-placement turnaround); solid renter incomes; 5,129 units permitted in Ada County in 2024 (414 in 5+ unit buildings).
Forward outlook
- Local home prices are declining (-3.0%/yr); year-one equity from $1k of loan paydown is wiped out by about $6k of value loss. Plan a longer hold.
- Ada County population projected at +45% by 2050 — long-run rental-demand tailwind backs the buy-and-hold thesis.
Negotiation context
- It's been on market 322 days — a 12% lower offer ($161k) is reasonable based on typical stale-listing flexibility.
Risks & watch-outs
- Watch-outs: HOA is 30% of rent.
- Climate carrying-cost: extreme-heat days projected 7→18/yr by 2055 (HVAC capex compounding) — expect insurance premiums to compound above CPI over the hold.
Questions for the listing agent
- What do current leases actually rent for vs. the listed asking? Can we see a recent rent roll and the last 12 months of T-12 income?
- It's been on market 322 days. Have you received any prior offers? Is the seller open to a 15% concession, seller financing, or rate buy-down credit?
- What does the HOA fee cover, when was the last increase, and are there any pending special assessments or reserve-fund shortfalls?
- Why hasn't it sold? Are there any deal-killer items the seller is aware of (foundation, flood, title, zoning, code violations)?
- Is there a deadline driving the sale (1031 exchange, divorce, estate, relocation)? That informs how much negotiation room exists.
- Crime grade is F in this area — have there been break-ins, vandalism, or insurance claims at this property in the last 3 years? What carrier currently insures it and at what premium?
- The area grade is low — what's the realistic commute time and amenity access for the typical tenant pool here? Any planned neighborhood developments (good or bad) we should know about?
- What's the average days-on-market for RENTAL listings here right now (not sales)? A rising rental-DOM trend means longer vacancies and softer asking-rent achievability than the comps imply.
- What's the recent tenant-quality profile in this submarket — average credit score on applications, eviction rate, late-payment / NSF rate, and stable-employment percentage? A property-management company in the area should have these aggregated.
- How much new for-sale + rental construction is in the pipeline within 1–3 miles? Heavy new supply typically softens prices + rents 12–24 months out; constrained supply supports both.
Investment metrics
- 1% rule
- 1.19% ✓
- Cap rate
- 5.05%
- Cash-on-cash
- -4.43%
- DSCR
- 0.80
- GRM
- 7.0
CMA / ARV
- ARV (on-the-fly)
- $238,140
- Comps found
- 2
Show comp detail 2 sales within ~0.75 mi
| Address | Dist | Beds/Ba | Sqft | Sold | Price | $/sf | Match |
|---|---|---|---|---|---|---|---|
| 208 E 44th #3 | 0.00mi | 3/2.0 | 1,152 (-9%) | 11mo | $189,000 | $164 | 76 |
| 4767 N Adams | 0.49mi | 3/2.0 | 1,188 (-6%) | 22mo | $225,000 | $189 | 49 |
Match score weights: distance 35% · size 25% · config 20% · recency 20%. Top-matched comps best support the ARV.
Projected returns pro-forma
-3.0% appreciation · 4.87% rent growth · sell at horizon
- IRR
- -20.2%
- Equity multiple
- 0.28×
- Total profit
- $-37,198
- Equity at exit
- $27,360
- IRR
- -7.7%
- Equity multiple
- 0.45×
- Total profit
- $-28,324
- Equity at exit
- $15,866
Cash invested: $51,380 (down + closing). Projections, not guarantees.
Landlord ↔ Tenant lean methodology
- Overall (STATE)
- 91 Strongly Landlord-Friendly
- State Idaho
- 91 Strongly Landlord-Friendly · R+18
- County
- — inherits STATE
- City
- — inherits STATE
ZIP-level market 83714
- Home prices YoY
- -31.5%
- Rents YoY
- 4.9%
- Active inventory
- 445
- Price-to-rent
- 7.0×
Monthly cashflow live
- Estimated rent
- $2,188 high interval (Pro) →
- Mortgage (P&I)
- −$962
- Tax est. 1.5%
- −$229 /mo · $2,752/yr
- Insurance
- −$76
- HOA
- −$650
- Vacancy / Maint / Mgmt
- −$459
- Net cashflow
- $-190
Break-even live
UW: 25.0% down · 7.5% · 30yr · 1.5% tax · 5.0% vac · 8.0% maint · 8.0% mgmt
Financing live
Cash to close
- Down payment
- $45,875
- Closing costs
- $5,505
- Reserves months
- —
- Total cash needed
- —
Loan-product check · same deal, 3 products live
Conventional
25% down · 7.5% · 30yr
- Down + closing
- —
- Monthly P&I
- —
- Monthly cashflow
- —
- DSCR
- —
- Eligible?
- —
Personal DTI + credit; lowest rate.
DSCR
20% down · 8.5% · 30yr
- Down + closing
- —
- Monthly P&I
- —
- Monthly cashflow
- —
- DSCR
- —
- Eligible?
- —
No personal income docs; deal must DSCR.
Hard money
10% down · 12.0% · 12mo
- Down + closing
- —
- Monthly P&I
- —
- Monthly cashflow
- —
- DSCR
- —
- Eligible?
- —
Short-term bridge; refi at stabilization.
Rent comps 34 comps
| Address | Beds | Baths | Sqft | Rent | $/sqft | DOM | Units | Dist |
|---|---|---|---|---|---|---|---|---|
| 4315 N Adams St Garden City, ID | 3.0 | 2.0 | 1004 | $2,000 | $1.99 | 23d | 1 | 0.20mi |
| 408 E 43rd St Garden City, ID | 2.0–3.0 | 2.0 | 1314 | $3,508 | $2.67 | 3d | 3 | 0.23mi |
| 316 E 46th Pl Garden City, ID | 2.0 | 1.0 | 1080 | $2,250 | $2.08 | 23d | 1 | 0.26mi |
| 4533 N Freeride Ln Garden City, ID | 4.0 | 3.0 | 1588 | $2,400 | $1.51 | 14d | 1 | 0.27mi |
| 4220 N Adams St Garden City, ID | 2.0 | 1.0–2.0 | 767 | $2,333 | $3.04 | 3d | 7 | 0.30mi |
| 385 E 42nd St Garden City, ID | 1.0–2.0 | 1.0–2.0 | 832 | $1,495 | $1.80 | 3d | 1 | 0.33mi |
| 4265 N Reed Ln Garden City, ID | 3.0 | 2.0 | 1189 | $2,195 | $1.85 | 23d | 1 | 0.34mi |
| 521 E 41st St Garden City, ID | 2.0 | 1.0–2.0 | 814 | $5,000 | $6.14 | 23d | 18 | 0.50mi |
| 3894 W Glendale St Boise, ID | 2.0 | 1.0 | 925 | $1,595 | $1.72 | 19d | 1 | 0.75mi |
| 5216 W Wylie Ln Boise, ID | 3.0 | 1.0 | 915 | $1,995 | $2.18 | 3d | 1 | 0.87mi |
| 485 E 50th St Garden City, ID | 1.0–2.0 | 1.0–2.0 | 885 | $1,525 | $1.72 | 11d | 1 | 0.89mi |
| 291 E Thurman Mill Ln Garden City, ID | 3.0 | 2.5 | 1281 | $2,550 | $1.99 | 14d | 1 | 0.93mi |
| 3304 N Lakeharbor Ln Boise, ID | 1.0–3.0 | 1.0–2.0 | 1000 | $2,251 | $2.25 | 3d | 16 | 1.04mi |
| 1917 N 33rd St Boise, ID | 2.0 | 1.5 | 988 | $2,600 | $2.63 | 23d | 1 | 1.18mi |
| 7521 W Tottenham Ln Apt 202 Boise, ID | 3.0 | 2.0 | 1113 | $1,595 | $1.43 | 23d | 1 | 1.21mi |
| 6315 W Chet Ln Unit 6315 102 Boise, ID | 2.0 | 2.5 | 1050 | $1,750 | $1.67 | 3d | 1 | 1.26mi |
| 6315 W Chet Ln Unit 6307 102 Boise, ID | 2.0 | 2.5 | 1050 | $1,750 | $1.67 | 23d | 1 | 1.26mi |
| 6315 W Chet Ln Boise, ID | 2.0 | 2.5 | 1050 | $1,750 | $1.67 | 14d | 1 | 1.26mi |
| 3015 W Stewart Ave Unit 32-103 Stewart 3 BD Boise, ID | 3.0 | 1.5 | 1114 | $1,428 | $1.28 | 23d | 1 | 1.27mi |
| 1411 N Liberty St Boise, ID | 2.0–4.0 | 1.5–2.0 | 1630 | $1,620 | $0.99 | 23d | 1 | 1.28mi |
| 909 N 31st St Boise, ID | 3.0 | 3.0 | 1614 | $2,550 | $1.58 | 3d | 1 | 1.28mi |
| 1406 N Fry Ln Boise, ID | 2.0 | 2.0 | 1000 | $1,450 | $1.45 | 3d | 1 | 1.33mi |
| 1407 N Fry Ln Boise, ID | 2.0 | 2.0 | 1000 | $1,450 | $1.45 | 3d | 1 | 1.34mi |
| 6660 W Colehaven Dr Boise, ID | 2.0 | 2.0 | 1000 | $1,450 | $1.45 | 23d | 1 | 1.35mi |
| 1452 N Allumbaugh St Boise, ID | 2.0 | 2.5 | 1100 | $1,525 | $1.39 | 11d | 1 | 1.36mi |
| 2805 W Moore St Boise, ID | 2.0 | 2.0 | 1000 | $1,600 | $1.60 | 11d | 1 | 1.37mi |
| 365 N Whitewater Park Blvd Boise, ID | 1.0–2.0 | 1.0 | 880 | $2,070 | $2.35 | 3d | 4 | 1.37mi |
| 6641 W Colehaven Dr Boise, ID | 2.0 | 2.0 | 1000 | $1,450 | $1.45 | 23d | 1 | 1.38mi |
| 6652 W Irving St Boise, ID | 2.0 | 2.0 | 1000 | $1,450 | $1.45 | 23d | 1 | 1.38mi |
| 3027 W Madison Ave Boise, ID | 3.0 | 2.5 | 1500 | $2,500 | $1.67 | 23d | 1 | 1.39mi |
| 6677 W Colehaven Dr Boise, ID | 2.0 | 2.0 | 1000 | $1,450 | $1.45 | 23d | 1 | 1.40mi |
| 6739 W Colehaven Dr Boise, ID | 2.0 | 2.0 | 1000 | $1,450 | $1.45 | 23d | 1 | 1.41mi |
| 6724 W Irving St Boise, ID | 2.0 | 2.0 | 1000 | $1,450 | $1.45 | 11d | 1 | 1.43mi |
| 1105 N Liberty St Boise, ID | 1.0–2.0 | 1.0 | 727 | $1,949 | $2.68 | 14d | 4 | 1.46mi |
HOA detail
- Monthly dues
- $650 · $7,800/yr
Listing history 16 events
-
2026-06-18days on market $183,500 Active 322 DOM
-
2026-06-17days on market $183,500 Active 321 DOM
-
2026-06-16days on market $183,500 Active 320 DOM
-
2026-06-15days on market $183,500 Active 319 DOM
-
2026-06-13days on market $183,500 Active 317 DOM
-
2026-06-10days on market $183,500 Active 314 DOM
-
2026-06-09days on market $183,500 Active 313 DOM
-
2026-06-08days on market $183,500 Active 312 DOM
-
2026-06-07days on market $183,500 Active 311 DOM
-
2026-06-05days on market $183,500 Active 308 DOM
-
2026-06-03days on market $183,500 Active 307 DOM
-
2026-06-03days on market $183,500 Active 306 DOM
-
2026-06-01days on market $183,500 Active 305 DOM
-
2026-05-31days on market $183,500 Active 304 DOM
-
2025-12-06price $183,500
-
2025-07-31$189,000 Active
ⓘ Source: listings_history table (triggers on properties + properties_extension) + one-shot
backfill from property_details.listing_events for pre-trigger history.
Climate risk First Street
- Flood 1/10 Low FEMA zone X (shaded) · 0% chance over 30 yrs
- Wildfire 2/10 Low
- Heat 5/10 Major 7 d/yr ≥96°F today · 18 d/yr by 30 yrs out
- Wind 1/10 Low
- Air quality 8/10 Severe 14 unhealthy d/yr today · 19 by 30 yrs out
Nearby sold comps map
Loading sold comps map…
Walkable amenities ~0.75 mi
Loading nearby amenities…
Taxation est. · year 1
- Rental income
- $26,253
- − Mortgage interest
- −$10,279
- − Property taxes
- −$2,752
- − Insurance
- −$918
- − Repairs & maintenance
- −$2,100
- − Management
- −$2,100
- − HOA
- −$7,800
- − Depreciation
- −$5,338
- Taxable loss
- −$5,034
- Est. tax savings @ 24.0%
- +$1,208
- After-tax cash flow
- $-1,069/yr
For passive investors: Depreciation is non-cash, so a rental often shows a tax loss while cash-flowing — sheltering income. Rental losses are passive: they offset passive income freely, and up to $25,000/yr can offset ordinary (W-2) income if you actively participate and your MAGI is under $100k (phasing out to $0 by $150k); unused losses carry forward. On sale, claimed depreciation is recaptured at up to 25%, and gains may owe capital-gains tax (a 1031 exchange can defer both). Figures are a year-1 estimate at your 24.0% rate — not tax advice; consult a CPA.
Schools (NCES district)
- District
- Boise Independent District
- NCES district ID
- 1600360
- Math proficiency
- 42% ▼ -5.00%
- Reading proficiency
- 56% ▼ -1.00%
- Median HH income
- $49,135
- Composite
- 41.82/100
- National rank
- #3388
- State rank
- #36 of 92 in ID
Livability — Garden City
- Score
- 82/100
- State rank
- #11
- US rank
- #1264
Category grades
Schools grade is shown separately in the Schools card above.
Census & demographics
- Census place
- Garden City, ID
- County
- Ada County · 522,161 people
- Metro
- Boise City, ID
- Population (ZIP)
- 27,564
- Household income
- $87,651
- Rent vs Own
- Severe rent burden
- 557.0
Population outlook (Ada County) Hauer SSP2
- Today (2025)
- 535,818 people
- By 2030
- 585,751 · +9.3%
- By 2040
- 682,435 · +27.4%
- By 2050
- 775,818 · +44.8%
- By 2075
- 994,458 · +85.6%
- By 2100
- 1,148,884 · +114.4%
Race, ethnicity, and origin ACS 2023
- Neighborhood character
- Predominantly White (86%)
- Race & ethnicity
- White 86% Hispanic / Latino 9% Two or more races 7%
- Hispanic origin (detail)
- Mexican 7%
- Common ancestry
- Italian 4% Slovak 4% Portuguese 4%
- Foreign-born
- 5% · Canada
- Languages at home
- 92% English-only · Spanish 5% Russian/Polish/Slavic 2% Other Indo-European 1%
Political lean MEDSL · Ada
- 2024 margin
- R (+10.3) · D 43.4% · R 53.8% · Other 2.8%
- 2008→2024 swing
- -4.2pp toward R · 2008: -6.2pp · 2024: -10.3pp
- All cycles
- 2024: R+10.3 2020: R+3.9 2016: R+9.2 2012: R+11.3 2008: R+6.2
Not yet ingested
- Civics
- —
Market trends
- HPI YoY
- ▼ -155.87%
- Current HPI
- 339.0701
- Rent YoY
- ▲ 4.87%
- Metro
- Boise City, ID
- State GDP YoY
- ▲ 4.51%
- F500 in state
- 6
Industry mix (Fortune 500 HQ in ID)
| Industry | F500 HQs | Revenue |
|---|---|---|
| Retail | 1 | $79B |
|
||
| Technology | 1 | $25B |
|
||
| Food / Agriculture | 1 | $6B |
|
||
Price history
-2.9% since first listed2 events — show timeline
- 2025-12-06 Price Changed $183,500 IMLS
- 2025-07-31 Listed $189,000 IMLS
Cash-flow waterfall
monthlySold comps — $/sqft
last 12 mo · ≤1 miLoading sold comps…