1410 Huntington Dr Lot 149 · Findlay, OH
Flood risk No data
- FEMA flood zone
- —
- Chance of flooding over 30 yrs
- %
- Est. flood insurance / yr
- —
Fire risk No data
- Est. fire insurance / yr
- —
Heat risk No data
- Hot days now (above °F)
- days/yr
- Hot days in 30 yrs
- days/yr
Wind risk No data
- Chance of severe wind over 30 yrs
- %
Air-quality risk No data
- Unhealthy air days now
- days/yr
- Unhealthy air days in 30 yrs
- days/yr
Risk factors via First Street. Map © Google.
Why this score? — see what drove the B+ grade
The composite is a weighted blend of 9 inputs, each scored 0–100. Each bar is that input's sub-score; the figure is the points it added to the 100-point composite (weight × sub-score).
- Cash flow +30.0/30.0
- ARV discount +12.8/15.0
- 1% rule +10.0/10.0
- DSCR +10.0/10.0
- Schools +4.7/10.0
- Livability +4.0/5.0
- Rent growth +3.9/5.0
- Condition / age +2.5/5.0
- Appreciation +0.0/10.0
$39,900
🖨 Deal sheet 📄 Offer letter ✓ Due diligence
Listing remarks
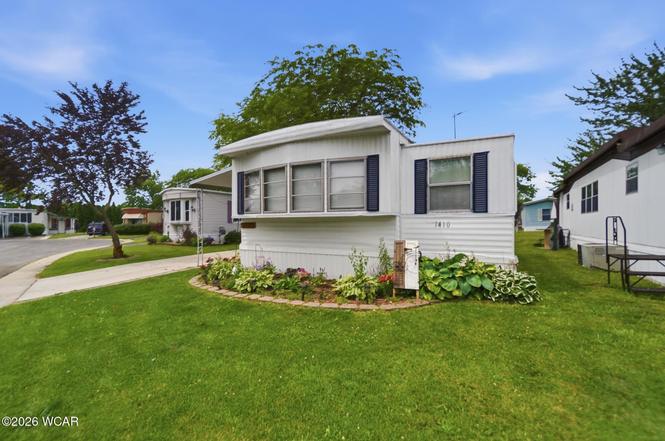
Welcome home to Eastowne Estates! This beautifully updated 2-bedroom, 1-bath mobile home offers the perfect combination of comfort, style, and affordability. Featuring a spacious 10' x 34' bump-out, this home provides an open and inviting living area with plenty of room to relax and entertain. Recent updates throughout create a fresh, move-in-ready feel, while newer windows add efficiency and natural light. The primary bedroom includes convenient built-in storage, maximizing both function and space. Meticulously maintained inside and out, this home is ready for its next owner to enjoy. Don't miss this opportunity for affordable, low-maintenance living in one of Findlay's most popular manufa
Key facts
- 2 parking spots
- Built 1972
Neighborhood map
What this means for you Summary
Snapshot
- This is a 2-bed/1.0-bath manufactured listed at $40k.
Deal economics
- At list price, monthly cash flow is $675 ($8k/yr) — positive.
- The deal already cash-flows at list — no discount required.
- Meets the 1% rule at list price ($1k rent vs $40k).
- Cap rate 26.6% vs local median 5.0% in Findlay — top-decile yield for the area; either an underpriced asset or a hidden risk that comps aren't pricing in. Stress-test before assuming the spread holds.
Location & tenants
- Location reads 81/100 on livability (#98 in OH, #1,496 nationally) — a professional / high-income tenant draw. Strengths: amenities A+, cost of living A+, housing A+; Watch: employment D+, commute F.
- Findlay City (town): math 56% / reading 56% proficiency, ranked #357 of 656 in OH (top 54%) — acceptable for families but not a draw, mixed tenant base, ~2y average lease.
- Market conditions: Rents rising fast (+5.7%/yr); 219 active listings in the ZIP; 3 comparable units currently listed for rent nearby; rentals at typical pace (median 14d on market — plan ~3-4 weeks tenant-placement turnaround); 257 units permitted in Hancock County in 2024 (150 in 5+ unit buildings).
Forward outlook
- Local home prices are declining (-3.0%/yr); year-one equity from $276 of loan paydown is wiped out by about $1k of value loss. Plan a longer hold.
- Hancock County population projected to shrink 4% by 2050 — rents likely to lag national; underwrite the cash flow, not the appreciation.
- At projected returns (-3.0% appreciation + 5.7% rent growth), your $11k cash investment doubles in ~2 years — after that, you're playing with house money.
Negotiation context
- Only 1 days on market — expect competitive offers; lowballing is unlikely to land.
Questions for the listing agent
- Built in 1972 — when were the roof, HVAC, electrical panel, plumbing, and water heater last replaced?
- Is there a deadline driving the sale (1031 exchange, divorce, estate, relocation)? That informs how much negotiation room exists.
- Schools are B-rated — typically a magnet for longer-tenancy family renters. What's the average tenant stay here, and is there a school-zone premium baked into asking?
- What's the average days-on-market for RENTAL listings here right now (not sales)? A rising rental-DOM trend means longer vacancies and softer asking-rent achievability than the comps imply.
- What's the recent tenant-quality profile in this submarket — average credit score on applications, eviction rate, late-payment / NSF rate, and stable-employment percentage? A property-management company in the area should have these aggregated.
- How much new for-sale + rental construction is in the pipeline within 1–3 miles? Heavy new supply typically softens prices + rents 12–24 months out; constrained supply supports both.
Investment metrics
- 1% rule
- 3.02% ✓
- Cap rate
- 26.58%
- Cash-on-cash
- 72.47%
- DSCR
- 4.22
- GRM
- 2.8
CMA / ARV
- ARV (on-the-fly)
- $45,264
- Comps found
- 5
Show comp detail 5 sales within ~0.75 mi
| Address | Dist | Beds/Ba | Sqft | Sold | Price | $/sf | Match |
|---|---|---|---|---|---|---|---|
| 1406 Huntington Dr | 0.01mi | 2/1.0 | 924 (-6%) | 0mo | $43,000 | $47 | 89 |
| 1448 Eastshore Dr | 0.18mi | 2/1.0 | 1,032 (+5%) | 2mo | $35,000 | $34 | 82 |
| 1432 Huntington Dr | 0.09mi | 2/2.0 | 924 (-6%) | 0mo | $42,500 | $46 | 81 |
| 1854 Huntington Dr | 0.20mi | 3/2.0 (+1) | 968 (-2%) | 5mo | $63,900 | $66 | 74 |
| 1876 Huntington Dr | 0.16mi | 3/1.0 (+1) | 1,076 (+9%) | 1mo | $39,000 | $36 | 71 |
Match score weights: distance 35% · size 25% · config 20% · recency 20%. Top-matched comps best support the ARV.
Projected returns pro-forma
-3.0% appreciation · 5.68% rent growth · sell at horizon
- IRR
- 75.2%
- Equity multiple
- 4.57×
- Total profit
- $39,854
- Equity at exit
- $5,949
- IRR
- 79.7%
- Equity multiple
- 10.36×
- Total profit
- $104,549
- Equity at exit
- $3,450
Cash invested: $11,172 (down + closing). Projections, not guarantees.
Landlord ↔ Tenant lean methodology
- Overall (STATE)
- 73 Landlord-Friendly
- State Ohio
- 73 Landlord-Friendly · R+6
- County
- — inherits STATE
- City
- — inherits STATE
ZIP-level market 45840
- Rents YoY
- 5.7%
- Active inventory
- 219
- Price-to-rent
- 2.8×
Monthly cashflow live
- Estimated rent
- $1,203 medium interval (Pro) →
- Mortgage (P&I)
- −$209
- Tax est. 1.5%
- −$50 /mo · $598/yr
- Insurance
- −$17
- HOA
- −$0
- Vacancy / Maint / Mgmt
- −$253
- Net cashflow
- $675
Break-even live
UW: 25.0% down · 7.5% · 30yr · 1.5% tax · 5.0% vac · 8.0% maint · 8.0% mgmt
Financing live
Cash to close
- Down payment
- $9,975
- Closing costs
- $1,197
- Reserves months
- —
- Total cash needed
- —
Loan-product check · same deal, 3 products live
Conventional
25% down · 7.5% · 30yr
- Down + closing
- —
- Monthly P&I
- —
- Monthly cashflow
- —
- DSCR
- —
- Eligible?
- —
Personal DTI + credit; lowest rate.
DSCR
20% down · 8.5% · 30yr
- Down + closing
- —
- Monthly P&I
- —
- Monthly cashflow
- —
- DSCR
- —
- Eligible?
- —
No personal income docs; deal must DSCR.
Hard money
10% down · 12.0% · 12mo
- Down + closing
- —
- Monthly P&I
- —
- Monthly cashflow
- —
- DSCR
- —
- Eligible?
- —
Short-term bridge; refi at stabilization.
Rent comps 3 comps
| Address | Beds | Baths | Sqft | Rent | $/sqft | DOM | Units | Dist |
|---|---|---|---|---|---|---|---|---|
| 2111 Milestone Dr Findlay, OH | 1.0–3.0 | 1.0–2.0 | 965 | $1,200 | $1.24 | 12d | 1 | 0.47mi |
| 2070 Breckenridge Rd Findlay, OH | 2.0 | 1.0 | 810 | $1,060 | $1.31 | 23d | 3 | 1.05mi |
| 1231 Crystal Glen Blvd Findlay, OH | 1.0–2.0 | 1.0–1.5 | 753 | $1,110 | $1.47 | 14d | 13 | 1.08mi |
Listing history 2 events
-
2026-06-19remarks 699-char remark
-
2026-06-19$39,900 Active 1 DOM
ⓘ Source: listings_history table (triggers on properties + properties_extension) + one-shot
backfill from property_details.listing_events for pre-trigger history.
Nearby sold comps map
Loading sold comps map…
Walkable amenities ~0.75 mi
Loading nearby amenities…
Taxation est. · year 1
- Rental income
- $14,437
- − Mortgage interest
- −$2,235
- − Property taxes
- −$598
- − Insurance
- −$200
- − Repairs & maintenance
- −$1,155
- − Management
- −$1,155
- − Depreciation
- −$1,161
- Taxable income
- $7,933
- Est. tax owed @ 24.0%
- −$1,904
- After-tax cash flow
- $6,192/yr
For passive investors: Depreciation is non-cash, so a rental often shows a tax loss while cash-flowing — sheltering income. Rental losses are passive: they offset passive income freely, and up to $25,000/yr can offset ordinary (W-2) income if you actively participate and your MAGI is under $100k (phasing out to $0 by $150k); unused losses carry forward. On sale, claimed depreciation is recaptured at up to 25%, and gains may owe capital-gains tax (a 1031 exchange can defer both). Figures are a year-1 estimate at your 24.0% rate — not tax advice; consult a CPA.
Schools (NCES district)
- District
- Findlay City
- NCES district ID
- 3910000
- Math proficiency
- 56% ▼ -11.00%
- Reading proficiency
- 56% ▼ -9.00%
- Median HH income
- $45,261
- Composite
- 47.31/100
- National rank
- #2300
- State rank
- #357 of 656 in OH
Livability — Findlay
- Score
- 81/100
- State rank
- #98
- US rank
- #1496
Category grades
Schools grade is shown separately in the Schools card above.
Census & demographics
- Census place
- Findlay, OH
- County
- Hancock County · 54,559 people
- City population
- 54,559
- Metro
- Findlay, OH
- Population (ZIP)
- 54,559
- Household income
- $68,083
- Rent vs Own
- Severe rent burden
- 1540.0
Population outlook (Hancock County) Hauer SSP2
- Today (2025)
- 77,526 people
- By 2030
- 77,777 · +0.3%
- By 2040
- 76,976 · -0.7%
- By 2050
- 74,479 · -3.9%
- By 2075
- 65,741 · -15.2%
- By 2100
- 52,942 · -31.7%
Race, ethnicity, and origin ACS 2023
- Neighborhood character
- Predominantly White (85%)
- Race & ethnicity
- White 85% Hispanic / Latino 6% Two or more races 5% Asian 2% Black 2%
- Hispanic origin (detail)
- Mexican 5%
- Common ancestry
- Romanian 3% Italian 2% Lithuanian 2%
- Foreign-born
- 4% · Canada, China
- Languages at home
- 94% English-only · Spanish 3% Other Asian/Pacific 1% Arabic 1%
Political lean MEDSL · Hancock
- 2024 margin
- Solid R (+38.4) · D 30.2% · R 68.7% · Other 1.1%
- 2008→2024 swing
- -15.3pp toward R · 2008: -23.1pp · 2024: -38.4pp
- All cycles
- 2024: R+38.4 2020: R+37.5 2016: R+40.8 2012: R+28.3 2008: R+23.1
Not yet ingested
- Civics
- —
Market trends
- HPI YoY
- ▼ -250.43%
- Current HPI
- 194.9132
- Rent YoY
- ▲ 5.68%
- Metro
- Findlay, OH
- State GDP YoY
- ▲ 1.98%
- F500 in state
- 48
Industry mix (Fortune 500 HQ in OH)
| Industry | F500 HQs | Revenue |
|---|---|---|
| Insurance | 3 | $145B |
|
||
| Industrial Machinery | 3 | $49B |
|
||
| Financial Services | 3 | $24B |
|
||
| Consumer Goods | 2 | $93B |
|
||
| Aerospace / Defense | 2 | $47B |
|
||
| Utilities | 2 | $33B |
|
||
Cash-flow waterfall
monthlySold comps — $/sqft
last 12 mo · ≤1 miLoading sold comps…