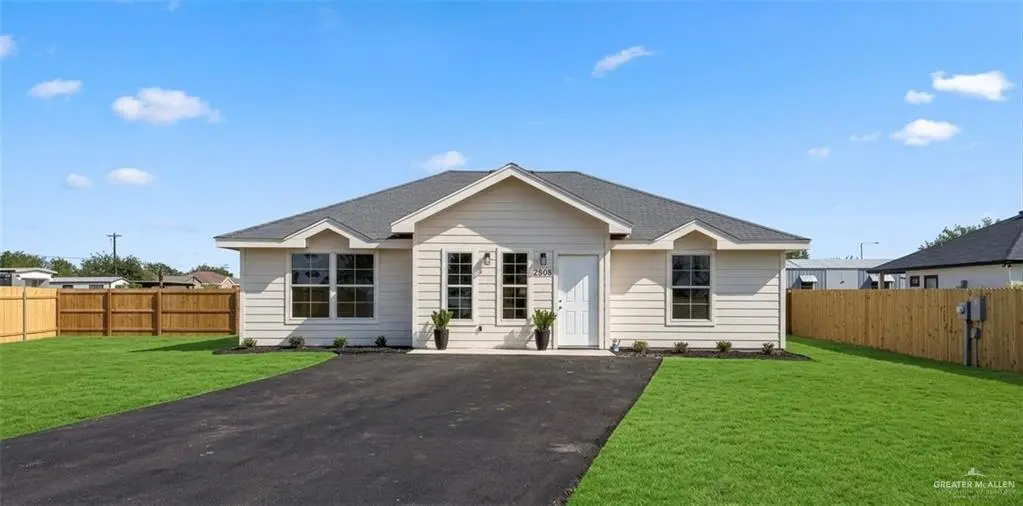
2808 Longhorn Dr · Llano Grande, TX
Flood risk 6/10 · Moderate
- FEMA flood zone
- X (shaded)
- Chance of flooding over 30 yrs
- 0.74%
- Est. flood insurance / yr
- $507 – $1,088
Fire risk 3/10 · Minor
- Est. fire insurance / yr
- $1,222 – $2,270
Heat risk 9/10 · Severe
- Hot days now (above 110°F)
- 7 days/yr
- Hot days in 30 yrs
- 23 days/yr
Wind risk 9/10 · Severe
- Chance of severe wind over 30 yrs
- 99.0%
Air-quality risk 1/10 · Minimal
- Unhealthy air days now
- 0 days/yr
- Unhealthy air days in 30 yrs
- 0 days/yr
Risk factors via First Street. Map © Google.
Why this score? — see what drove the D grade
The composite is a weighted blend of 9 inputs, each scored 0–100. Each bar is that input's sub-score; the figure is the points it added to the 100-point composite (weight × sub-score).
- Cash flow +10.7/30.0
- ARV discount +9.9/15.0
- Appreciation +4.7/10.0
- DSCR +3.1/10.0
- 1% rule +3.0/10.0
- Livability +2.8/5.0
- Rent growth +2.5/5.0
- Condition / age +2.5/5.0
- Schools +2.2/10.0
$178,000
🖨 Deal sheet (PDF) 📄 Offer letter ✓ Due diligence
Listing remarks
Priced to SELL! Step into this fully upgraded 3-bedroom, 2-bath home offering 1,300 sq. ft. of modern living! This property features a brand-new kitchen, beautifully updated showers, and fresh paint inside and out-giving you that "like-new" feel without the new construction price tag. Sitting on an oversized 8,100 sq. ft. lot, this fully fenced home with electric gate delivers the privacy and space you've been looking for perfect for entertaining, pets, or future expansion. Homes with this level of upgrades, lot size, and price point don't last long-schedule your showing today before it's gone!
Key facts
- Updated showers
- Fully fenced
- Brand-new kitchen
Tags
Property features AI
Finance
- HOA & community: No association
Exterior
- Parking: No garage or carport
- Security: Smoke detector(s)
- Utilities: City sewer
- Home design: Single-story property; Living area recorded by appraiser
- Construction: HardiPlank type siding; Shingle roof; Slab foundation; Built on a 0.1861-acre lot
- Exterior features: Wood fencing; Patio; Irregular lot; Gravel road access; Sidewalks
Interior
- Kitchen: Electric water heater; No conveying appliances
- Flooring: Tile
- Bathrooms: 2 full bathrooms
- Heating & cooling: Central heating; Central air conditioning; Smoke detectors
- Interior features: Granite countertops; Ceiling fans; Decorative / high ceilings; No window coverings
- Laundry & utility: Laundry room with washer/dryer connections
Neighborhood map
What this means for you Summary
Snapshot
- This is a 2-bed/2.0-bath manufactured listed at $178k.
Deal economics
- At list price, monthly cash flow is $-83 ($-1k/yr) — negative.
- To cash-flow at today's rent, offer at most $163k (8.3% below list).
- To meet the 1% rule (rent ≥ 1% of price), the offer needs to be $143k (19.7% below list).
- Recommended offer: $143k (19.7% below list) — sets the bar for 1% rule.
Location & tenants
- Location reads 56/100 on livability (#1,288 in TX) — a working-class tenant base; expect higher turnover. Strengths: cost of living A+, housing A-, crime B; Watch: amenities F, commute F, employment F.
- Weslaco ISD (suburban): math 23% / reading 31% proficiency, ranked #705 of 826 in TX (top 85%) — low school quality limits family demand, transient renter base, plan for 1-2y turnover.
- Zoned schools: Cleckler/Heald El (math 20% / reading 22%, grade F, #3,492 of 4,322 statewide, top 81%, 948 students, 82% FRL); Beatriz G Garza Middle (math 26% / reading 37%, grade F, #997 of 1,662 statewide, top 61%, 958 students, 76% FRL); Weslaco East H S (math 24% / reading 26%, grade F, #1,250 of 1,632 statewide, top 77%, 2,004 students, 86% FRL) — zoned schools average 81% FRL vs 59% district-wide (22 pts higher); higher-poverty schools than district average — tighter screening recommended.
- Market conditions: 711 active listings in the ZIP; 5 comparable units currently listed for rent nearby; rentals lingering (median 46d on market — plan ~5-8 weeks vacancy on turnover, expect pricing pressure); 100% of comp listings sitting > 30 days — soft ceiling on asking rent; 7,378 units permitted in Hidalgo County in 2024 (641 in 5+ unit buildings).
Forward outlook
- In year one you build about $191 of equity ($1k loan paydown + $-1k appreciation (-0.6% local appreciation)).
- Hidalgo County population projected at +28% by 2050 — long-run rental-demand tailwind backs the buy-and-hold thesis.
Negotiation context
- It's been on market 52 days — a 3% lower offer ($173k) is reasonable based on typical stale-listing flexibility.
Risks & watch-outs
- Climate carrying-cost: major flood risk; severe wind risk, 99% chance of damaging wind over 30y; extreme-heat days projected 7→23/yr by 2055 (HVAC capex compounding) — expect insurance premiums to compound above CPI over the hold.
Questions for the listing agent
- What do current leases actually rent for vs. the listed asking? Can we see a recent rent roll and the last 12 months of T-12 income?
- It's been on market 52 days. Have you received any prior offers? Is the seller open to a 20% concession, seller financing, or rate buy-down credit?
- Is there a deadline driving the sale (1031 exchange, divorce, estate, relocation)? That informs how much negotiation room exists.
- Schools are F-rated, which usually means shorter tenancies and higher turnover. Who's the typical renter profile here, and what's been the actual vacancy rate?
- The area grade is low — what's the realistic commute time and amenity access for the typical tenant pool here? Any planned neighborhood developments (good or bad) we should know about?
- What's the average days-on-market for RENTAL listings here right now (not sales)? A rising rental-DOM trend means longer vacancies and softer asking-rent achievability than the comps imply.
- What's the recent tenant-quality profile in this submarket — average credit score on applications, eviction rate, late-payment / NSF rate, and stable-employment percentage? A property-management company in the area should have these aggregated.
- How much new for-sale + rental construction is in the pipeline within 1–3 miles? Heavy new supply typically softens prices + rents 12–24 months out; constrained supply supports both.
Investment metrics
- 1% rule
- 0.80% ✗
- Cap rate
- 5.73%
- Cash-on-cash
- -2.01%
- DSCR
- 0.91
- GRM
- 10.4
CMA / ARV
- ARV (median comp)
- $188,227
- List price
- $178,000
- Delta
- -5.43%
- Verdict
- FAIR
- Comps
- 19 within 1.0 mi
Show comp detail 1 sale within ~0.75 mi
| Address | Dist | Beds/Ba | Sqft | Sold | Price | $/sf | Match |
|---|---|---|---|---|---|---|---|
| 3120 Boca Chica Dr | 0.74mi | 2/2.0 | 1,056 (-12%) | 3mo | $115,000 | $109 | 42 |
Match score weights: distance 35% · size 25% · config 20% · recency 20%. Top-matched comps best support the ARV.
Projected returns pro-forma
-0.58% appreciation · 3.0% rent growth · sell at horizon
- IRR
- -6.9%
- Equity multiple
- 0.69×
- Total profit
- $-15,335
- Equity at exit
- $46,547
- IRR
- -0.4%
- Equity multiple
- 0.96×
- Total profit
- $-2,106
- Equity at exit
- $51,999
Cash invested: $49,840 (down + closing). Projections, not guarantees.
Landlord ↔ Tenant lean methodology
- Overall (STATE)
- 87 Strongly Landlord-Friendly
- State Texas
- 87 Strongly Landlord-Friendly · R+5
- County
- — inherits STATE
- City
- — inherits STATE
ZIP-level market 78596
- Home prices YoY
- -0.2%
- Active inventory
- 711
- Price-to-rent
- 10.4×
Monthly cashflow live
- Estimated rent
- $1,430 high interval (Pro) →
- Mortgage (P&I)
- −$933
- Tax from tax record
- −$206 /mo · $2,467/yr
- Insurance
- −$74
- HOA
- −$0
- Vacancy / Maint / Mgmt
- −$300
- Net cashflow
- $-83
Break-even live
Sensitivity live
| Price | -10% $17 | -5% $-33 | +0% $-83 | +5% $-134 | +10% $-184 |
|---|---|---|---|---|---|
| Rent | -10% $-196 | -5% $-140 | +0% $-83 | +5% $-27 | +10% $30 |
| Rate | -1.0pp $6 | -0.5pp $-38 | base $-83 | +0.5pp $-129 | +1.0pp $-176 |
UW: 25.0% down · 7.5% · 30yr · 1.5% tax · 5.0% vac · 8.0% maint · 8.0% mgmt
Financing live
Cash to close
- Down payment
- $44,500
- Closing costs
- $5,340
- Reserves months
- —
- Total cash needed
- —
Loan-product check · same deal, 3 products live
Conventional
25% down · 7.5% · 30yr
- Down + closing
- —
- Monthly P&I
- —
- Monthly cashflow
- —
- DSCR
- —
- Eligible?
- —
Personal DTI + credit; lowest rate.
DSCR
20% down · 8.5% · 30yr
- Down + closing
- —
- Monthly P&I
- —
- Monthly cashflow
- —
- DSCR
- —
- Eligible?
- —
No personal income docs; deal must DSCR.
Hard money
10% down · 12.0% · 12mo
- Down + closing
- —
- Monthly P&I
- —
- Monthly cashflow
- —
- DSCR
- —
- Eligible?
- —
Short-term bridge; refi at stabilization.
Rent comps 5 comps
| Address | Beds | Baths | Sqft | Rent | $/sqft | DOM | Units | Dist |
|---|---|---|---|---|---|---|---|---|
| 2004 Ginger Ave Weslaco, TX | 3.0 | 2.0 | 1332 | $1,600 | $1.20 | 45d | 1 | 0.89mi |
| 2801 Laquinta Weslaco, TX | 2.0 | 1.0 | 984 | $1,350 | $1.37 | 45d | 1 | 0.90mi |
| 2101 Brightwood Ave Weslaco, TX | 3.0 | 2.0 | 1494 | $1,750 | $1.17 | 46d | 1 | 1.00mi |
| 1635 Playa Dr Unit 1 Weslaco, TX | 2.0 | 2.0 | 988 | $1,095 | $1.11 | 45d | 1 | 1.49mi |
| 1630 Playa Dr Unit 1 Weslaco, TX | 2.0 | 2.0 | 935 | $1,095 | $1.17 | 45d | 1 | 1.50mi |
Listing history 19 events
-
2026-06-21days on market $178,000 Active 52 DOM
-
2026-06-21days on market $178,000 Active 51 DOM
-
2026-06-18days on market $178,000 Active 49 DOM
-
2026-06-17days on market $178,000 Active 48 DOM
-
2026-06-16days on market $178,000 Active 47 DOM
-
2026-06-15days on market $178,000 Active 46 DOM
-
2026-06-15days on market $178,000 Active 45 DOM
-
2026-06-13days on market $178,000 Active 44 DOM
-
2026-06-12days on market $178,000 Active 43 DOM
-
2026-06-09days on market $178,000 Active 40 DOM
-
2026-06-08days on market $178,000 Active 39 DOM
-
2026-06-08days on market $178,000 Active 38 DOM
-
2026-06-07days on market $178,000 Active 37 DOM
-
2026-06-03days on market $178,000 Active 34 DOM
-
2026-06-02pricedays on market $178,000 Active 33 DOM
-
2026-06-01days on market $180,000 Active 32 DOM
-
2026-05-31days on market $180,000 Active 31 DOM
-
2026-04-30$180,000 Active 617-char remark
-
2025-09-04soldstatus
ⓘ Source: listings_history table (triggers on properties + properties_extension) + one-shot
backfill from property_details.listing_events for pre-trigger history.
Tax reassessment forecast TX · Resets to sale price
- Current annual tax
- $2,467 · $206/mo
- Projected year-2 tax
- $3,257 · $271/mo
- Expected delta
- +$790/yr (+$66/mo · 32.0%)
ⓘ Screening estimate from a state-policy table — verify with the county assessor before closing.
Climate risk First Street
- Flood 6/10 Major FEMA zone X (shaded) · 74% chance over 30 yrs
- Wildfire 3/10 Moderate
- Heat 9/10 Extreme 7 d/yr ≥110°F today · 23 d/yr by 30 yrs out
- Wind 9/10 Extreme 99% chance of damaging wind over 30 yrs
- Air quality 1/10 Low 0 unhealthy d/yr today · 0 by 30 yrs out
Nearby sold comps map
Loading sold comps map…
Walkable amenities ~0.75 mi
Loading nearby amenities…
Taxation est. · year 1
- Rental income
- $17,163
- − Mortgage interest
- −$9,971
- − Property taxes
- −$2,467
- − Insurance
- −$890
- − Repairs & maintenance
- −$1,373
- − Management
- −$1,373
- − Depreciation
- −$5,178
- Taxable loss
- −$4,090
- Est. tax savings @ 24.0%
- +$981
- After-tax cash flow
- $-19/yr
For passive investors: Depreciation is non-cash, so a rental often shows a tax loss while cash-flowing — sheltering income. Rental losses are passive: they offset passive income freely, and up to $25,000/yr can offset ordinary (W-2) income if you actively participate and your MAGI is under $100k (phasing out to $0 by $150k); unused losses carry forward. On sale, claimed depreciation is recaptured at up to 25%, and gains may owe capital-gains tax (a 1031 exchange can defer both). Figures are a year-1 estimate at your 24.0% rate — not tax advice; consult a CPA.
Schools (NCES district)
- District
- Weslaco ISD
- NCES district ID
- 4844960
- Math proficiency
- 23% ▼ -29.00%
- Reading proficiency
- 31% ▼ -9.00%
- Median HH income
- $32,867
- Composite
- 22.05/100
- National rank
- #8196
- State rank
- #705 of 826 in TX
Livability — Llano Grande
- Score
- 56/100
- State rank
- #1288
- US rank
- #22408
Category grades
Schools grade is shown separately in the Schools card above.
Census & demographics
- Census place
- Llano Grande, TX
- Population (ZIP)
- 38,942
Population outlook (Hidalgo County) Hauer SSP2
- Today (2025)
- 955,232 people
- By 2030
- 1,009,774 · +5.7%
- By 2040
- 1,120,332 · +17.3%
- By 2050
- 1,225,036 · +28.2%
- By 2075
- 1,439,189 · +50.7%
- By 2100
- 1,533,429 · +60.5%
Race, ethnicity, and origin ACS 2023
- Neighborhood character
- Predominantly Hispanic (86%)
- Race & ethnicity
- Hispanic / Latino 86% Two or more races 38% White 13%
- Hispanic origin (detail)
- Mexican 82%
- Common ancestry
- Slovak 1%
- Foreign-born
- 17% · Canada
- Languages at home
- 27% English-only · Spanish 72%
Political lean MEDSL · Hidalgo
- 2024 margin
- Toss-up / Even · D 48.1% · R 51.0%
- 2008→2024 swing
- -41.6pp toward R · 2008: 38.7pp · 2024: -2.9pp
- All cycles
- 2024: R+2.9 2020: D+17.1 2016: D+40.5 2012: D+41.8 2008: D+38.7
Not yet ingested
- Civics
- —
Market trends
- HPI YoY
- ▼ -0.58%
- Current HPI
- 261.5117
- Rent YoY
- —
- Metro
- —
- State GDP YoY
- ▲ 3.95%
- F500 in state
- 110
Industry mix (Fortune 500 HQ in TX)
| Industry | F500 HQs | Revenue |
|---|---|---|
| Energy | 16 | $1,198B |
|
||
| Technology | 5 | $198B |
|
||
| Engineering / Construction | 4 | $72B |
|
||
| Energy Services | 3 | $60B |
|
||
| Utilities | 3 | $41B |
|
||
| Healthcare | 2 | $330B |
|
||
Price history
-1.1% since first listed3 events — show timeline
- 2026-06-02 Price Changed $178,000 MCALLENMLS
- 2026-04-30 Listed $180,000 MCALLENMLS
- 2025-09-04 Sold (Public Records) — Public Records
Property tax history
+34.8%/yrLatest (2025): $2,467 · +8.9% YoY. Source: county tax records.
Cash-flow waterfall
monthlySold comps — $/sqft
last 12 mo · ≤1 miLoading sold comps…