 🔨 Auction
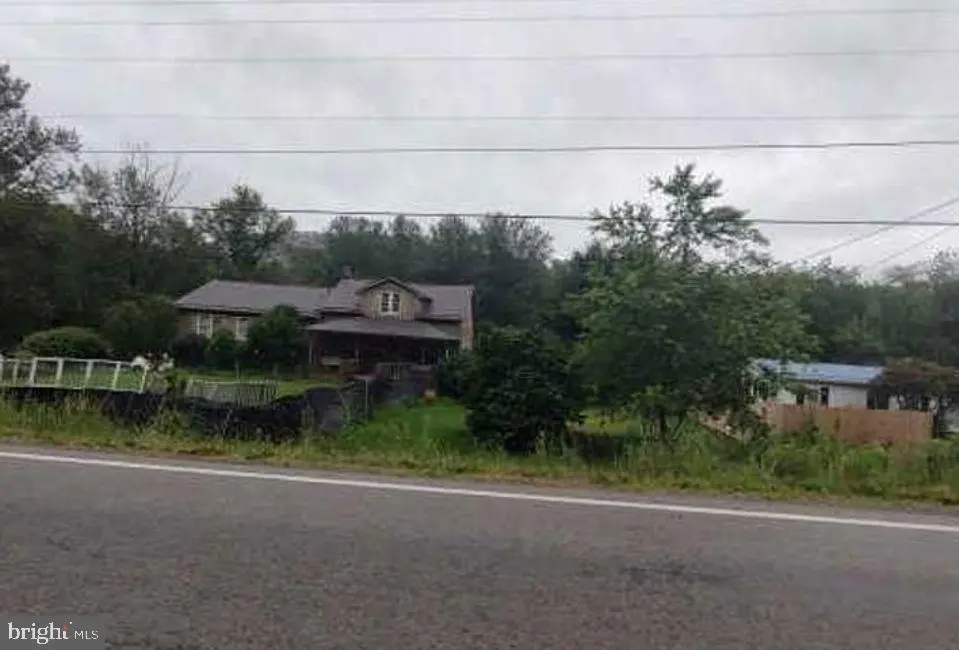
502 Springfield Ln · Ligonier, PA
Flood risk 1/10 · Minimal
- FEMA flood zone
- X (unshaded)
- Chance of flooding over 30 yrs
- 0.0%
- Est. flood insurance / yr
- $507 – $1,088
Fire risk 3/10 · Minor
- Est. fire insurance / yr
- $511 – $949
Heat risk 3/10 · Minor
- Hot days now (above 90°F)
- 7 days/yr
- Hot days in 30 yrs
- 18 days/yr
Wind risk 2/10 · Minimal
- Chance of severe wind over 30 yrs
- —
Air-quality risk 2/10 · Minimal
- Unhealthy air days now
- 1 days/yr
- Unhealthy air days in 30 yrs
- 2 days/yr
Risk factors via First Street. Map © Google.
Why this score? — see what drove the F grade
The composite is a weighted blend of 9 inputs, each scored 0–100. Each bar is that input's sub-score; the figure is the points it added to the 100-point composite (weight × sub-score).
- ARV discount +7.5/15.0
- Livability +4.0/5.0
- Schools +3.6/10.0
- Cash flow +2.5/30.0
- Rent growth +2.5/5.0
- Condition / age +2.5/5.0
- 1% rule +0.0/10.0
- DSCR +0.0/10.0
- Appreciation +0.0/10.0
$69,300
🖨 Deal sheet 📄 Offer letter ✓ Due diligence
Listing remarks MLS
AUCTION-HOME CANNOT BE SHOWN - This Cape Cod style single family home offers 3 bedrooms and 2 bathrooms with approximately 1876 square feet of living space on a 0.74acre lot. There are no inspection or financing contingencies on this cash only purchase. The foreclosure deed has been recorded, allowing for shorter closing timelines. No Buyer Premium on this property. The buyer has the right to select their own title/closing company. The buyer is responsible for all closing costs in this transaction. Seller will pay up to $1,000 in closing costs. It is a criminal offense to trespass on this property. NO TRESPASSING. DO NOT DISTURB ANY OCCUPANTS!
Key facts
- 0.74 acre lot
- 2 garage spots
- Built 1900
Neighborhood map
What this means for you Summary
Snapshot
- This is a 3-bed/2.0-bath other listed at $69k.
Deal economics
- At list price, monthly cash flow is $-1k ($-14k/yr) — negative.
- The deal already cash-flows at list — no discount required.
- Meets the 1% rule at list price ($1k rent vs $69k).
- Recommended offer: $65k (6.0% below list) — sets the bar for market timing.
- Cap rate 2.1% vs local median 1.1% in Ligonier — top-decile yield for the area; either an underpriced asset or a hidden risk that comps aren't pricing in. Stress-test before assuming the spread holds.
Location & tenants
- Location reads 79/100 on livability (#267 in PA, #2,344 nationally) — a middle-class / working-renter tenant base. Strengths: crime A+, cost of living A+, housing A+; Watch: amenities F, commute F.
- Ligonier Valley SD (rural): math 28% / reading 57% proficiency, ranked #310 of 539 in PA (top 58%) — families likely to look elsewhere, expect single-tenant / working-renter base with shorter leases.
- Market conditions: 62 active listings in the ZIP; 415 units permitted in Westmoreland County in 2024 (10 in 5+ unit buildings).
Forward outlook
- Local home prices are declining (-3.0%/yr); year-one equity from $2k of loan paydown is wiped out by about $10k of value loss. Plan a longer hold.
- Westmoreland County population projected at -19% by 2050 — secular population decline; favor cash flow + early exit over multi-decade hold.
Negotiation context
- It's been on market 71 days — a 6% lower offer ($65k) is reasonable based on typical stale-listing flexibility.
- 3 sale attempts since 14y ago with the ask held roughly flat each time — persistent listings suggest the price (not the market) is what's stuck; bring a comps-based counter.
Risks & watch-outs
- Watch-outs: property tax is 3.0% of price; built in 1900 — expect roof / HVAC / electrical / plumbing capex.
Questions for the listing agent
- What do current leases actually rent for vs. the listed asking? Can we see a recent rent roll and the last 12 months of T-12 income?
- It's been on market 71 days. Have you received any prior offers? Is the seller open to a 6% concession, seller financing, or rate buy-down credit?
- Built in 1900 — when were the roof, HVAC, electrical panel, plumbing, and water heater last replaced?
- Property tax is high relative to price — has the assessment been appealed recently, and will the sale trigger a re-assessment?
- Why hasn't it sold? Are there any deal-killer items the seller is aware of (foundation, flood, title, zoning, code violations)?
- Is there a deadline driving the sale (1031 exchange, divorce, estate, relocation)? That informs how much negotiation room exists.
- Schools are A-rated — typically a magnet for longer-tenancy family renters. What's the average tenant stay here, and is there a school-zone premium baked into asking?
- The area grade is low — what's the realistic commute time and amenity access for the typical tenant pool here? Any planned neighborhood developments (good or bad) we should know about?
- What's the average days-on-market for RENTAL listings here right now (not sales)? A rising rental-DOM trend means longer vacancies and softer asking-rent achievability than the comps imply.
- What's the recent tenant-quality profile in this submarket — average credit score on applications, eviction rate, late-payment / NSF rate, and stable-employment percentage? A property-management company in the area should have these aggregated.
- How much new for-sale + rental construction is in the pipeline within 1–3 miles? Heavy new supply typically softens prices + rents 12–24 months out; constrained supply supports both.
Investment metrics
- 1% rule
- 0.34% ✗
- Cap rate
- 2.15%
- Cash-on-cash
- -14.81%
- DSCR
- 0.34
- GRM
- 24.3
CMA / ARV
- ARV (median comp)
- $347,238
- List price
- $69,300
- Delta
- -80.04%
- Verdict
- UNDERPRICED
- Comps
- 4 within 1.0 mi
Projected returns pro-forma
-3.0% appreciation · 3.0% rent growth · sell at horizon
- IRR
- -44.8%
- Equity multiple
- -0.37×
- Total profit
- $-132,852
- Equity at exit
- $51,774
- IRR
- -81.8%
- Equity multiple
- -1.21×
- Total profit
- $-214,691
- Equity at exit
- $30,023
Cash invested: $97,227 (down + closing). Projections, not guarantees.
Landlord ↔ Tenant lean methodology
- Overall (STATE)
- 62 Landlord-Friendly
- State Pennsylvania
- 62 Landlord-Friendly · EVEN
- County
- — inherits STATE
- City
- — inherits STATE
ZIP-level market 15658
- Home prices YoY
- -26.4%
- Active inventory
- 62
- Price-to-rent
- 4.9×
Monthly cashflow live
- Estimated rent
- $1,190 medium interval (Pro) →
- Mortgage (P&I)
- −$1,821
- Tax from tax record
- −$175 /mo · $2,100/yr
- Insurance
- −$145
- HOA
- −$0
- Vacancy / Maint / Mgmt
- −$250
- Net cashflow
- $-1,200
Break-even live
UW: 25.0% down · 7.5% · 30yr · 1.5% tax · 5.0% vac · 8.0% maint · 8.0% mgmt
Financing live
Cash to close
- Down payment
- $86,809
- Closing costs
- $10,417
- Reserves months
- —
- Total cash needed
- —
Loan-product check · same deal, 3 products live
Conventional
25% down · 7.5% · 30yr
- Down + closing
- —
- Monthly P&I
- —
- Monthly cashflow
- —
- DSCR
- —
- Eligible?
- —
Personal DTI + credit; lowest rate.
DSCR
20% down · 8.5% · 30yr
- Down + closing
- —
- Monthly P&I
- —
- Monthly cashflow
- —
- DSCR
- —
- Eligible?
- —
No personal income docs; deal must DSCR.
Hard money
10% down · 12.0% · 12mo
- Down + closing
- —
- Monthly P&I
- —
- Monthly cashflow
- —
- DSCR
- —
- Eligible?
- —
Short-term bridge; refi at stabilization.
Listing history 19 events
-
2026-06-18days on market $69,300 Active 71 DOM
-
2026-06-17days on market $69,300 Active 70 DOM
-
2026-06-16days on market $69,300 Active 69 DOM
-
2026-06-15days on market $69,300 Active 68 DOM
-
2026-06-13days on market $69,300 Active 66 DOM
-
2026-06-09days on market $69,300 Active 62 DOM
-
2026-06-08days on market $69,300 Active 61 DOM
-
2026-06-07days on market $69,300 Active 60 DOM
-
2026-06-05days on market $69,300 Active 57 DOM
-
2026-06-03days on market $69,300 Active 56 DOM
-
2026-06-02days on market $69,300 Active 55 DOM
-
2026-06-01days on market $69,300 Active 54 DOM
-
2026-05-31days on market $69,300 Active 53 DOM
-
2026-04-08$69,300 Active 651-char remark
Show marketing remark (651 chars)
AUCTION-HOME CANNOT BE SHOWN - This Cape Cod style single family home offers 3 bedrooms and 2 bathrooms with approximately 1876 square feet of living space on a 0.74acre lot. There are no inspection or financing contingencies on this cash only purchase. The foreclosure deed has been recorded, allowing for shorter closing timelines. No Buyer Premium on this property. The buyer has the right to select their own title/closing company. The buyer is responsible for all closing costs in this transaction. Seller will pay up to $1,000 in closing costs. It is a criminal offense to trespass on this property. NO TRESPASSING. DO NOT DISTURB ANY OCCUPANTS!
-
2023-03-02soldstatus $135,885
-
2022-11-29price $174,000 57-char remark
Show marketing remark (57 chars)
Bring the love! this amazing property has a lot to offer.
-
2022-11-18$196,800 Active 57-char remark
Show marketing remark (57 chars)
Bring the love! this amazing property has a lot to offer.
-
2012-05-03$125,000
-
2008-01-29soldstatus $135,000
ⓘ Source: listings_history table (triggers on properties + properties_extension) + one-shot
backfill from property_details.listing_events for pre-trigger history.
Tax reassessment forecast PA · Partial reset (capped growth)
- Current annual tax
- $2,100 · $175/mo
- Projected year-2 tax
- $2,100 · $175/mo
- Expected delta
- $0/yr ($0/mo · 0.0%)
ⓘ Screening estimate from a state-policy table — verify with the county assessor before closing.
Climate risk First Street
- Flood 1/10 Low FEMA zone X (unshaded) · 0% chance over 30 yrs
- Wildfire 3/10 Moderate
- Heat 3/10 Moderate 7 d/yr ≥90°F today · 18 d/yr by 30 yrs out
- Wind 2/10 Low
- Air quality 2/10 Low 1 unhealthy d/yr today · 2 by 30 yrs out
Nearby sold comps map
Loading sold comps map…
Walkable amenities ~0.75 mi
Loading nearby amenities…
Taxation est. · year 1
- Rental income
- $14,285
- − Mortgage interest
- −$19,451
- − Property taxes
- −$2,100
- − Insurance
- −$1,736
- − Repairs & maintenance
- −$1,143
- − Management
- −$1,143
- − Depreciation
- −$10,101
- Taxable loss
- −$21,389
- Est. tax savings @ 24.0%
- +$5,133
- After-tax cash flow
- $-9,269/yr
For passive investors: Depreciation is non-cash, so a rental often shows a tax loss while cash-flowing — sheltering income. Rental losses are passive: they offset passive income freely, and up to $25,000/yr can offset ordinary (W-2) income if you actively participate and your MAGI is under $100k (phasing out to $0 by $150k); unused losses carry forward. On sale, claimed depreciation is recaptured at up to 25%, and gains may owe capital-gains tax (a 1031 exchange can defer both). Figures are a year-1 estimate at your 24.0% rate — not tax advice; consult a CPA.
Schools (NCES district)
- District
- Ligonier Valley SD
- NCES district ID
- 4213710
- Math proficiency
- 28% ▼ -16.00%
- Reading proficiency
- 57% ▼ -11.00%
- Median HH income
- $47,879
- Composite
- 36.25/100
- National rank
- #4714
- State rank
- #310 of 539 in PA
Livability — Ligonier
- Score
- 79/100
- State rank
- #267
- US rank
- #2344
Category grades
Schools grade is shown separately in the Schools card above.
Census & demographics
- Population (ZIP)
- 8,114
Population outlook (Westmoreland County) Hauer SSP2
- Today (2025)
- 342,555 people
- By 2030
- 331,717 · -3.2%
- By 2040
- 304,976 · -11.0%
- By 2050
- 277,444 · -19.0%
- By 2075
- 224,607 · -34.4%
- By 2100
- 171,084 · -50.1%
Race, ethnicity, and origin ACS 2023
- Neighborhood character
- Predominantly White (95%)
- Race & ethnicity
- White 95% Hispanic / Latino 2% Two or more races 2% Black 1%
- Common ancestry
- Romanian 6% Slovak 5% Serbian 3%
- Foreign-born
- 2% · Canada
- Languages at home
- 99% English-only · Spanish 1%
Political lean MEDSL · Westmoreland
- 2024 margin
- Strong R (+28.4) · D 35.4% · R 63.9%
- 2008→2024 swing
- -11.7pp toward R · 2008: -16.7pp · 2024: -28.4pp
- All cycles
- 2024: R+28.4 2020: R+28.3 2016: R+31.3 2012: R+23.7 2008: R+16.7
Not yet ingested
- Civics
- —
Market trends
- HPI YoY
- ▼ -55.70%
- Current HPI
- 155.4857
- Rent YoY
- —
- Metro
- —
- State GDP YoY
- ▲ 1.68%
- F500 in state
- 34
Industry mix (Fortune 500 HQ in PA)
| Industry | F500 HQs | Revenue |
|---|---|---|
| Healthcare | 2 | $309B |
|
||
| Insurance | 2 | $27B |
|
||
| Telecommunications / Media | 1 | $124B |
|
||
| Industrial Distribution | 1 | $22B |
|
||
| Financial Services | 1 | $20B |
|
||
| Chemicals / Materials | 1 | $18B |
|
||
Price history
-48.7% since first listed6 events — show timeline
- 2026-04-08 Listed $69,300 BRIGHT MLS
- 2023-03-02 Sold (Public Records) $135,885 Public Records
- 2022-11-29 Price Changed $174,000 West Penn MLS
- 2022-11-18 Listed $196,800 West Penn MLS
- 2012-05-03 Listed $125,000 West Penn MLS
- 2008-01-29 Sold (Public Records) $135,000 Public Records
Property tax history
+1.6%/yrLatest (2026): $2,100 · +1.2% YoY. Source: county tax records.
Cash-flow waterfall
monthlySold comps — $/sqft
last 12 mo · ≤1 miLoading sold comps…