9087 Ranch Dr · Chesterland, OH
Flood risk 1/10 · Minimal
- FEMA flood zone
- X (unshaded)
- Chance of flooding over 30 yrs
- 0.0%
- Est. flood insurance / yr
- $473 – $860
Fire risk 1/10 · Minimal
- Est. fire insurance / yr
- $713 – $1,323
Heat risk 2/10 · Minimal
- Hot days now (above 94°F)
- 7 days/yr
- Hot days in 30 yrs
- 17 days/yr
Wind risk 1/10 · Minimal
- Chance of severe wind over 30 yrs
- —
Air-quality risk 3/10 · Minor
- Unhealthy air days now
- 3 days/yr
- Unhealthy air days in 30 yrs
- 4 days/yr
Risk factors via First Street. Map © Google.
Why this score? — see what drove the B+ grade
The composite is a weighted blend of 9 inputs, each scored 0–100. Each bar is that input's sub-score; the figure is the points it added to the 100-point composite (weight × sub-score).
- Cash flow +29.4/30.0
- ARV discount +15.0/15.0
- DSCR +10.0/10.0
- 1% rule +8.0/10.0
- Schools +7.4/10.0
- Livability +4.2/5.0
- Rent growth +2.5/5.0
- Condition / age +2.5/5.0
- Appreciation +0.0/10.0
$250,000
🖨 Deal sheet 📄 Offer letter ✓ Due diligence
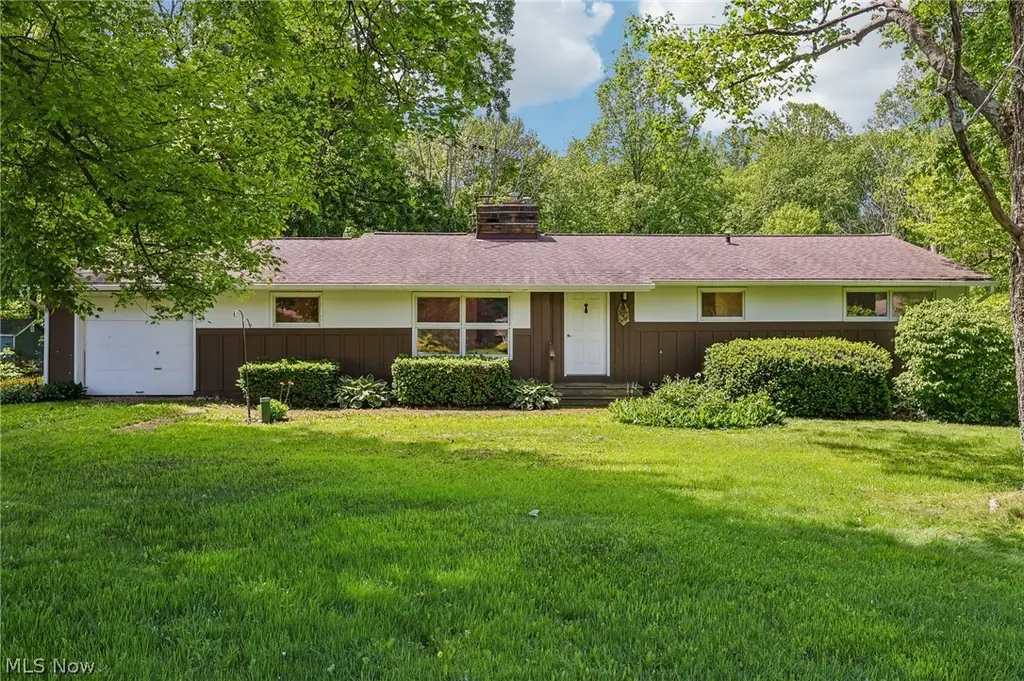
Listing remarks
Full general home inspection, septic and well inspections, along with a third-party appraisal have been completed and are available upon request. There is an offer deadline of 8 pm on June 18. Nestled on nearly 2 sprawling acres in desirable Chesterland, this charming ranch home offers privacy, character, and plenty of space to enjoy both indoors and out! The inviting living room features hardwood floors, a soaring vaulted ceiling, a large picture window that fills the space with natural light, and a cozy wood-burning stove. Just steps away, the dining room showcases hardwood floors, custom built-ins, a vaulted ceiling, and a large window overlooking the scenic property. The kitchen o
Key facts
- 1.93 acre lot
- Garage
- Built 1955
Property features AI
Exterior
- Parking: Attached garage (1 car)
- Utilities: Well water; Septic tank
- Home design: Single-story home; Wood siding construction; Asphalt/fiberglass roof
- Construction: Built (year from public records); Wood siding; Asphalt/fiberglass roof; Full basement (partially finished)
- Exterior features: Approximately 1.93-acre lot
Interior
- Kitchen: Range
- Bedrooms: Three main-level bedrooms
- Bathrooms: One full bathroom on the main level
- Heating & cooling: Gas heating
- Interior features: Full, partially finished basement; Two fireplaces
Neighborhood map
What this means for you Summary
Snapshot
- This is a 3-bed/1.0-bath single-family listed at $250k.
Deal economics
- At list price, monthly cash flow is $890 ($11k/yr) — positive.
- The deal already cash-flows at list — no discount required.
- Meets the 1% rule at list price ($3k rent vs $250k).
- Cap rate 10.6% vs local median 4.9% in Chesterland — top-decile yield for the area; either an underpriced asset or a hidden risk that comps aren't pricing in. Stress-test before assuming the spread holds.
Location & tenants
- Location reads 84/100 on livability (#58 in OH, #835 nationally) — a professional / high-income tenant draw. Strengths: schools A+, crime A+, cost of living A+; Watch: commute F.
- West Geauga Local (rural): math 83% / reading 86% proficiency, ranked #28 of 656 in OH (top 4%) — strong family-tenant draw, lease renewals of 3-5y typical; only 9% free/reduced lunch — higher-income household profile.
- Market conditions: 32 active listings in the ZIP; solid renter incomes; 220 units permitted in Geauga County in 2024 (0 in 5+ unit buildings).
- This rent runs 37% of the median local income ($107k/yr) — at the standard rent-burdened threshold; future hikes will face affordability resistance.
Forward outlook
- Local home prices are declining (-3.0%/yr); year-one equity from $2k of loan paydown is wiped out by about $8k of value loss. Plan a longer hold.
- Geauga County population projected to shrink 7% by 2050 — rents likely to lag national; underwrite the cash flow, not the appreciation.
- At projected returns (-3.0% appreciation + 3.0% rent growth), your $70k cash investment doubles in ~8 years — after that, you're playing with house money.
Negotiation context
- Only 7 days on market — expect competitive offers; lowballing is unlikely to land.
- 2 sale attempts; this cycle's ask has dropped $25k (9%) from the opening price — seller is motivated, your offer sets the floor, not the list.
Risks & watch-outs
- Watch-outs: built in 1955 — expect roof / HVAC / electrical / plumbing capex.
Questions for the listing agent
- Built in 1955 — when were the roof, HVAC, electrical panel, plumbing, and water heater last replaced?
- Is there a deadline driving the sale (1031 exchange, divorce, estate, relocation)? That informs how much negotiation room exists.
- Schools are A-rated — typically a magnet for longer-tenancy family renters. What's the average tenant stay here, and is there a school-zone premium baked into asking?
- What's the average days-on-market for RENTAL listings here right now (not sales)? A rising rental-DOM trend means longer vacancies and softer asking-rent achievability than the comps imply.
- What's the recent tenant-quality profile in this submarket — average credit score on applications, eviction rate, late-payment / NSF rate, and stable-employment percentage? A property-management company in the area should have these aggregated.
- How much new for-sale + rental construction is in the pipeline within 1–3 miles? Heavy new supply typically softens prices + rents 12–24 months out; constrained supply supports both.
Investment metrics
- 1% rule
- 1.30% ✓
- Cap rate
- 10.57%
- Cash-on-cash
- 15.26%
- DSCR
- 1.68
- GRM
- 6.4
CMA / ARV
- ARV (on-the-fly)
- $441,408
- Comps found
- 2
Show comp detail 2 sales within ~0.75 mi
| Address | Dist | Beds/Ba | Sqft | Sold | Price | $/sf | Match |
|---|---|---|---|---|---|---|---|
| 9040 Wyandot Rd | 0.22mi | 3/1.5 | 1,150 (-8%) | 9mo | $405,000 | $352 | 67 |
| 9041 Cedar Rd | 0.48mi | 3/1.0 | 1,080 (-14%) | 9mo | $305,000 | $282 | 47 |
Match score weights: distance 35% · size 25% · config 20% · recency 20%. Top-matched comps best support the ARV.
Projected returns pro-forma
-3.0% appreciation · 3.0% rent growth · sell at horizon
- IRR
- 6.0%
- Equity multiple
- 1.23×
- Total profit
- $16,207
- Equity at exit
- $37,276
- IRR
- 15.3%
- Equity multiple
- 2.25×
- Total profit
- $87,206
- Equity at exit
- $21,615
Cash invested: $70,000 (down + closing). Projections, not guarantees.
Landlord ↔ Tenant lean methodology
- Overall (STATE)
- 73 Landlord-Friendly
- State Ohio
- 73 Landlord-Friendly · R+6
- County
- — inherits STATE
- City
- — inherits STATE
ZIP-level market 44026
- Active inventory
- 32
- Price-to-rent
- 6.4×
Monthly cashflow live
- Estimated rent
- $3,257 medium interval (Pro) →
- Mortgage (P&I)
- −$1,311
- Tax from tax record
- −$268 /mo · $3,212/yr
- Insurance
- −$104
- HOA
- −$0
- Vacancy / Maint / Mgmt
- −$684
- Net cashflow
- $890
Break-even live
UW: 25.0% down · 7.5% · 30yr · 1.5% tax · 5.0% vac · 8.0% maint · 8.0% mgmt
Financing live
Cash to close
- Down payment
- $62,500
- Closing costs
- $7,500
- Reserves months
- —
- Total cash needed
- —
Loan-product check · same deal, 3 products live
Conventional
25% down · 7.5% · 30yr
- Down + closing
- —
- Monthly P&I
- —
- Monthly cashflow
- —
- DSCR
- —
- Eligible?
- —
Personal DTI + credit; lowest rate.
DSCR
20% down · 8.5% · 30yr
- Down + closing
- —
- Monthly P&I
- —
- Monthly cashflow
- —
- DSCR
- —
- Eligible?
- —
No personal income docs; deal must DSCR.
Hard money
10% down · 12.0% · 12mo
- Down + closing
- —
- Monthly P&I
- —
- Monthly cashflow
- —
- DSCR
- —
- Eligible?
- —
Short-term bridge; refi at stabilization.
Listing history 7 events
-
2026-06-17status $250,000 Pending 7 DOM
-
2026-06-17days on market $250,000 Active 7 DOM
-
2026-06-16days on market $250,000 Active 6 DOM
-
2026-06-15days on market $250,000 Active 5 DOM
-
2026-06-13days on market $250,000 Active 3 DOM
-
2026-06-13remarks 699-char remark
-
2026-06-13$250,000 Active 2 DOM
ⓘ Source: listings_history table (triggers on properties + properties_extension) + one-shot
backfill from property_details.listing_events for pre-trigger history.
Tax reassessment forecast OH · Partial reset (capped growth)
- Current annual tax
- $3,212 · $268/mo
- Projected year-2 tax
- $3,556 · $296/mo
- Expected delta
- +$344/yr (+$29/mo · 10.7%)
ⓘ Screening estimate from a state-policy table — verify with the county assessor before closing.
Climate risk First Street
- Flood 1/10 Low FEMA zone X (unshaded) · 0% chance over 30 yrs
- Wildfire 1/10 Low
- Heat 2/10 Low 7 d/yr ≥94°F today · 17 d/yr by 30 yrs out
- Wind 1/10 Low
- Air quality 3/10 Moderate 3 unhealthy d/yr today · 4 by 30 yrs out
Nearby sold comps map
Loading sold comps map…
Walkable amenities ~0.75 mi
Loading nearby amenities…
Taxation est. · year 1
- Rental income
- $39,084
- − Mortgage interest
- −$14,004
- − Property taxes
- −$3,212
- − Insurance
- −$1,250
- − Repairs & maintenance
- −$3,127
- − Management
- −$3,127
- − Depreciation
- −$7,273
- Taxable income
- $7,092
- Est. tax owed @ 24.0%
- −$1,702
- After-tax cash flow
- $8,980/yr
For passive investors: Depreciation is non-cash, so a rental often shows a tax loss while cash-flowing — sheltering income. Rental losses are passive: they offset passive income freely, and up to $25,000/yr can offset ordinary (W-2) income if you actively participate and your MAGI is under $100k (phasing out to $0 by $150k); unused losses carry forward. On sale, claimed depreciation is recaptured at up to 25%, and gains may owe capital-gains tax (a 1031 exchange can defer both). Figures are a year-1 estimate at your 24.0% rate — not tax advice; consult a CPA.
Schools (NCES district)
- District
- West Geauga Local
- NCES district ID
- 3904722
- Math proficiency
- 83% ▼ -3.00%
- Reading proficiency
- 86% ▲ 1.00%
- Median HH income
- $76,759
- Composite
- 73.94/100
- National rank
- #166
- State rank
- #28 of 656 in OH
Livability — Chesterland
- Score
- 84/100
- State rank
- #58
- US rank
- #835
Category grades
Schools grade is shown separately in the Schools card above.
Census & demographics
- Census place
- Chesterland, OH
- County
- Geauga · 90,510 people
- City population
- 10,722
- Metro
- Cleveland, OH
- Population (ZIP)
- 10,722
- Household income
- $106,740
- Rent vs Own
- Severe rent burden
- 11.9
Population outlook (Geauga County) Hauer SSP2
- Today (2025)
- 94,919 people
- By 2030
- 94,804 · -0.1%
- By 2040
- 92,641 · -2.4%
- By 2050
- 88,198 · -7.1%
- By 2075
- 79,080 · -16.7%
- By 2100
- 60,856 · -35.9%
Race, ethnicity, and origin ACS 2023
- Neighborhood character
- Predominantly White (92%)
- Race & ethnicity
- White 92% Two or more races 7% Asian 1%
- Common ancestry
- Romanian 7% Slovak 2% Lithuanian 2%
- Foreign-born
- 5% · South Korea
- Languages at home
- 92% English-only · Other Indo-European 4% Korean 1% Russian/Polish/Slavic 1%
Political lean MEDSL · Geauga
- 2024 margin
- Strong R (+24.1) · D 37.5% · R 61.7%
- 2008→2024 swing
- -8.8pp toward R · 2008: -15.4pp · 2024: -24.1pp
- All cycles
- 2024: R+24.1 2020: R+23.1 2016: R+25.5 2012: R+21.6 2008: R+15.4
Not yet ingested
- Civics
- —
Market trends
- HPI YoY
- ▼ -121.61%
- Current HPI
- 200.0173
- Rent YoY
- —
- Metro
- —
- State GDP YoY
- ▲ 1.98%
- F500 in state
- 48
Industry mix (Fortune 500 HQ in OH)
| Industry | F500 HQs | Revenue |
|---|---|---|
| Insurance | 3 | $145B |
|
||
| Industrial Machinery | 3 | $49B |
|
||
| Financial Services | 3 | $24B |
|
||
| Consumer Goods | 2 | $93B |
|
||
| Aerospace / Defense | 2 | $47B |
|
||
| Utilities | 2 | $33B |
|
||
Price history
-9.1% since first listed4 events — show timeline
- 2026-06-10 Relisted — MLSNOW
- 2026-06-10 Price Changed $250,000 MLSNOW
- 2026-06-09 Price Changed $260,000 MLSNOW
- 2026-06-05 Listed $275,000 MLSNOW
Property tax history
+3.6%/yrLatest (2025): $3,212 · +3.9% YoY. Source: county tax records.
Cash-flow waterfall
monthlySold comps — $/sqft
last 12 mo · ≤1 miLoading sold comps…