 Duplex
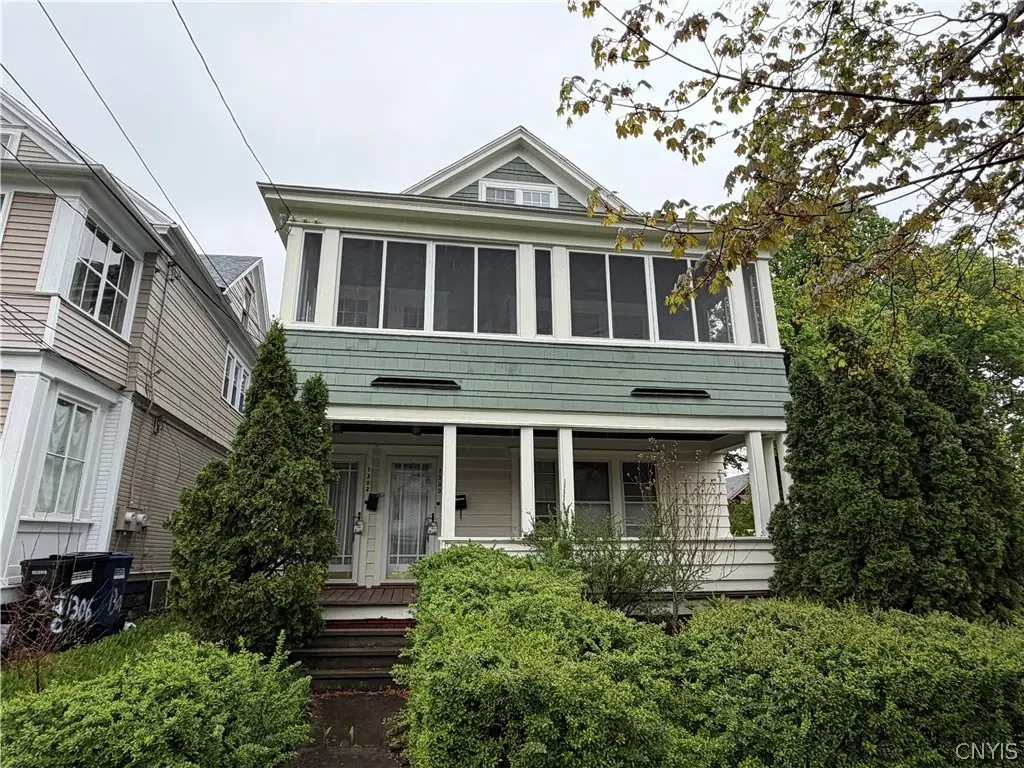
1300-1302 Oak St · Syracuse, NY
Flood risk 1/10 · Minimal
- FEMA flood zone
- X (unshaded)
- Chance of flooding over 30 yrs
- 0.0%
- Est. flood insurance / yr
- $473 – $860
Fire risk 1/10 · Minimal
- Est. fire insurance / yr
- $691 – $1,283
Heat risk 3/10 · Minor
- Hot days now (above 95°F)
- 7 days/yr
- Hot days in 30 yrs
- 16 days/yr
Wind risk 1/10 · Minimal
- Chance of severe wind over 30 yrs
- 1.0%
Air-quality risk 2/10 · Minimal
- Unhealthy air days now
- 0 days/yr
- Unhealthy air days in 30 yrs
- 1 days/yr
Risk factors via First Street. Map © Google.
Why this score? — see what drove the B+ grade
The composite is a weighted blend of 9 inputs, each scored 0–100. Each bar is that input's sub-score; the figure is the points it added to the 100-point composite (weight × sub-score).
- Cash flow +30.0/30.0
- ARV discount +14.3/15.0
- DSCR +10.0/10.0
- 1% rule +8.1/10.0
- Rent growth +4.6/5.0
- Livability +3.9/5.0
- Condition / age +2.5/5.0
- Schools +1.8/10.0
- Appreciation +0.0/10.0
$239,900
🖨 Deal sheet 📄 Offer letter ✓ Due diligence
Multi-family units
County records classify this as Multi-Family (2-4 Unit). Listing-text estimate: 2 units. confirmed
Listing remarks
Spacious and well-maintained multifamily property offering over 2,200 square feet of living space. This property includes two generously sized units, each featuring 2 bedrooms and 1 full bathroom. Both apartments include a welcoming porch, formal dining room, comfortable living room, and dedicated storage room. Providing plenty of space and functionality for tenants or owner-occupants alike. The property also offers a full attic and full basement for additional storage or potential use, along with a detached garage for convenient parking. A great opportunity for investors or those seeking multi-generational living with strong rental potential and classic layout features throughout. Don't mi
Key facts
- Formal dining room
- Full basement
- Full attic
Tags
Property features AI
Finance
- Other: Property has separate gas and electric meters for the two units; Operating expense details noted in remarks
- Financial info: Tenant pays all utilities; One unit's listed rent: $1,050 (actual)
Exterior
- Parking: Garage with 2 spaces; Additional parking with two or more spaces
- Utilities: Public water connected; Sewer connected; Cable available; High-speed internet available; Electric with circuit breakers
- Home design: Multi-family property with 2 total units; 3 stories; Residential 2-unit zoning; Existing construction condition
- Construction: Cedar and wood siding; Asphalt shingle roof; Block foundation; Built (existing)
- Exterior features: Partial fencing; Corner lot; Near public transit; Rectangular residential lot; City street frontage
Interior
- Kitchen: Eat-in kitchen; Dining area with kitchen; Formal dining room; Oven/Range
- Bedrooms: Two-bedroom unit (one unit listed with 2 bedrooms)
- Flooring: Hardwood; Varies by area
- Bathrooms: Two full bathrooms total (each unit details include 1 full bath for one unit)
- Heating & cooling: Gas forced-air heating
- Interior features: Hardwood and varied flooring; Full basement; Two fireplaces
- Laundry & utility: Washer and dryer included; Gas water heater
Neighborhood map
What this means for you Summary
Snapshot
- This is a 2 × 2-bed/1-bath units multifamily listed at $240k.
Deal economics
- At list price, monthly cash flow is $1k ($12k/yr) — positive. Per door: $500/mo.
- The deal already cash-flows at list — no discount required.
- Meets the 1% rule at list price ($3k rent vs $240k).
- Cap rate 11.3% vs local median 8.2% in Syracuse — top-decile yield for the area; either an underpriced asset or a hidden risk that comps aren't pricing in. Stress-test before assuming the spread holds.
Location & tenants
- Location reads 77/100 on livability (#187 in NY, #2,869 nationally) — a middle-class / working-renter tenant base. Strengths: amenities A+, commute A+, cost of living A+; Watch: schools D+, crime F, employment D-.
- Syracuse City School District (urban): math 18% / reading 26% proficiency, ranked #590 of 590 in NY (top 100%) — low school quality limits family demand, transient renter base, plan for 1-2y turnover; 74% free/reduced lunch — lower-income household profile, screen leases tightly.
- Market conditions: Rents rising fast (+8.4%/yr); 55 active listings in the ZIP; 6 comparable units currently listed for rent nearby; rentals at typical pace (median 21d on market — plan ~3-4 weeks tenant-placement turnaround); 616 units permitted in Onondaga County in 2024 (256 in 5+ unit buildings).
- At $3,147/mo this rent would consume 80% of the median local household income ($47k/yr) (locally 1566% of renters already pay >50% of income on rent) — very limited rent-growth headroom before tenants either downsize or default.
Forward outlook
- Local home prices are declining (-3.0%/yr); year-one equity from $2k of loan paydown is wiped out by about $7k of value loss. Plan a longer hold.
- Onondaga County population projected to shrink 9% by 2050 — rents likely to lag national; underwrite the cash flow, not the appreciation.
- At projected returns (-3.0% appreciation + 8.0% rent growth), your $67k cash investment doubles in ~6 years — after that, you're playing with house money.
Negotiation context
- Only 2 days on market — expect competitive offers; lowballing is unlikely to land.
Risks & watch-outs
- Watch-outs: built in 1915 — expect roof / HVAC / electrical / plumbing capex.
Questions for the listing agent
- Can we see the unit-by-unit rent roll, current vacancy, and any below-market leases? What's the average tenancy length?
- What capital expenditures (roof, boiler, parking lot, exteriors) have been made in the last 5 years, and what's planned in the next 2?
- Built in 1915 — when were the roof, HVAC, electrical panel, plumbing, and water heater last replaced?
- Is there a deadline driving the sale (1031 exchange, divorce, estate, relocation)? That informs how much negotiation room exists.
- Schools are D-rated, which usually means shorter tenancies and higher turnover. Who's the typical renter profile here, and what's been the actual vacancy rate?
- Crime grade is F in this area — have there been break-ins, vandalism, or insurance claims at this property in the last 3 years? What carrier currently insures it and at what premium?
- What's the average days-on-market for RENTAL listings here right now (not sales)? A rising rental-DOM trend means longer vacancies and softer asking-rent achievability than the comps imply.
- What's the recent tenant-quality profile in this submarket — average credit score on applications, eviction rate, late-payment / NSF rate, and stable-employment percentage? A property-management company in the area should have these aggregated.
- How much new apartment / multifamily construction is in the pipeline within 1–3 miles? Heavy new supply (>2% of stock underway) typically softens rents 12–24 months out; light construction supports rent growth.
Investment metrics
- 1% rule
- 1.31% ✓
- Cap rate
- 11.29%
- Cash-on-cash
- 17.86%
- DSCR
- 1.79
- GRM
- 6.4
CMA / ARV
- ARV (median comp)
- $282,935
- List price
- $239,900
- Delta
- -15.21%
- Verdict
- UNDERPRICED
- Comps
- 20 within 1.0 mi
Show comp detail 12 sales within ~0.75 mi
| Address | Dist | Beds/Ba | Sqft | Sold | Price | $/sf | Match |
|---|---|---|---|---|---|---|---|
| 1215 Oak St #17 | 0.04mi | 4/2.0 | 2,482 (+11%) | 1mo | $218,200 | $88 | 79 |
| 501-503 Dewitt St | 0.27mi | 4/2.0 | 2,370 (+6%) | 2mo | $198,000 | $84 | 76 |
| 1310 Oak St | 0.01mi | 5/2.0 (+1) | 2,080 (-7%) | 16mo | $185,000 | $89 | 69 |
| 300 Helen St | 0.27mi | 5/2.0 (+1) | 2,098 (-6%) | 4mo | $165,000 | $79 | 68 |
| 1350 Oak St | 0.08mi | 4/2.0 | 2,425 (+8%) | 20mo | $125,000 | $52 | 66 |
| 932-934 Oak St | 0.29mi | 5/2.0 (+1) | 2,050 (-8%) | 2mo | $105,000 | $51 | 65 |
| 1004 Highland St #6 | 0.33mi | 4/2.0 | 2,034 (-9%) | 16mo | $84,000 | $41 | 56 |
| 220 Craig St | 0.50mi | 4/2.0 | 2,288 (+2%) | 22mo | $50,000 | $22 | 55 |
| 1107 Butternut St | 0.46mi | 4/2.0 | 2,002 (-11%) | 9mo | $34,900 | $17 | 54 |
| 313-315 Beecher St | 0.53mi | 4/2.0 | 2,132 (-5%) | 19mo | $109,000 | $51 | 51 |
| 1417 Butternut St | 0.38mi | 5/3.0 (+1) | 2,005 (-10%) | 8mo | $79,900 | $40 | 50 |
| 712 Oak St | 0.45mi | 5/3.0 (+1) | 2,461 (+10%) | 19mo | $135,000 | $55 | 38 |
Match score weights: distance 35% · size 25% · config 20% · recency 20%. Top-matched comps best support the ARV.
Projected returns pro-forma
-3.0% appreciation · 8.0% rent growth · sell at horizon
- IRR
- 14.6%
- Equity multiple
- 1.62×
- Total profit
- $41,364
- Equity at exit
- $35,770
- IRR
- 26.6%
- Equity multiple
- 3.88×
- Total profit
- $193,457
- Equity at exit
- $20,742
Cash invested: $67,172 (down + closing). Projections, not guarantees.
Landlord ↔ Tenant lean methodology
- Overall (STATE)
- 15 Strongly Tenant-Friendly
- State New York
- 15 Strongly Tenant-Friendly · D+10
- County
- — inherits STATE
- City
- — inherits STATE
ZIP-level market 13203
- Home prices YoY
- -11.9%
- Rents YoY
- 8.4%
- Active inventory
- 55
- Price-to-rent
- 12.7×
Monthly cashflow live
- Estimated rent
- $3,147 high interval (Pro) →
- Mortgage (P&I)
- −$1,258
- Tax from tax record
- −$129 /mo · $1,542/yr
- Insurance
- −$100
- HOA
- −$0
- Vacancy / Maint / Mgmt
- −$661
- Net cashflow
- $1,000
Break-even live
2-unit breakdown (identical units grouped — click to expand)
| Units | Beds | Baths | Est. rent |
|---|---|---|---|
| 2× units | 2 | 1 | $3,148 |
| #1 | 2 | 1 | $1,574 |
| #2 | 2 | 1 | $1,574 |
| Total (2 units) | $3,147 | ||
UW: 25.0% down · 7.5% · 30yr · 1.5% tax · 5.0% vac · 8.0% maint · 8.0% mgmt
Financing live
Cash to close
- Down payment
- $59,975
- Closing costs
- $7,197
- Reserves months
- —
- Total cash needed
- —
Loan-product check · same deal, 3 products live
Conventional
25% down · 7.5% · 30yr
- Down + closing
- —
- Monthly P&I
- —
- Monthly cashflow
- —
- DSCR
- —
- Eligible?
- —
Personal DTI + credit; lowest rate.
DSCR
20% down · 8.5% · 30yr
- Down + closing
- —
- Monthly P&I
- —
- Monthly cashflow
- —
- DSCR
- —
- Eligible?
- —
No personal income docs; deal must DSCR.
Hard money
10% down · 12.0% · 12mo
- Down + closing
- —
- Monthly P&I
- —
- Monthly cashflow
- —
- DSCR
- —
- Eligible?
- —
Short-term bridge; refi at stabilization.
Rent comps 6 comps
| Address | Beds | Baths | Sqft | Rent | $/sqft | DOM | Units | Dist |
|---|---|---|---|---|---|---|---|---|
| 712 Oak St Syracuse, NY | 3.0 | 1.0 | 2461 | $1,700 | $0.69 | 21d | 1 | 0.48mi |
| 746 E Laurel St Unit 1 Syracuse, NY | 4.0 | 2.0 | 1400 | $1,500 | $1.07 | 43d | 1 | 0.73mi |
| 365 Green St Syracuse, NY | 5.0 | 3.5 | 2263 | $3,300 | $1.46 | 21d | 1 | 0.87mi |
| 202 Stafford Ave Syracuse, NY | 3.0 | 1.0 | 1692 | $1,800 | $1.06 | 13d | 1 | 1.21mi |
| 1607 Burnet Ave Unit 1 Syracuse, NY | 3.0 | 1.0 | 2538 | $1,650 | $0.65 | 21d | 1 | 1.43mi |
| 447 E Washington St Syracuse, NY | 3.0 | 1.5 | 2095 | $2,100 | $1.00 | 13d | 1 | 1.49mi |
Listing history 2 events
-
2026-05-09status Pending 719-char remark
-
2026-05-07$239,900 Active 719-char remark
ⓘ Source: listings_history table (triggers on properties + properties_extension) + one-shot
backfill from property_details.listing_events for pre-trigger history.
Tax reassessment forecast NY · Partial reset (capped growth)
- Current annual tax
- $1,542 · $129/mo
- Projected year-2 tax
- $2,798 · $233/mo
- Expected delta
- +$1,256/yr (+$105/mo · 81.4%)
ⓘ Screening estimate from a state-policy table — verify with the county assessor before closing.
Climate risk First Street
- Flood 1/10 Low FEMA zone X (unshaded) · 0% chance over 30 yrs
- Wildfire 1/10 Low
- Heat 3/10 Moderate 7 d/yr ≥95°F today · 16 d/yr by 30 yrs out
- Wind 1/10 Low 100% chance of damaging wind over 30 yrs
- Air quality 2/10 Low 0 unhealthy d/yr today · 1 by 30 yrs out
Nearby sold comps map
Loading sold comps map…
Walkable amenities ~0.75 mi
Loading nearby amenities…
Taxation est. · year 1
- Rental income
- $37,764
- − Mortgage interest
- −$13,438
- − Property taxes
- −$1,542
- − Insurance
- −$1,200
- − Repairs & maintenance
- −$3,021
- − Management
- −$3,021
- − Depreciation
- −$6,979
- Taxable income
- $8,563
- Est. tax owed @ 24.0%
- −$2,055
- After-tax cash flow
- $9,940/yr
For passive investors: Depreciation is non-cash, so a rental often shows a tax loss while cash-flowing — sheltering income. Rental losses are passive: they offset passive income freely, and up to $25,000/yr can offset ordinary (W-2) income if you actively participate and your MAGI is under $100k (phasing out to $0 by $150k); unused losses carry forward. On sale, claimed depreciation is recaptured at up to 25%, and gains may owe capital-gains tax (a 1031 exchange can defer both). Figures are a year-1 estimate at your 24.0% rate — not tax advice; consult a CPA.
Schools (NCES district)
- District
- Syracuse City School District
- NCES district ID
- 3628590
- Math proficiency
- 18% ▼ -5.00%
- Reading proficiency
- 26% ▬ 0.00%
- Median HH income
- $32,097
- Composite
- 17.83/100
- National rank
- #9007
- State rank
- #590 of 590 in NY
Livability — Syracuse
- Score
- 77/100
- State rank
- #187
- US rank
- #2869
Category grades
Schools grade is shown separately in the Schools card above.
Census & demographics
- Census place
- Syracuse, NY
- County
- Onondaga County · 247,257 people
- City population
- 152,627
- Metro
- Syracuse, NY
- Population (ZIP)
- 16,180
- Household income
- $46,997
- Rent vs Own
- Severe rent burden
- 1566.0
Population outlook (Onondaga County) Hauer SSP2
- Today (2025)
- 467,894 people
- By 2030
- 463,381 · -1.0%
- By 2040
- 447,697 · -4.3%
- By 2050
- 426,399 · -8.9%
- By 2075
- 373,661 · -20.1%
- By 2100
- 307,967 · -34.2%
Race, ethnicity, and origin ACS 2023
- Neighborhood character
- Diverse neighborhood (Simpson 0.67)
- Race & ethnicity
- White 52% Black 22% Hispanic / Latino 11% Two or more races 9% Asian 7%
- Hispanic origin (detail)
- Puerto Rican 6% Cuban 2%
- Common ancestry
- Romanian 3% Lithuanian 2% Iranian 2%
- Foreign-born
- 13% · Canada, India, Philippines
- Languages at home
- 81% English-only · Spanish 6% Other Indo-European 3% Other Asian/Pacific 3%
Political lean MEDSL · Onondaga
- 2024 margin
- D (+17.3) · D 58.6% · R 41.4%
- 2008→2024 swing
- -3.0pp toward R · 2008: 20.3pp · 2024: 17.3pp
- All cycles
- 2024: D+17.3 2020: D+20.6 2016: D+12.8 2012: D+21.1 2008: D+20.3
Not yet ingested
- Civics
- —
Market trends
- HPI YoY
- ▼ -35.69%
- Current HPI
- 263.2588
- Rent YoY
- ▲ 8.39%
- Metro
- Syracuse, NY
- State GDP YoY
- ▲ 2.60%
- F500 in state
- 92
Industry mix (Fortune 500 HQ in NY)
| Industry | F500 HQs | Revenue |
|---|---|---|
| Financial Services | 10 | $950B |
|
||
| Consumer Goods | 9 | $162B |
|
||
| Insurance | 4 | $225B |
|
||
| Telecommunications | 2 | $144B |
|
||
| Pharmaceuticals | 2 | $112B |
|
||
| Media / Entertainment | 2 | $69B |
|
||
Price history
2 events — show timeline
- 2026-05-09 Pending — CNYIS
- 2026-05-07 Listed $239,900 CNYIS
Property tax history
-0.4%/yrLatest (2025): $1,542 · -0.1% YoY. Source: county tax records.
Cash-flow waterfall
monthlySold comps — $/sqft
last 12 mo · ≤1 miLoading sold comps…