112 Valley View Dr · Shawnee, OK
Flood risk 1/10 · Minimal
- FEMA flood zone
- X (unshaded)
- Chance of flooding over 30 yrs
- 0.0%
- Est. flood insurance / yr
- $507 – $1,088
Fire risk 8/10 · Major
- Est. fire insurance / yr
- $2,463 – $4,575
Heat risk 5/10 · Moderate
- Hot days now (above 109°F)
- 7 days/yr
- Hot days in 30 yrs
- 18 days/yr
Wind risk 4/10 · Minor
- Chance of severe wind over 30 yrs
- 9.0%
Air-quality risk 2/10 · Minimal
- Unhealthy air days now
- 1 days/yr
- Unhealthy air days in 30 yrs
- 1 days/yr
Risk factors via First Street. Map © Google.
Why this score? — see what drove the D grade
The composite is a weighted blend of 9 inputs, each scored 0–100. Each bar is that input's sub-score; the figure is the points it added to the 100-point composite (weight × sub-score).
- Cash flow +15.4/30.0
- ARV discount +7.5/15.0
- DSCR +4.7/10.0
- 1% rule +3.2/10.0
- Livability +3.2/5.0
- Rent growth +3.1/5.0
- Condition / age +2.5/5.0
- Schools +2.4/10.0
- Appreciation +0.0/10.0
$164,550
🖨 Deal sheet 📄 Offer letter ✓ Due diligence
Listing remarks
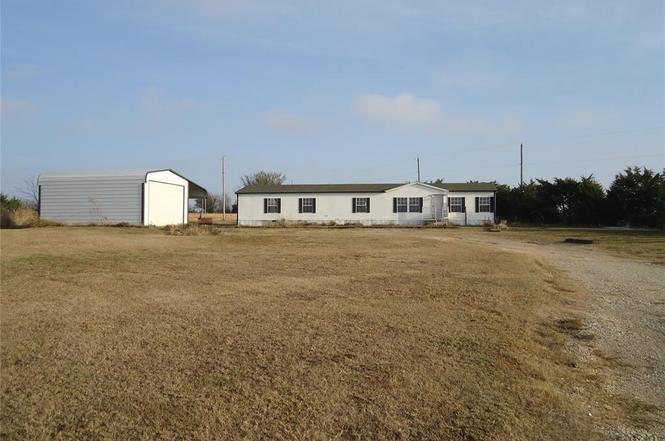
This one's ready for a new family and if quiet country living is what you're looking for this one might be for yours! This large home sits on just over an acre and offers 4 bedrooms, 3 baths, and 2 living areas one with a wood burning fireplace. The study/office, with closet, could easily be used as 5th bedroom. The property has beautiful sky-line views of the City of Shawnee and offers a detached 20'X25’ garage with electric and 10' lean to for storage. Located in the desirable Dale school district, just off of a paved road with easy access to Hwy 177 & I-40. Additional land is available. Roof with new gutters in 2024, 5-ton heat/ac unit in 2025. Priced to sell so take a look a
Key facts
- Water well
- Sky-line views
- Paved road access
Tags
Property features AI
Finance
- Other: Approximately 1.07 acres
- Financial info: Listing terms: Cash or Conventional
- HOA & community: No mandatory association dues
Exterior
- Parking: 1-car garage
- Utilities: Electricity available; High-speed internet; Septic tank; Private well available; Partial storm doors/windows and storm windows
- Home design: Single family residence; Residential property; One-level; Faces south; Move-to-site manufactured home
- Construction: Manufactured construction with vinyl siding; Composition roof (2024); Double pane windows; Conventional foundation
- Exterior features: Rain gutters; Storage; Chain link fencing; Rural lot
Interior
- Kitchen: Built-in electric range; Built-in electric oven; Dishwasher; Refrigerator; Water heater
- Bedrooms: 4 bedrooms
- Flooring: Carpet; Vinyl
- Bathrooms: 3 full bathrooms
- Heating & cooling: Electric heating
- Interior features: In-law plan; Inside utility; Optional bedroom; Study; Two living areas; Masonry fireplace
- Laundry & utility: Inside utility
Neighborhood map
What this means for you Summary
Snapshot
- This is a 3-bed/2.0-bath manufactured listed at $165k.
Deal economics
- At list price, monthly cash flow is $62 ($743/yr) — positive.
- The deal already cash-flows at list — no discount required.
- To meet the 1% rule (rent ≥ 1% of price), the offer needs to be $135k (17.8% below list).
- Recommended offer: $135k (17.8% below list) — sets the bar for 1% rule.
- Cap rate 6.7% vs local median 3.9% in Shawnee — top-decile yield for the area; either an underpriced asset or a hidden risk that comps aren't pricing in. Stress-test before assuming the spread holds.
Location & tenants
- Location reads 63/100 on livability (#217 in OK) — a middle-class / working-renter tenant base. Strengths: cost of living A+, housing A+; Watch: crime F, amenities F, commute F.
- Dale (rural): math 21% / reading 33% proficiency, ranked #76 of 270 in OK (top 28%) — low school quality limits family demand, transient renter base, plan for 1-2y turnover.
- Zoned schools: Dale Es (math 22% / reading 32%, grade F, #311 of 845 statewide, top 40%, 393 students, 0% FRL); Dale Hs (math 24% / reading 44%, grade F, #48 of 447 statewide, top 14%, 192 students, 0% FRL) — zoned schools average 0% FRL vs 30% district-wide (30 pts lower); this property's tenant base skews higher-income than the district average.
- Market conditions: Rents rising (+2.5%/yr); 389 active listings in the ZIP; 183 units permitted in Pottawatomie County in 2024 (16 in 5+ unit buildings).
Forward outlook
- Local home prices are declining (-3.0%/yr); year-one equity from $1k of loan paydown is wiped out by about $5k of value loss. Plan a longer hold.
- Pottawatomie County population projected at +12% by 2050 — modest demand growth; plan on rents tracking national, not racing it.
Negotiation context
- It's been on market 144 days — a 12% lower offer ($145k) is reasonable based on typical stale-listing flexibility.
- Current owner paid $21k; list at $165k implies a 684% gain — meaningful room to come down on a strong offer.
Risks & watch-outs
- Climate carrying-cost: severe wildfire risk; extreme-heat days projected 7→18/yr by 2055 (HVAC capex compounding) — expect insurance premiums to compound above CPI over the hold.
Questions for the listing agent
- It's been on market 144 days. Have you received any prior offers? Is the seller open to a 18% concession, seller financing, or rate buy-down credit?
- Why hasn't it sold? Are there any deal-killer items the seller is aware of (foundation, flood, title, zoning, code violations)?
- Is there a deadline driving the sale (1031 exchange, divorce, estate, relocation)? That informs how much negotiation room exists.
- Schools are F-rated, which usually means shorter tenancies and higher turnover. Who's the typical renter profile here, and what's been the actual vacancy rate?
- Crime grade is F in this area — have there been break-ins, vandalism, or insurance claims at this property in the last 3 years? What carrier currently insures it and at what premium?
- The area grade is low — what's the realistic commute time and amenity access for the typical tenant pool here? Any planned neighborhood developments (good or bad) we should know about?
- What's the average days-on-market for RENTAL listings here right now (not sales)? A rising rental-DOM trend means longer vacancies and softer asking-rent achievability than the comps imply.
- What's the recent tenant-quality profile in this submarket — average credit score on applications, eviction rate, late-payment / NSF rate, and stable-employment percentage? A property-management company in the area should have these aggregated.
- How much new for-sale + rental construction is in the pipeline within 1–3 miles? Heavy new supply typically softens prices + rents 12–24 months out; constrained supply supports both.
Investment metrics
- 1% rule
- 0.82% ✗
- Cap rate
- 6.74%
- Cash-on-cash
- 1.61%
- DSCR
- 1.07
- GRM
- 10.1
CMA / ARV
No comps found within radius.
Projected returns pro-forma
-3.0% appreciation · 2.49% rent growth · sell at horizon
- IRR
- -14.3%
- Equity multiple
- 0.49×
- Total profit
- $-23,470
- Equity at exit
- $24,535
- IRR
- -6.4%
- Equity multiple
- 0.60×
- Total profit
- $-18,406
- Equity at exit
- $14,227
Cash invested: $46,074 (down + closing). Projections, not guarantees.
Landlord ↔ Tenant lean methodology
- Overall (STATE)
- 83 Strongly Landlord-Friendly
- State Oklahoma
- 83 Strongly Landlord-Friendly · R+20
- County
- — inherits STATE
- City
- — inherits STATE
ZIP-level market 74804
- Home prices YoY
- -25.1%
- Rents YoY
- 2.5%
- Active inventory
- 389
- Price-to-rent
- 10.1×
Monthly cashflow live
- Estimated rent
- $1,353 medium interval (Pro) →
- Mortgage (P&I)
- −$863
- Tax from tax record
- −$75 /mo · $903/yr
- Insurance
- −$69
- HOA
- −$0
- Vacancy / Maint / Mgmt
- −$284
- Net cashflow
- $62
Break-even live
UW: 25.0% down · 7.5% · 30yr · 1.5% tax · 5.0% vac · 8.0% maint · 8.0% mgmt
Financing live
Cash to close
- Down payment
- $41,138
- Closing costs
- $4,936
- Reserves months
- —
- Total cash needed
- —
Loan-product check · same deal, 3 products live
Conventional
25% down · 7.5% · 30yr
- Down + closing
- —
- Monthly P&I
- —
- Monthly cashflow
- —
- DSCR
- —
- Eligible?
- —
Personal DTI + credit; lowest rate.
DSCR
20% down · 8.5% · 30yr
- Down + closing
- —
- Monthly P&I
- —
- Monthly cashflow
- —
- DSCR
- —
- Eligible?
- —
No personal income docs; deal must DSCR.
Hard money
10% down · 12.0% · 12mo
- Down + closing
- —
- Monthly P&I
- —
- Monthly cashflow
- —
- DSCR
- —
- Eligible?
- —
Short-term bridge; refi at stabilization.
Listing history 6 events
-
2026-04-29status Pending
-
2026-03-23price $164,550
-
2026-02-25price $169,550
-
2026-01-29price $179,550
-
2025-12-04$190,000 Active
-
2007-09-10soldstatus $21,000
ⓘ Source: listings_history table (triggers on properties + properties_extension) + one-shot
backfill from property_details.listing_events for pre-trigger history.
Tax reassessment forecast OK · Resets to sale price
- Current annual tax
- $903 · $75/mo
- Projected year-2 tax
- $1,481 · $123/mo
- Expected delta
- +$578/yr (+$48/mo · 64.0%)
ⓘ Screening estimate from a state-policy table — verify with the county assessor before closing.
Climate risk First Street
- Flood 1/10 Low FEMA zone X (unshaded) · 0% chance over 30 yrs
- Wildfire 8/10 Severe
- Heat 5/10 Major 7 d/yr ≥109°F today · 18 d/yr by 30 yrs out
- Wind 4/10 Moderate 9% chance of damaging wind over 30 yrs
- Air quality 2/10 Low 1 unhealthy d/yr today · 1 by 30 yrs out
Nearby sold comps map
Loading sold comps map…
Walkable amenities ~0.75 mi
Loading nearby amenities…
Taxation est. · year 1
- Rental income
- $16,233
- − Mortgage interest
- −$9,217
- − Property taxes
- −$903
- − Insurance
- −$823
- − Repairs & maintenance
- −$1,299
- − Management
- −$1,299
- − Depreciation
- −$4,787
- Taxable loss
- −$2,094
- Est. tax savings @ 24.0%
- +$503
- After-tax cash flow
- $1,246/yr
For passive investors: Depreciation is non-cash, so a rental often shows a tax loss while cash-flowing — sheltering income. Rental losses are passive: they offset passive income freely, and up to $25,000/yr can offset ordinary (W-2) income if you actively participate and your MAGI is under $100k (phasing out to $0 by $150k); unused losses carry forward. On sale, claimed depreciation is recaptured at up to 25%, and gains may owe capital-gains tax (a 1031 exchange can defer both). Figures are a year-1 estimate at your 24.0% rate — not tax advice; consult a CPA.
Schools (NCES district)
- District
- Dale
- NCES district ID
- 4009390
- Math proficiency
- 21% ▼ -13.00%
- Reading proficiency
- 33% ▼ -13.00%
- Median HH income
- $53,652
- Composite
- 24.02/100
- National rank
- #7773
- State rank
- #76 of 270 in OK
Livability — Shawnee
- Score
- 63/100
- State rank
- #217
- US rank
- #15593
Category grades
Schools grade is shown separately in the Schools card above.
Census & demographics
- County
- Pottawatomie County · 45,194 people
- City population
- 45,194
- Metro
- Shawnee, OK
- Population (ZIP)
- 23,227
- Household income
- $67,631
- Rent vs Own
- Severe rent burden
- 442.0
Population outlook (Pottawatomie County) Hauer SSP2
- Today (2025)
- 76,622 people
- By 2030
- 78,816 · +2.9%
- By 2040
- 82,766 · +8.0%
- By 2050
- 86,031 · +12.3%
- By 2075
- 93,316 · +21.8%
- By 2100
- 95,820 · +25.1%
Race, ethnicity, and origin ACS 2023
- Neighborhood character
- Predominantly White (70%)
- Race & ethnicity
- White 70% Two or more races 11% Native American 11% Hispanic / Latino 6% Black 4%
- Hispanic origin (detail)
- Mexican 4%
- Common ancestry
- Slovak 2% Lithuanian 2% Italian 1%
- Foreign-born
- 3% · Canada
- Languages at home
- 96% English-only · Spanish 3%
Political lean MEDSL · Pottawatomie
- 2024 margin
- Solid R (+47.4) · D 25.2% · R 72.7% · Other 2.1%
- 2008→2024 swing
- -9.1pp toward R · 2008: -38.4pp · 2024: -47.4pp
- All cycles
- 2024: R+47.4 2020: R+46.0 2016: R+46.5 2012: R+38.7 2008: R+38.4
Not yet ingested
- Civics
- —
Market trends
- HPI YoY
- ▼ -83.01%
- Current HPI
- 247.115
- Rent YoY
- ▲ 2.49%
- Metro
- Shawnee, OK
- State GDP YoY
- ▲ 1.55%
- F500 in state
- 6
Industry mix (Fortune 500 HQ in OK)
| Industry | F500 HQs | Revenue |
|---|---|---|
| Energy | 3 | $48B |
|
||
Price history
+683.6% since first listed6 events — show timeline
- 2026-04-29 Pending — MLSOK
- 2026-03-23 Price Changed $164,550 MLSOK
- 2026-02-25 Price Changed $169,550 MLSOK
- 2026-01-29 Price Changed $179,550 MLSOK
- 2025-12-04 Listed $190,000 MLSOK
- 2007-09-10 Sold (Public Records) $21,000 Public Records
Property tax history
+12.9%/yrLatest (2025): $903 · +294.3% YoY. Source: county tax records.
Cash-flow waterfall
monthlySold comps — $/sqft
last 12 mo · ≤1 miLoading sold comps…