 Multi-family
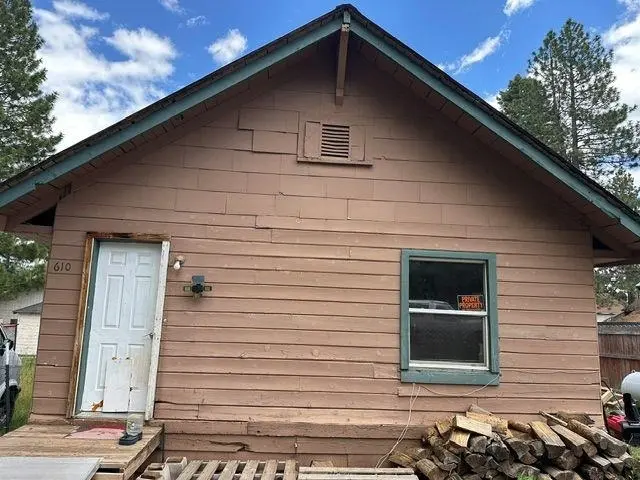
610 Elm St · Westwood, CA
Flood risk 1/10 · Minimal
- FEMA flood zone
- X (unshaded)
- Chance of flooding over 30 yrs
- 0.0%
- Est. flood insurance / yr
- $507 – $1,088
Fire risk 7/10 · Major
- Est. fire insurance / yr
- $659 – $1,223
Heat risk 3/10 · Minor
- Hot days now (above 87°F)
- 7 days/yr
- Hot days in 30 yrs
- 17 days/yr
Wind risk 1/10 · Minimal
- Chance of severe wind over 30 yrs
- —
Air-quality risk 10/10 · Severe
- Unhealthy air days now
- 24 days/yr
- Unhealthy air days in 30 yrs
- 26 days/yr
Risk factors via First Street. Map © Google.
Why this score? — see what drove the B grade
The composite is a weighted blend of 9 inputs, each scored 0–100. Each bar is that input's sub-score; the figure is the points it added to the 100-point composite (weight × sub-score).
- Cash flow +30.0/30.0
- 1% rule +10.0/10.0
- DSCR +10.0/10.0
- ARV discount +7.5/15.0
- Appreciation +5.7/10.0
- Livability +3.1/5.0
- Schools +3.0/10.0
- Rent growth +2.5/5.0
- Condition / age +2.5/5.0
$185,000
🖨 Deal sheet 📄 Offer letter ✓ Due diligence
Multi-family units
County records classify this as Multi-Family (2-4 Unit). Listing-text estimate: 1 unit. estimate disagrees with records
Listing remarks MLS
2 houses on 1 property. Front house is a 3 bedroom, 1 bath home, new hardwood floors, new central propane heater, approximately 1,056 square feet. Back alley assess house is a 2 bedroom, 1 bath home, approximately 640 square feet. Both houses are livable but need TLC, Seller will carry 1st trust deed at 6% interest.
Key facts
- Rental in backyard
- Tin roof
- 7,405 sq ft lot
Tags
Property features AI
Exterior
- Parking: 4 open parking spaces
- Home design: Duplex (residential income property)
- Exterior features: Lot dimensions approximately 50' front, 155' right, 47' back, 156' left; Zoned R
Interior
- Bedrooms: Unit 1: 3 bedrooms; Unit 2: 2 bedrooms
- Bathrooms: Unit 1: 1 bathroom; Unit 2: 1 bathroom
- Interior features: No basement
Neighborhood map
What this means for you Summary
Snapshot
- This is a 3-bed/1.0-bath multifamily listed at $185k.
Deal economics
- At list price, monthly cash flow is $1k ($17k/yr) — positive.
- The deal already cash-flows at list — no discount required.
- Meets the 1% rule at list price ($3k rent vs $185k).
- Recommended offer: $182k (1.5% below list) — sets the bar for market timing.
Location & tenants
- Location reads 61/100 on livability (#547 in CA) — a middle-class / working-renter tenant base. Strengths: housing A+, crime B; Watch: amenities F, commute F, employment D-.
- Westwood Unified (rural): math 30% / reading 35% proficiency, ranked #995 of 1,400 in CA (top 71%) — families likely to look elsewhere, expect single-tenant / working-renter base with shorter leases.
- Market conditions: 240 active listings in the ZIP; 6 units permitted in Lassen County in 2024 (0 in 5+ unit buildings).
Forward outlook
- In year one you build about $4k of equity ($1k loan paydown + $3k appreciation (1.4% local appreciation)).
- Lassen County population projected at -14% by 2050 — secular population decline; favor cash flow + early exit over multi-decade hold.
- At projected returns (1.4% appreciation + 3.0% rent growth), your $52k cash investment doubles in ~3 years — after that, you're playing with house money.
- By year 9, paydown + projected appreciation supports a ~$34k cash-out refi (75% LTV) — recoverable capital for the next deal without selling this one.
Negotiation context
- It's been on market 24 days — a 2% lower offer ($182k) is reasonable based on typical stale-listing flexibility.
- 3 sale attempts since 11y ago with the ask held roughly flat each time — persistent listings suggest the price (not the market) is what's stuck; bring a comps-based counter.
- Current owner paid $72k; list at $185k implies a 157% gain — meaningful room to come down on a strong offer.
Risks & watch-outs
- Watch-outs: built in 1945 — expect roof / HVAC / electrical / plumbing capex.
- Climate carrying-cost: major wildfire risk — expect insurance premiums to compound above CPI over the hold.
Questions for the listing agent
- Built in 1945 — when were the roof, HVAC, electrical panel, plumbing, and water heater last replaced?
- Is there a deadline driving the sale (1031 exchange, divorce, estate, relocation)? That informs how much negotiation room exists.
- What's the average days-on-market for RENTAL listings here right now (not sales)? A rising rental-DOM trend means longer vacancies and softer asking-rent achievability than the comps imply.
- What's the recent tenant-quality profile in this submarket — average credit score on applications, eviction rate, late-payment / NSF rate, and stable-employment percentage? A property-management company in the area should have these aggregated.
- How much new apartment / multifamily construction is in the pipeline within 1–3 miles? Heavy new supply (>2% of stock underway) typically softens rents 12–24 months out; light construction supports rent growth.
Investment metrics
- 1% rule
- 1.73% ✓
- Cap rate
- 15.40%
- Cash-on-cash
- 32.53%
- DSCR
- 2.45
- GRM
- 4.8
CMA / ARV
No comps found within radius.
Projected returns pro-forma
1.38% appreciation · 3.0% rent growth · sell at horizon
- IRR
- 35.6%
- Equity multiple
- 2.86×
- Total profit
- $96,289
- Equity at exit
- $66,813
- IRR
- 37.3%
- Equity multiple
- 5.59×
- Total profit
- $237,857
- Equity at exit
- $91,689
Cash invested: $51,800 (down + closing). Projections, not guarantees.
Landlord ↔ Tenant lean methodology
- Overall (STATE)
- 18 Strongly Tenant-Friendly
- State California
- 18 Strongly Tenant-Friendly · D+13
- County
- — inherits STATE
- City
- — inherits STATE
ZIP-level market 96137
- Home prices YoY
- 0.9%
- Active inventory
- 240
- Price-to-rent
- 9.2×
Monthly cashflow live
- Estimated rent
- $3,195 medium interval (Pro) →
- Mortgage (P&I)
- −$970
- Tax from tax record
- −$73 /mo · $870/yr
- Insurance
- −$77
- HOA
- −$0
- Vacancy / Maint / Mgmt
- −$671
- Net cashflow
- $1,404
Break-even live
2-unit breakdown (identical units grouped — click to expand)
| Units | Beds | Baths | Est. rent |
|---|---|---|---|
| 1× unit | 3 | 1 | $1,680 |
| 1× unit | 2 | 1 | $1,516 |
| Total (2 units) | $3,195 | ||
UW: 25.0% down · 7.5% · 30yr · 1.5% tax · 5.0% vac · 8.0% maint · 8.0% mgmt
Financing live
Cash to close
- Down payment
- $46,250
- Closing costs
- $5,550
- Reserves months
- —
- Total cash needed
- —
Loan-product check · same deal, 3 products live
Conventional
25% down · 7.5% · 30yr
- Down + closing
- —
- Monthly P&I
- —
- Monthly cashflow
- —
- DSCR
- —
- Eligible?
- —
Personal DTI + credit; lowest rate.
DSCR
20% down · 8.5% · 30yr
- Down + closing
- —
- Monthly P&I
- —
- Monthly cashflow
- —
- DSCR
- —
- Eligible?
- —
No personal income docs; deal must DSCR.
Hard money
10% down · 12.0% · 12mo
- Down + closing
- —
- Monthly P&I
- —
- Monthly cashflow
- —
- DSCR
- —
- Eligible?
- —
Short-term bridge; refi at stabilization.
Listing history 23 events
-
2026-06-19days on market $185,000 Active 24 DOM
-
2026-06-18days on market $185,000 Active 23 DOM
-
2026-06-17days on market $185,000 Active 22 DOM
-
2026-06-16days on market $185,000 Active 21 DOM
-
2026-06-15days on market $185,000 Active 20 DOM
-
2026-06-14days on market $185,000 Active 18 DOM
-
2026-06-12days on market $185,000 Active 17 DOM
-
2026-06-09days on market $185,000 Active 14 DOM
-
2026-06-08days on market $185,000 Active 13 DOM
-
2026-06-07days on market $185,000 Active 12 DOM
-
2026-06-04days on market $185,000 Active 8 DOM
-
2026-06-02days on market $185,000 Active 7 DOM
-
2026-06-01days on market $185,000 Active 6 DOM
-
2026-05-31days on market $185,000 Active 5 DOM
-
2026-05-31days on market $185,000 Active 4 DOM
-
2026-05-19$185,000 Active
-
2015-09-28soldstatus $72,000 317-char remark
Show marketing remark (317 chars)
2 houses on 1 property. Front house is a 3 bedroom, 1 bath home, new hardwood floors, new central propane heater, approximately 1,056 square feet. Back alley assess house is a 2 bedroom, 1 bath home, approximately 640 square feet. Both houses are livable but need TLC, Seller will carry 1st trust deed at 6% interest.
-
2015-09-18soldstatus $72,000
-
2015-08-18soldstatus $72,000 286-char remark
Show marketing remark (286 chars)
2 houses on 1 property. Front house is a 3 bedroom, 1 bath home, new hardwood floors, new central propane heat, approx 1,056 square feet. Back house is a 2 bedroom, 1 bath home, alley assess, approx 640 square feet. Both houses need TLC. Seller will carry 1st trust deed at 6% interest.
-
2015-02-19$64,900 317-char remark
Show marketing remark (317 chars)
2 houses on 1 property. Front house is a 3 bedroom, 1 bath home, new hardwood floors, new central propane heater, approximately 1,056 square feet. Back alley assess house is a 2 bedroom, 1 bath home, approximately 640 square feet. Both houses are livable but need TLC, Seller will carry 1st trust deed at 6% interest.
-
2015-01-06$64,900 286-char remark
Show marketing remark (286 chars)
2 houses on 1 property. Front house is a 3 bedroom, 1 bath home, new hardwood floors, new central propane heat, approx 1,056 square feet. Back house is a 2 bedroom, 1 bath home, alley assess, approx 640 square feet. Both houses need TLC. Seller will carry 1st trust deed at 6% interest.
-
2013-11-18soldstatus $50,000
-
1996-03-21soldstatus $43,000
ⓘ Source: listings_history table (triggers on properties + properties_extension) + one-shot
backfill from property_details.listing_events for pre-trigger history.
Tax reassessment forecast CA · Resets to sale price
- Current annual tax
- $870 · $73/mo
- Projected year-2 tax
- $1,406 · $117/mo
- Expected delta
- +$536/yr (+$45/mo · 61.6%)
ⓘ Screening estimate from a state-policy table — verify with the county assessor before closing.
Climate risk First Street
- Flood 1/10 Low FEMA zone X (unshaded) · 0% chance over 30 yrs
- Wildfire 7/10 Severe
- Heat 3/10 Moderate 7 d/yr ≥87°F today · 17 d/yr by 30 yrs out
- Wind 1/10 Low
- Air quality 10/10 Extreme 24 unhealthy d/yr today · 26 by 30 yrs out
Nearby sold comps map
Loading sold comps map…
Walkable amenities ~0.75 mi
Loading nearby amenities…
Taxation est. · year 1
- Rental income
- $38,340
- − Mortgage interest
- −$10,363
- − Property taxes
- −$870
- − Insurance
- −$925
- − Repairs & maintenance
- −$3,067
- − Management
- −$3,067
- − Depreciation
- −$5,382
- Taxable income
- $14,666
- Est. tax owed @ 24.0%
- −$3,520
- After-tax cash flow
- $13,332/yr
For passive investors: Depreciation is non-cash, so a rental often shows a tax loss while cash-flowing — sheltering income. Rental losses are passive: they offset passive income freely, and up to $25,000/yr can offset ordinary (W-2) income if you actively participate and your MAGI is under $100k (phasing out to $0 by $150k); unused losses carry forward. On sale, claimed depreciation is recaptured at up to 25%, and gains may owe capital-gains tax (a 1031 exchange can defer both). Figures are a year-1 estimate at your 24.0% rate — not tax advice; consult a CPA.
Schools (NCES district)
- District
- Westwood Unified
- NCES district ID
- 0642300
- Math proficiency
- 30% ▬ 0.00%
- Reading proficiency
- 35% ▼ -10.00%
- Median HH income
- $38,831
- Composite
- 29.93/100
- National rank
- #11664
- State rank
- #995 of 1400 in CA
Livability — Westwood
- Score
- 61/100
- State rank
- #547
- US rank
- #18201
Category grades
Schools grade is shown separately in the Schools card above.
Census & demographics
- Census place
- Westwood, CA
- Population (ZIP)
- 2,717
Population outlook (Lassen County) Hauer SSP2
- Today (2025)
- 27,112 people
- By 2030
- 26,732 · -1.4%
- By 2040
- 25,536 · -5.8%
- By 2050
- 23,262 · -14.2%
- By 2075
- 18,620 · -31.3%
- By 2100
- 14,679 · -45.9%
Race, ethnicity, and origin ACS 2023
- Neighborhood character
- Predominantly White (81%)
- Race & ethnicity
- White 81% Hispanic / Latino 10% Two or more races 8% Native American 4%
- Hispanic origin (detail)
- Mexican 5%
- Common ancestry
- Slovak 4% Lithuanian 3% Italian 2%
- Foreign-born
- 4% · Canada
- Languages at home
- 93% English-only · Spanish 5% Other Indo-European 1%
Political lean MEDSL · Lassen
- 2024 margin
- Solid R (+54.0) · D 21.8% · R 75.8% · Other 2.4%
- 2008→2024 swing
- -19.8pp toward R · 2008: -34.2pp · 2024: -54.0pp
- All cycles
- 2024: R+54.0 2020: R+51.5 2016: R+51.3 2012: R+39.8 2008: R+34.2
Not yet ingested
- Civics
- —
Market trends
- HPI YoY
- ▲ 1.38%
- Current HPI
- 153.1005
- Rent YoY
- —
- Metro
- —
- State GDP YoY
- ▲ 3.21%
- F500 in state
- 116
Industry mix (Fortune 500 HQ in CA)
| Industry | F500 HQs | Revenue |
|---|---|---|
| Technology | 27 | $1,492B |
|
||
| Financial Services | 3 | $174B |
|
||
| Retail | 3 | $44B |
|
||
| Insurance | 3 | $26B |
|
||
| Media / Entertainment | 2 | $115B |
|
||
| Pharmaceuticals / Biotech | 2 | $62B |
|
||
Price history
+330.2% since first listed8 events — show timeline
- 2026-05-19 Listed $185,000 TCAOR
- 2015-09-28 Sold (MLS) $72,000 PAR
- 2015-09-18 Sold (Public Records) $72,000 Public Records
- 2015-08-18 Sold (MLS) $72,000 LAORMLS
- 2015-02-19 Listed $64,900 PAR
- 2015-01-06 Listed $64,900 LAORMLS
- 2013-11-18 Sold (Public Records) $50,000 Public Records
- 1996-03-21 Sold (Public Records) $43,000 Public Records
Property tax history
+4.5%/yrLatest (2025): $870 · +2.0% YoY. Source: county tax records.
Cash-flow waterfall
monthlySold comps — $/sqft
last 12 mo · ≤1 miLoading sold comps…